Review
. 2018 Dec;243(17-18):1256-1264.
doi: 10.1177/1535370218816517. Epub 2018 Nov 27.

Functional optical coherence tomography of retinal photoreceptors

Affiliations
Review

Functional optical coherence tomography of retinal photoreceptors

Xincheng Yao et al. Exp Biol Med (Maywood). 2018 Dec.

Abstract

Retinal photoreceptors are the primary target of age-related macular degeneration (AMD) which is the leading cause of severe vision loss and legal blindness. An objective method for functional assessment of photoreceptor physiology can benefit early detection and better treatment evaluation of AMD and other eye diseases that are known to cause photoreceptor dysfunctions. This article summarizes in vitro study of IOS mechanisms and in vivo demonstration of IOS imaging of intact animals. Further development of the functional IOS imaging may provide a revolutionary solution to achieve objective assessment of human photoreceptors.

Keywords: Optical coherence tomography; age-related macular degeneration; intrinsic optical signal; photoreceptors.


Figures

Figure 1.
Figure 1.
(a) A schematic diagram of the human eye with a schematic enlargement of the retina. (b) Schematic diagram of the human retina. Retinal photoreceptors consist of rods and cones. Red, green, and blue cones are responsible for color perception. (c) Histological image of a cross-sectional slice of the central human retina. (d) Typical full-field ERG waveform. (a), (b) and (c) reprinted with permission from Simple Anatomy of the Retina. (d) reprinted with permission from The Electroretinogram: ERG. (A color version of this figure is available in the online journal.)
Figure 2.
Figure 2.
(a) Representative OCT image of human retina. (b) Representative OCT image of mouse retina. NFL: nerve fiber layer; GCL: ganglion cell layer; IPL: inner plexiform layer; INL: inner nuclear layer; OPL: outer plexiform layer; ONL: outer nuclear layer; ELM: external limiting membrane; ISe: inner segment ellipsoid; OS: outer segment, RPE/BrM: retinal pigment epithelium/Bruch’s membrane. Scale bars in (a) and (b) indicate 300 µm. From Xincheng Yao’s lab image gallery.
Figure 3.
Figure 3.
(a) Schematic diagram of the time-domain OCT. SLD was a superluminescent laser diode with a 793-nm center wavelength and 15-nm full width at half maximum (FWHM) spectral width. EOPM was the electro-optic phase modulator. BK7 glass block was used for compensating chromatic aberration of the EOPM. A 10×/NA0.25 objective was used to illuminate the sample with a light power ∼150 μW and collect the backward scattering light. (b) During the recording, a frog retina was immersed in Ringer, and pressed to an MEA (multi-electrode array) with moderate pressure. The photoreceptor layer was upward, closest to the light source. The ganglion layer was in contact with the MEA. (c) Comparative electrophysiological and IOS recording. (C1) A 10-ms voltage pulse was used to drive a white LED (Light Emitting Diode), and the light flash stimulated the frog retina. (c2) Electrophysiological response associated with the light stimulus. (c3) Scattering response at the photoreceptor layer. (c4) Scattering response at the ganglion layer. Reprinted with permission from Yao et al.
Figure 4.
Figure 4.
(a) Schematic diagram of the time domain line-scan OCT. (a1) Top view of the system. CO: collimator; L1-L5: lenses, with focal lengths 80 mm, 40 mm, 80 mm, 40 mm, 75 mm, respectively; OB: objective (10×, NA = 0.3); CL1 and CL2: cylindrical lenses, with focal lengths 75 mm; BS: beam splitter; DM: dichroic mirror; Sti: green light stimulus; EOPM: electro-optic phase modulator. (a2) Side view of blue rectangle area in (a1). (b) Representative B-scan (b1) and en face (b2) images of a frog eyecup. The red rectangle area in (b2) shows the area where IOS images were acquired in (c). The white spot indicates the green light stimulus. (c) Representative IOS images, with time interval of 50 ms. A 10 ms green light stimulus was introduced at time 0 (c2). Rapid IOS occurred immediately after the stimulation, mixed positive and negative IOSs were observed. (d) Dynamic properties of positive (red trace) and negative (blue trace) IOSs. (d1) Separate averages of positive and negative IOSs. Red curves represent positive IOS; blue curves represent negative IOS. Shadow areas show standard deviations. (d2) Onset time and half-peak time of average IOSs. Red bars represent positive IOS; blue bars represent negative IOS. Reprinted with permission from Wang et al. (A color version of this figure is available in the online journal.)
Figure 5.
Figure 5.
(a) Spectral-domain OCT with integrated fundus imager. SLD: superluminescent diode; PC: polarization controller; CL: collimation lens; NDF: neutral density filter; DCB: dispersion compensating block; SGM: scanning galvanometer mirror; BS: beam splitter; DM: dichroic mirror, FE: frog eye; CCD: charge-coupled device; L1–L4: lens. Focal lengths of lenses L1, L2, L3 and L4 were 75 mm, 100 mm, 35 mm, and 25 mm, respectively. (b1) Fundus image revealed blood vessels around the optic nerve head (ONH) of a frog retina. (b2) OCT B-scan image of the retinal area marked by the red line in (b1). (c) Histological image of a frog retina. (d) OCT B-scan image of a frog retina. The red profile in (d) shows the averaged OCT reflectance along each retinal layer, i.e. averaged A-scans. The outer segment region is marked in yellow dashed rectangles in both the histological image (c) and OCT B-scan image (d). The OCT B-scan image contains both hyperreflective and hyporeflective bands. Scale bars indicate 100 µm. Reprinted with permission from Zhang et al. (A color version of this figure is available in the online journal.)
Figure 6.
Figure 6.
Representative in vivo IOS imaging. A 10-ms flash stimulus was used for retinal stimulation of the frog eye. Raw OCT images were collected with a frame rate of 100 Hz. Stimulus onset is indicated by time “0”. OCT B-scan images are presented with a linear scale, as opposed to logarithmic scale in conventional OCT systems. (a1–a3) OCT B-scan images and spatial IOS image sequences of one control and two experimental groups. All the images were averaged over 10 frames (100 ms interval). Images consisted of 140 pixels (lateral) × 200 pixels (axial), corresponding to 200 mm (lateral) × 360 mm (axial). (b) Temporal curves of the number of activated (positive and negative) pixels corresponding to (a1–a3). (c) Temporal curves of positive and negative IOSs averaged from six recording trials. (d) To better visualize the signal onset time, an enlarged profile of the early 80 ms period from (c) is illustrated. (e) IOS distribution map superimposed on the OCT B-scan image. Red and green dots in (e) present areas with positive signals (increasing reflectance) and negative signals (decreasing reflectance), respectively. Signal magnitude is not indicated in the image. (f) Comparative OCT-IOS and histological images of the outer retina. In the histological image, cone photoreceptors are highlighted in green or red to show cell sizes and locations. Cone photoreceptor outer segments (OSs) highlighted with red circles are located at the level of the rod inner segment ellipsoid (ISe). Scale bars indicate 50 µm. Reprinted with permission from Zhang et al. (A color version of this figure is available in the online journal.)
Figure 7.
Figure 7.
(a) Representative en face OCT (a1) and OCTA (a2) images of a mouse retina. The red circle in (a2) illustrates the circular scanning path for collecting the B-scan OCT in (b). (b) Representative B-scan OCT (b1), OCTA (b2), binary-OCTA (b3) and vessel-free OCT (b4). For vessel-free OCT (b4), the binary-OCTA (b3) was used as a mask to exclude vasculatures from the OCT image (b1). Scale bars in (a1) and (b1) indicate 500 µm. Modified with permission from Son et al. (A color version of this figure is available in the online journal.)
Figure 8.
Figure 8.
(a) Representative flattened B-scan OCT (a1) and spatiotemporal neural-IOS map (a2). (b) Representative flattened B-scan OCTA (b1) and spatiotemporal hemodynamic-IOS map (b2). Scale bars in (a1) and (b1) indicate 500 µm. (c) Neural-IOS changes of photoreceptor layer (PL), outer plexiform layer (OPL), inner plexiform layer (IPL), and ganglion cell layer (GCL). (d) Hemodynamic-IOS changes of superficial vascular plexiform (SVP), intermediate capillary plexiform (ICP), and deep capillary plexiform (DCP). (e) Averaged onset times of neural-IOS changes at PL, OPL, IPL, and GCL. (f) Averaged onset times of hemodynamic-IOS changes of SVP, ICP, and DCP. Modified with permission from Son et al. (A color version of this figure is available in the online journal.)
Figure 9.
Figure 9.
(a) Schematic diagram of retinal photoreceptors of leopard frog. (b) Histological images of dark-adapted (b1) and light-adapted (b2) frog eyes. The red arrows indicate cone photoreceptors and the green arrows indicate rod photoreceptors. INL: inner nuclear layer; OPL: outer plexiform layer; ONL: outer nuclear layer; IS: inner segment; OS: outer segment; RPE: retina pigment epithelium; BrM: Bruch’s membrane; ChC: choriocapillaris. (a) Reprinted from Nilsson, with permission from Elsevier. (b) Reprinted with permission from Zhang et al. (A color version of this figure is available in the online journal.)
Figure 10.
Figure 10.
(a) Representative super-resolution of photoreceptor (a1) and ganglion fiber (a2) layers. (b) Oblique stimulation evoked transient photoreceptor (PR) movement. (c) Peak magnitude (c1), onset time (c2) and time-to-peak (C3) of the transient PR movement. (a) Reprinted with permission from Liu et al. (b) and (c) reprinted with permission from Lu et al. (A color version of this figure is available in the online journal.)

Similar articles

Cited by

References

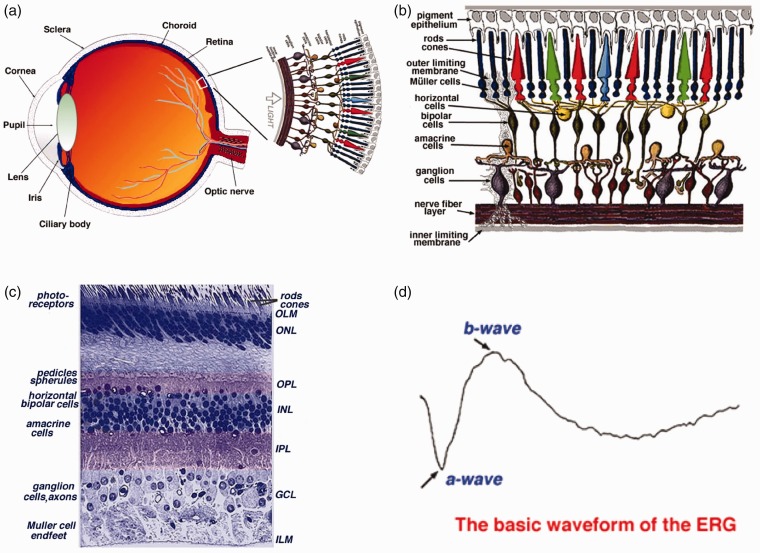
    1. Simple Anatomy of the Retina by Helga Kolb, http://webvision.med.utah.edu/book/part-i-foundations/simple-anatomy-of-... (2011, accessed 10 October 2018)
    1. Friedman DS, O'Colmain BJ, Munoz B, Tomany SC, McCarty C, de Jong PT, Nemesure B, Mitchell P, Kempen J; Eye Diseases Prevalence Research Group. Prevalence of age-related macular degeneration in the United States. Arch Ophthalmol 2004; 122:564–72 - PubMed
    1. Deangelis MM, Silveira AC, Carr EA, Kim IK. Genetics of age-related macular degeneration: current concepts, future directions. Semin Ophthalmol 2011; 26:77–93 - PMC - PubMed
    1. Ishikawa K, Nishihara H, Ozawa S, Piao CH, Ito Y, Kondo M, Terasaki H. Focal macular electroretinograms after photodynamic therapy combined with intravitreal bevacizumab. Graefes Arch Clin Exp Ophthalmol 2011; 249:273–80 - PubMed
    1. Feigl B, Morris CP. The challenge of predicting macular degeneration. Curr Med Res Opin 2011; 27:1745–8 - PubMed

Publication types

MeSH terms