. 2018 Nov 28;16(1):137.
doi: 10.1186/s12915-018-0593-5.

Nuclear genome sequence of the plastid-lacking cryptomonad Goniomonas avonlea provides insights into the evolution of secondary plastids

Affiliations

Nuclear genome sequence of the plastid-lacking cryptomonad Goniomonas avonlea provides insights into the evolution of secondary plastids

Ugo Cenci et al. BMC Biol. .

Abstract

Background: The evolution of photosynthesis has been a major driver in eukaryotic diversification. Eukaryotes have acquired plastids (chloroplasts) either directly via the engulfment and integration of a photosynthetic cyanobacterium (primary endosymbiosis) or indirectly by engulfing a photosynthetic eukaryote (secondary or tertiary endosymbiosis). The timing and frequency of secondary endosymbiosis during eukaryotic evolution is currently unclear but may be resolved in part by studying cryptomonads, a group of single-celled eukaryotes comprised of both photosynthetic and non-photosynthetic species. While cryptomonads such as Guillardia theta harbor a red algal-derived plastid of secondary endosymbiotic origin, members of the sister group Goniomonadea lack plastids. Here, we present the genome of Goniomonas avonlea-the first for any goniomonad-to address whether Goniomonadea are ancestrally non-photosynthetic or whether they lost a plastid secondarily.

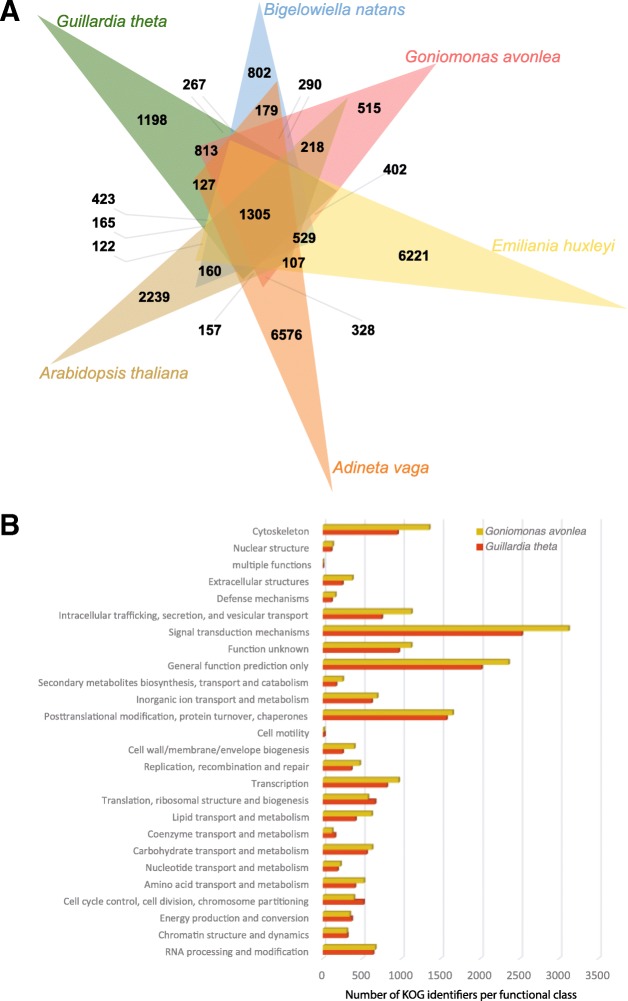
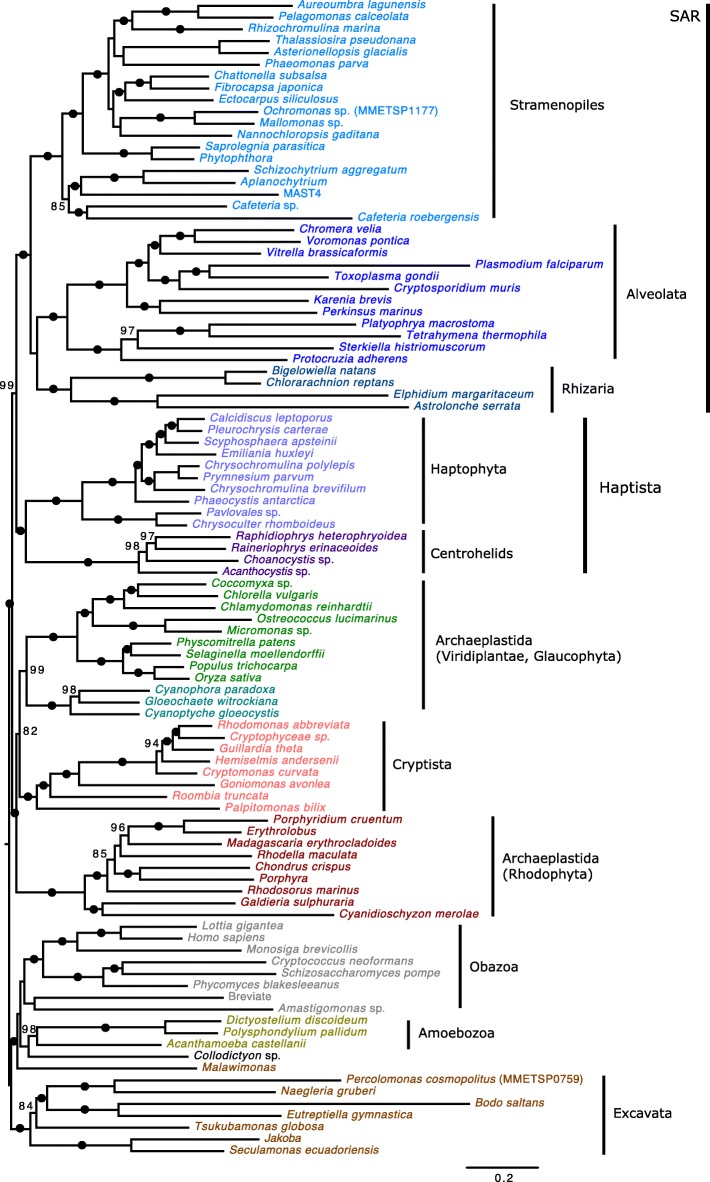
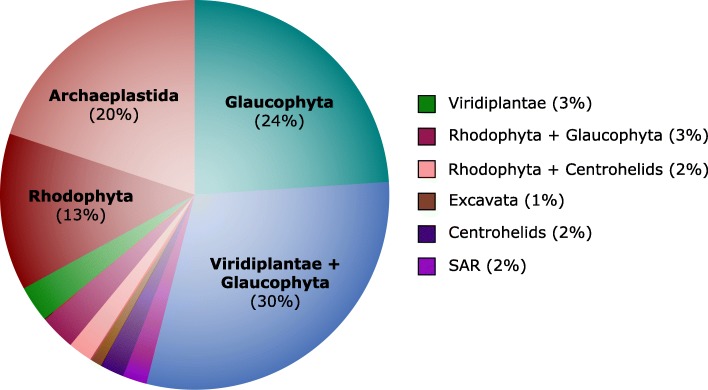
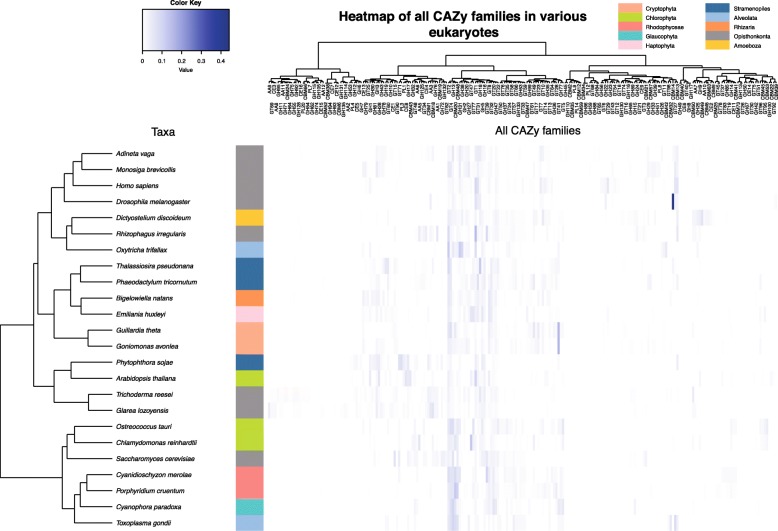
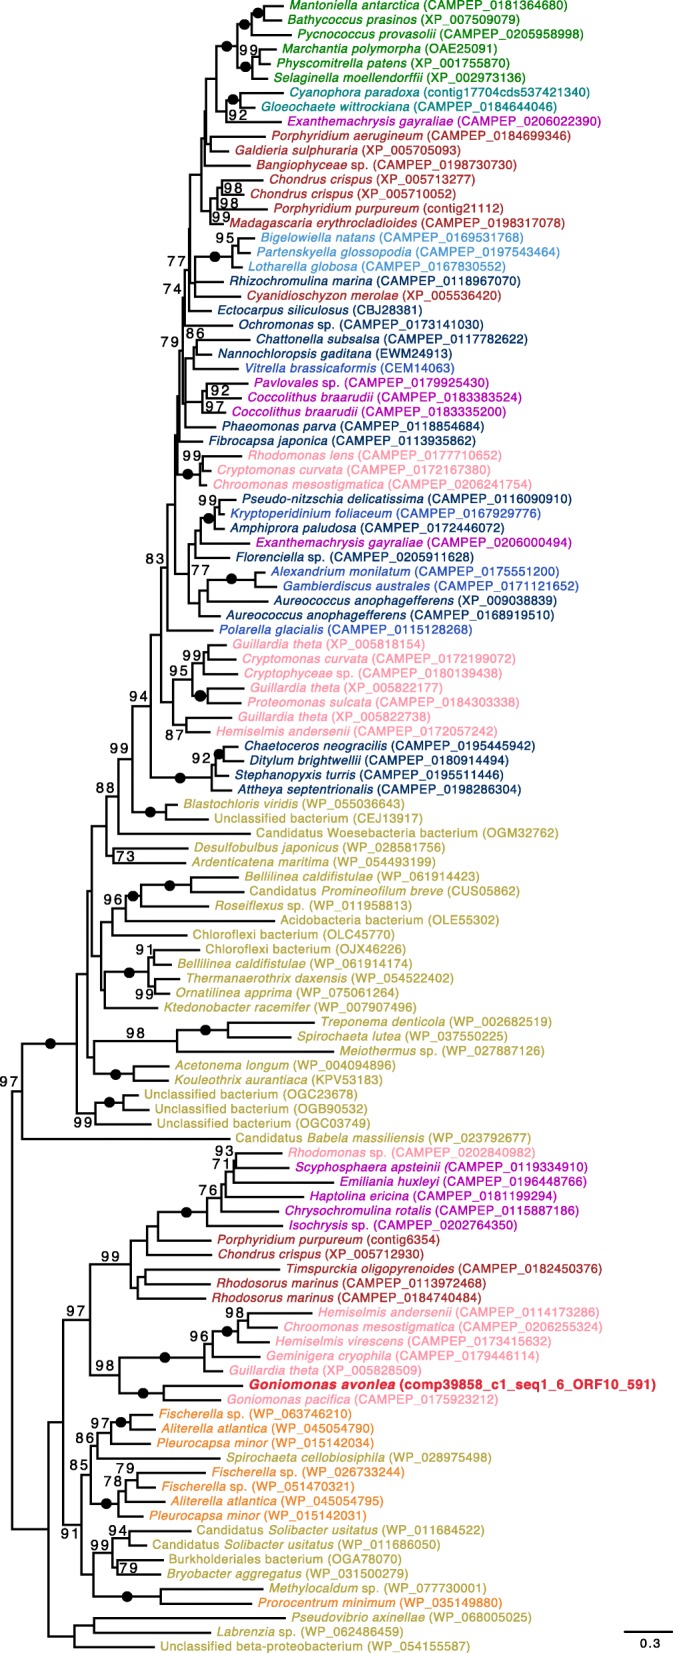
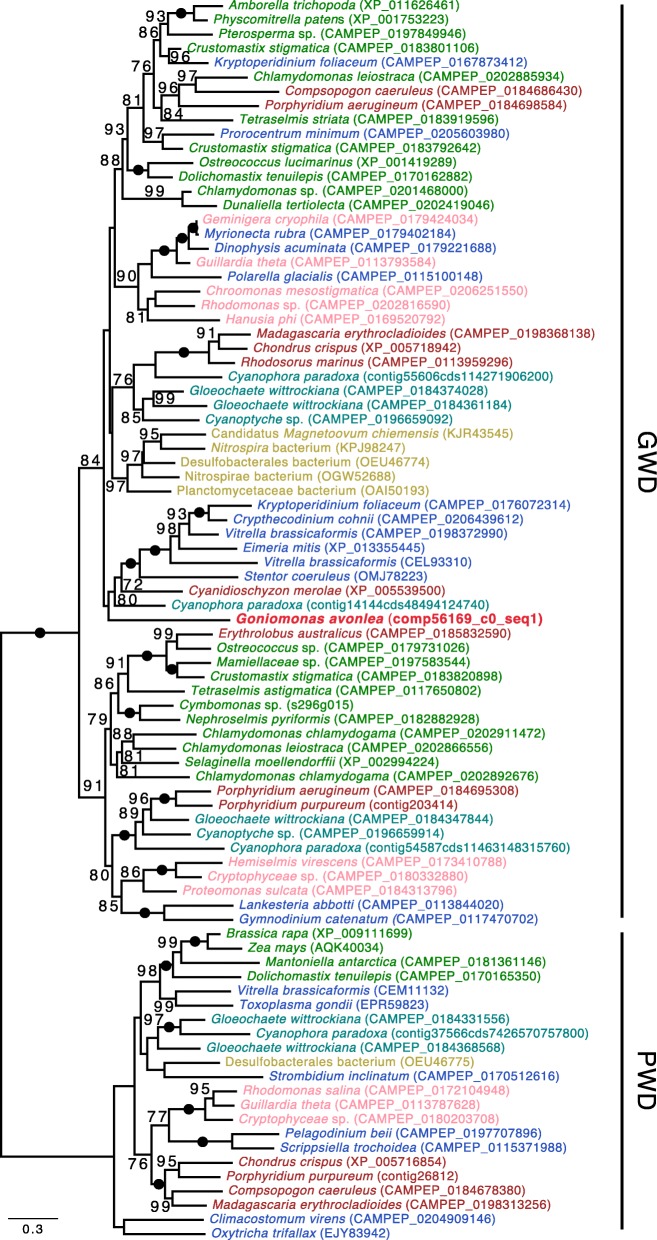
Results: We sequenced the nuclear and mitochondrial genomes of Goniomonas avonlea and carried out a comparative analysis of Go. avonlea, Gu. theta, and other cryptomonads. The Go. avonlea genome assembly is ~ 92 Mbp in size, with 33,470 predicted protein-coding genes. Interestingly, some metabolic pathways (e.g., fatty acid biosynthesis) predicted to occur in the plastid and periplastidal compartment of Gu. theta appear to operate in the cytoplasm of Go. avonlea, suggesting that metabolic redundancies were generated during the course of secondary plastid integration. Other cytosolic pathways found in Go. avonlea are not found in Gu. theta, suggesting secondary loss in Gu. theta and other plastid-bearing cryptomonads. Phylogenetic analyses revealed no evidence for algal endosymbiont-derived genes in the Go. avonlea genome. Phylogenomic analyses point to a specific relationship between Cryptista (to which cryptomonads belong) and Archaeplastida.

Conclusion: We found no convincing genomic or phylogenomic evidence that Go. avonlea evolved from a secondary red algal plastid-bearing ancestor, consistent with goniomonads being ancestrally non-photosynthetic eukaryotes. The Go. avonlea genome sheds light on the physiology of heterotrophic cryptomonads and serves as an important reference point for studying the metabolic "rewiring" that took place during secondary plastid integration in the ancestor of modern-day Cryptophyceae.

Keywords: Cryptomonads; Cryptophytes; Genome evolution; Phylogenomics; Secondary endosymbiosis.


Conflict of interest statement

Ethics approval and consent to participate

Not applicable.

Competing interests

The authors declare that they have no competing interests.

Publisher’s Note

Springer Nature remains neutral with regard to jurisdictional claims in published maps and institutional affiliations.

Figures

Fig. 1
Fig. 1
Comparative genomics of Goniomonadea, Cryptophyceae, and other eukaryotes. a Venn diagram showing orthologous clusters shared between the goniomonad Goniomonas avonlea (red), the cryptophyte Guillardia theta (green), the rhizarian Bigelowiella natans (blue), the haptophyte Emiliania huxleyi (yellow), the opisthokont Adineta vaga (orange), and the land plant Arabidopsis thaliana (brown). Go. avonlea shares 4321 families with Gu. theta, higher than is shared with other eukaryotes (B. natans (3647), E. huxleyi (3441), A. vaga (3173), A. thaliana (2955)). b KOG classification of proteins in Go. avonlea (brown) and Gu. theta (red). Within most functional categories, the number of proteins in the two organisms is similar. However, Go. avonlea possesses more proteins in some categories, in particular the cytoskeleton and the intracellular trafficking, secretion, and vesicular transport families
Fig. 2
Fig. 2
Algal genes in Guillardia theta and Goniomonas avonlea. The diagram shows the distribution of topologies observed in Go. avonlea homologs to 508 “algal” endosymbiotic gene transfers predicted by Curtis et al. [18] in Gu. theta. Phylogenies were evaluated and sorted based on the relative positioning of Go. avonlea and Gu. theta (and other Cryptophyceae) and their relationship to Archaeplastida lineages and secondarily photosynthetic taxa. An exclusive relationship indicates a direct relationship with an Archaeplastida lineage while an inclusive one indicates there are intervening secondarily photosynthetic taxa. A given topological pattern was only assigned if the corresponding UFboot support was greater than 80%. Of the 285 homologs identified in Go. avonlea, only six show an affinity to Cryptophyceae and red algae
Fig. 3
Fig. 3
Maximum likelihood (ML) phylogeny of tryptophanyl-tRNA synthetase in diverse eukaryotes and prokaryotes. The tree was inferred under the model LG4X (with 100 standard bootstrap replicates) and shows an apparent red algal ancestry for homologs in Cryptophyceae but not in Go. avonlea. Eukaryotic OTUs are colored according to their known or predicted “supergroup” affinities with sequences from Go. avonlea and predicted Gu. theta EGTs [17] highlighted in bright red (Viridiplantae are in green, Glaucophyta are in turquoise, Rhodophyta are in dark red, Cyanobacteria are orange and other Bacteria are in gold, Cryptophyta are in pink, Haptophyta are in purple, Stramenopiles are in dark blue, Alveolata are in blue, Rhizaria are in light blue). The tree shown is midpoint rooted. Black dots indicate maximal support for particular nodes. When not maximal, only bootstrap support values > 70% are shown. The scale bar shows the inferred number of amino acid substitutions per site
Fig. 4
Fig. 4
Taxonomic distribution of top blast hits for Goniomonas avonlea proteins. The top blast hit was defined as the most significant homolog to Go. avonlea (i.e., lowest E-value with a cutoff of 1e−10) excluding any other Goniomonas sequence
Fig. 5
Fig. 5
Phylogenomic analysis of the eukaryotic tree of life. Tree shown is a maximum likelihood (ML) phylogeny of a 250 marker gene/protein dataset as in Burki et al. [14] that includes new transcriptome data from Go. avonlea. The phylogeny is based on a concatenated marker gene alignment of 71,151 unambiguously aligned sites across 98 OTUs inferred under the model LG + C60 + F + PMSF with 100 standard bootstrap replicates. The tree shown is midpoint rooted. Black dots indicate maximal support for a particular node. When not maximal, only bootstrap support values > 70% are shown. The scale bar shows an inferred 0.2 substitutions per site
Fig. 6
Fig. 6
Impact of gene sampling on the phylogenetic position of Cryptista on the tree of eukaryotes. The diagram shows the phylogenetic position of Cryptista within each ML tree inferred using randomly generated subsets of 250 marker genes from the Burki et al. [14] dataset (four gene bins were used; for each iteration, three bins had 46 genes and one bin had 47 genes). Only marker genes for which a homolog was present in Goniomonas avonlea and at least one additional Cryptista were included. The distribution shown is based on a total of 100 randomly generated marker gene subset trees
Fig. 7
Fig. 7
Carbohydrate-active enzyme (CAZyme) families in the heterotroph Goniomonas avonlea, the phototroph Guillardia theta, and other eukaryotes. Diagram shows a heatmap of CAZyme prevalence in each taxon (abundance within a particular CAZy family divided by the whole number of CAZy families predicted from the genome); the white to blue color scheme indicates low to high prevalence, respectively. Dendogram shows the relative proximity of taxa, or of the co-occurrence of CAZyme families on the left. We observed a close relationship between Gu. theta and Go. avonlea (salmon), and that Cryptophyta have a set of CAZyme families similar to that seen in other secondarily photosynthetic algae
Fig. 8
Fig. 8
Phylogenetic analysis of glycosyltransferase (GT) 28. The tree shown is a maximum likelihood tree with ultrafast bootstrap values mapped onto the nodes. The tree shown is midpoint rooted. Sequences are colored according to their taxonomic affiliation: Viridiplantae are in green, Glaucophyta are in turquoise, Rhodophyta are in dark red, Cyanobacteria are orange and other Bacteria are in gold, Cryptophyta are in pink, Goniomonas avonlea is dark red and bolded, Haptophyta are in purple, Stramenopiles are in dark blue, Alveolata are in blue, Rhizaria are in light blue. The GT28 from Go. avonlea groups with other cryptomonads and with Rhodophyta. It is noteworthy that GT28 grouping with Go. avonlea seem to be mitochondrial based on signal targeting prediction while GT28 on the upper part could be targeted to the plastid, based on targeting prediction signal. The scale bar shows the inferred number of amino acid substitutions per site
Fig. 9
Fig. 9
Glucan Water Dikinase (GWD) phylogenetic tree. The tree shown is a maximum likelihood tree with ultrafast bootstrap values mapped onto the nodes. The tree is rooted with the Phosphoglucan dikinase (PWD) sequences. Sequences are colored according to their taxonomic affiliation: Viridiplantae are in green, Glaucophyta are in turquoise, Rhodophyta are in dark red, Cyanobacteria are orange and other Bacteria are in gold, Cryptophyta are in pink, Goniomonas avonlea is dark red and bolded, Haptophyta are in purple, Stramenopiles are in dark blue, Alveolata are in blue, Rhizaria are in light blue. Some bacteria (in gold) could have obtained their GWD gene by LGT. The GWD homolog from Go. avonlea branches close to its counterpart in Rhodophyta and Glaucophyta; GWDs in Cryptophyta appear more distantly related. The scale bar shows the inferred number of amino acid substitutions per site

Comment in

References

    1. Howe C, Barbrook A, Nisbet RE, Lockhart P, Larkum AW. The origin of plastids. Philos Trans R Soc B Biol Sci. 2008;363:2675–2685. - PMC - PubMed
    1. Gould SB, Waller RF, McFadden GI. Plastid evolution. Annu Rev Plant Biol. 2008;59:491–517. - PubMed
    1. Moreira D, Le Guyader H, Philippe H. The origin of red algae and the evolution of chloroplasts. Nature. 2000;405(6782):69–72. - PubMed
    1. Keeling PJ. The endosymbiotic origin, diversification and fate of plastids. Philos Trans R Soc B Biol Sci. 2010;365:729–748. - PMC - PubMed
    1. Adl SM, Simpson AGB, Lane CE, Lukeš J, Bass D, Bowser SS, et al. The revised classification of eukaryotes. J Eukaryot Microbiol. 2012;59:429–514. - PMC - PubMed

Publication types

LinkOut - more resources