Inhibition of TPL2 by interferon-α suppresses bladder cancer through activation of PDE4D
- PMID: 30482227
- PMCID: PMC6260752
- DOI: 10.1186/s13046-018-0971-4
Inhibition of TPL2 by interferon-α suppresses bladder cancer through activation of PDE4D
Abstract
Background: Drugs that inhibit the MEK/ERK pathway have therapeutic benefit in bladder cancer treatment but responses vary with patients, for reasons that are still not very clear. Interferon-α (IFN-α) is also used as a therapeutic agent for bladder cancer treatment but the response rate is low. It was found that IFN-α could enhance the cytotoxic effect of MEK inhibition. However, the potential mechanisms of that are still unclear. Understanding of the cross-talk between the IFN-α and MEK/ERK pathway will help enhance the efficacy of IFN-α or MEK inhibitors on bladder cancer.
Methods: Immunoprecipitation and pull-down assay were used to reveal the formation of signaling complex. The protein expressions were detected by western blot and immunohistochemistry. The cAMP level, Phosphodiesterase 4D (PDE4D) activity and Prostaglandin E2 (PGE2) concentration in cells, serum and tissues were detected by enzyme-linked immunosorbent assay. The role of PDE4D in bladder tumorigenesis in vivo was examined by the xenograft model. Tissue microarray chips were used to investigate the prognostic roles of PDE4D and tumor progression locus 2 (TPL2) in bladder cancer patients.
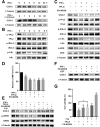
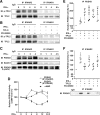
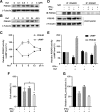
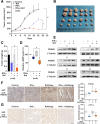
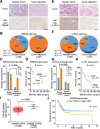
Results: IFN-α down-regulated the cyclooxygenase-2 (COX-2) expression in bladder cancer cells through the inhibition of TPL2/NF-κB pathway; IFN-α also inhibited COX-2 expression by suppressing cAMP signaling through TPL2-ERK mediated PDE4D activity. Reduction of the intracellular cAMP level by PDE4D potentiated the antitumor effect of IFN-α against bladder cancer in vitro and in vivo. Further analysis of clinical samples indicated that low PDE4D expression and high level of TPL2 phosphorylation were correlated to the development and poor prognosis in bladder cancer patients.
Conclusions: Our data reveal that IFN-α can exert its antitumor effect through a non-canonical JAK-STAT pathway in the bladder cancer cells with low activity of IFN pathway, and the TPL2 inhibition is another function of IFN-α in the context of bladder cancer therapy. The antitumor effects of IFN-α and MEK inhibition also depend on the PDE4D-mediated cAMP level in bladder cancer cells. Suppression of the TPL2 phosphorylation and intracellular cAMP level may be possible therapeutic strategies for enhancing the effectiveness of IFN-α and MEK inhibitors in bladder cancer treatment.
Keywords: COX-2; Interferon; PDE4D; TPL2; cAMP.
Conflict of interest statement
Ethics approval and consent to participate
Tissue microarray chips were purchased from Outdo Biotech, Ltd. (Shanghai, China). All the experiments and procedures of animals were performed in accordance with the National Institutes of Health guide for the care and use of Laboratory animals (NIH Publications No. 8023, revised 1978).
Consent for publication
Not applicable.
Competing interests
The authors declare they have no competing interests.
Publisher’s Note
Springer Nature remains neutral with regard to jurisdictional claims in published maps and institutional affiliations.
Figures

Similar articles
-
Luteolin sensitizes the antiproliferative effect of interferon α/β by activation of Janus kinase/signal transducer and activator of transcription pathway signaling through protein kinase A-mediated inhibition of protein tyrosine phosphatase SHP-2 in cancer cells.Cell Signal. 2014 Mar;26(3):619-28. doi: 10.1016/j.cellsig.2013.11.039. Epub 2013 Dec 12. Cell Signal. 2014. PMID: 24333668
-
The Tpl2 Kinase Regulates the COX-2/Prostaglandin E2 Axis in Adipocytes in Inflammatory Conditions.Mol Endocrinol. 2015 Jul;29(7):1025-36. doi: 10.1210/me.2015-1027. Epub 2015 May 28. Mol Endocrinol. 2015. PMID: 26020725 Free PMC article.
-
Inhibition of tumor progression locus 2 protein kinase decreases lipopolysaccharide-induced tumor necrosis factor alpha production due to the inhibition of the tip-associated protein induction in RAW264.7 cells.Biol Pharm Bull. 2010;33(7):1233-7. doi: 10.1248/bpb.33.1233. Biol Pharm Bull. 2010. PMID: 20606319
-
Tumor progression locus 2 (TPL2) in tumor-promoting Inflammation, Tumorigenesis and Tumor Immunity.Theranostics. 2020 Jul 9;10(18):8343-8364. doi: 10.7150/thno.45848. eCollection 2020. Theranostics. 2020. PMID: 32724474 Free PMC article. Review.
-
Tpl-2/Cot and COX-2 in breast cancer.Biomed Pap Med Fac Univ Palacky Olomouc Czech Repub. 2008 Jun;152(1):21-5. doi: 10.5507/bp.2008.003. Biomed Pap Med Fac Univ Palacky Olomouc Czech Repub. 2008. PMID: 18795070 Review.
Cited by
-
Choosing Kinase Inhibitors for Androgen Deprivation Therapy-Resistant Prostate Cancer.Pharmaceutics. 2022 Feb 24;14(3):498. doi: 10.3390/pharmaceutics14030498. Pharmaceutics. 2022. PMID: 35335873 Free PMC article. Review.
-
Bioinformatic Analysis of IKK Complex Genes Expression in Selected Gastrointestinal Cancers.Int J Mol Sci. 2024 Sep 12;25(18):9868. doi: 10.3390/ijms25189868. Int J Mol Sci. 2024. PMID: 39337357 Free PMC article.
-
Elevated PDE4C level serves as a candidate diagnostic biomarker and correlates with poor survival in thyroid carcinoma.Sci Rep. 2024 Mar 21;14(1):6813. doi: 10.1038/s41598-024-57533-w. Sci Rep. 2024. PMID: 38514754 Free PMC article.
-
Predicting bladder cancer survival with high accuracy: insights from MAPK pathway-related genes.Sci Rep. 2024 May 7;14(1):10482. doi: 10.1038/s41598-024-61302-0. Sci Rep. 2024. PMID: 38714855 Free PMC article.
-
Construction of an Immune-Autophagy Prognostic Model Based on ssGSEA Immune Scoring Algorithm Analysis and Prognostic Value Exploration of the Immune-Autophagy Gene in Endometrial Carcinoma (EC) Based on Bioinformatics.J Healthc Eng. 2022 Feb 22;2022:7832618. doi: 10.1155/2022/7832618. eCollection 2022. J Healthc Eng. 2022. Retraction in: J Healthc Eng. 2023 Oct 11;2023:9834327. doi: 10.1155/2023/9834327. PMID: 35242299 Free PMC article. Retracted.
References
MeSH terms
Substances
Grants and funding
- Nos. 21561142003, 21672207, 21861142007/National Natural Science Foundation of China
- Nos. 2015PB049, 2015PB061/Chinese Academy of Sciences President's International Fellowship Initiative
- No. 2016JZ0022/Science & Technology Department of Sichuan Province
- 2017ZX09101003-001-006/National New Drug Innovation Major Project of China
LinkOut - more resources
Full Text Sources
Other Literature Sources
Medical
Research Materials
Miscellaneous

