

Longitudinal Standards for Mid-life Cognitive Performance: Identifying Abnormal Within-Person Changes in the Wisconsin Registry for Alzheimer's Prevention
- PMID: 30482257
- PMCID: PMC6349483
- DOI: 10.1017/S1355617718000929
Longitudinal Standards for Mid-life Cognitive Performance: Identifying Abnormal Within-Person Changes in the Wisconsin Registry for Alzheimer's Prevention
Abstract
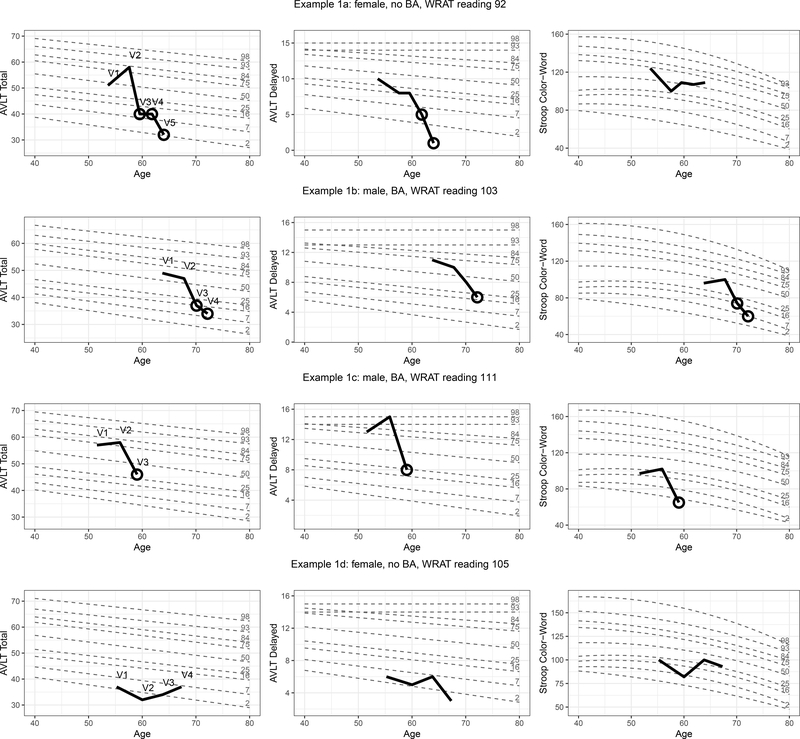
Objectives: A major challenge in cognitive aging is differentiating preclinical disease-related cognitive decline from changes associated with normal aging. Neuropsychological test authors typically publish single time-point norms, referred to here as unconditional reference values. However, detecting significant change requires longitudinal, or conditional reference values, created by modeling cognition as a function of prior performance. Our objectives were to create, depict, and examine preliminary validity of unconditional and conditional reference values for ages 40-75 years on neuropsychological tests.
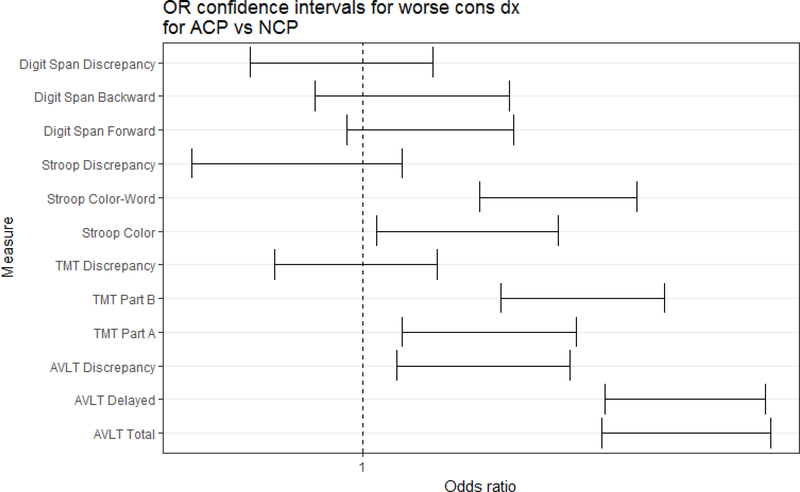
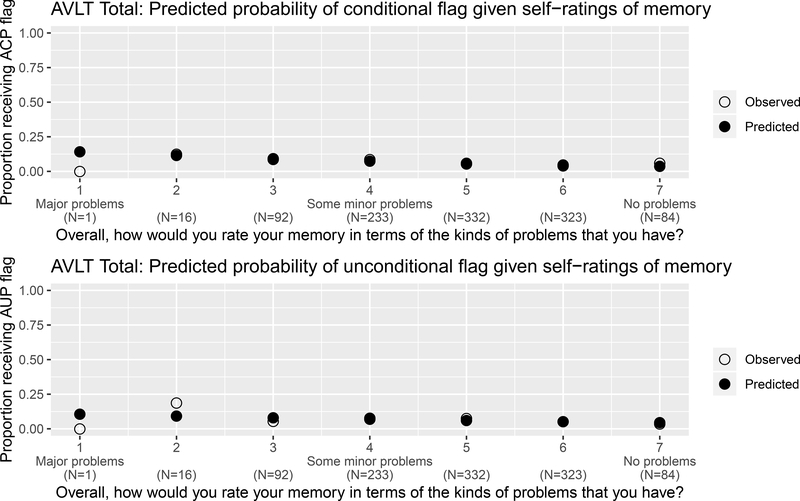
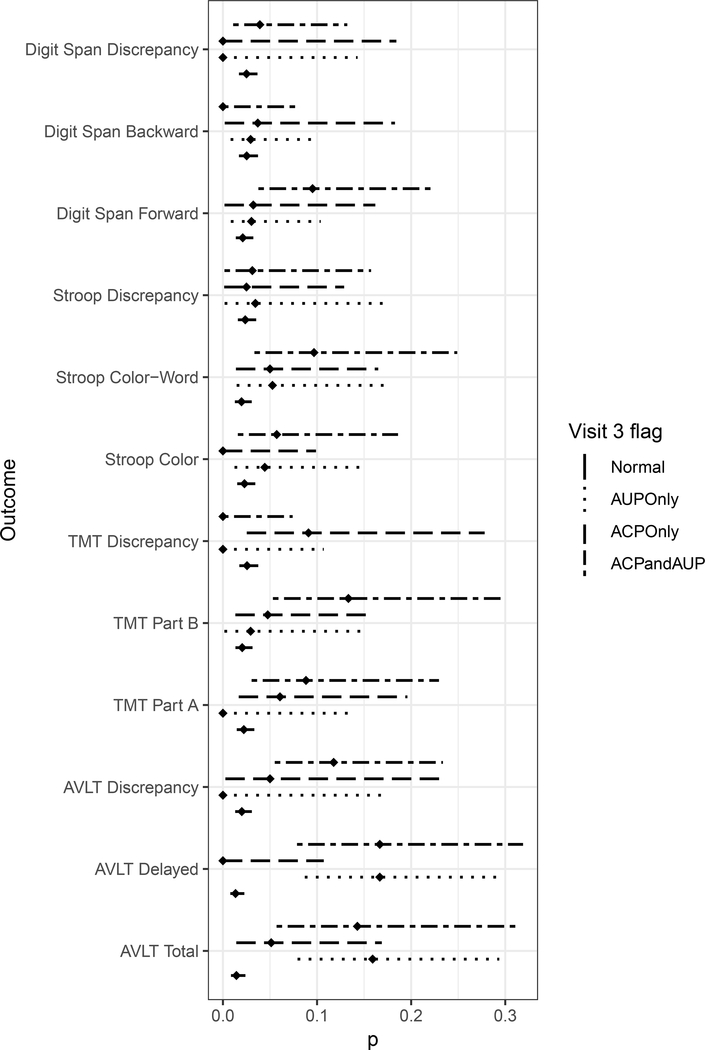
Method: We used quantile regression to create growth-curve-like models of performance on tests of memory and executive function using participants from the Wisconsin Registry for Alzheimer's Prevention. Unconditional and conditional models accounted for age, sex, education, and verbal ability/literacy; conditional models also included past performance on and number of prior exposures to the test. Models were then used to estimate individuals' unconditional and conditional percentile ranks for each test. We examined how low performance on each test (operationalized as <7th percentile) related to consensus-conference-determined cognitive statuses and subjective impairment.
Results: Participants with low performance were more likely to receive an abnormal cognitive diagnosis at the current visit (but not later visits). Low performance was also linked to subjective and informant reports of worsening memory function.
Conclusions: The percentile-based methods and single-test results described here show potential for detecting troublesome within-person cognitive change. Development of reference values for additional cognitive measures, investigation of alternative thresholds for abnormality (including multi-test criteria), and validation in samples with more clinical endpoints are needed. (JINS, 2019, 25, 1-14).
Keywords: Cognitive aging; Conditional standards; Executive function; Memory; Preclinical cognitive decline; Quantile regression.
Figures
Similar articles
-
Longitudinal normative standards for cognitive tests and composites using harmonized data from two Wisconsin AD-risk-enriched cohorts.Alzheimers Dement. 2024 May;20(5):3305-3321. doi: 10.1002/alz.13774. Epub 2024 Mar 27. Alzheimers Dement. 2024. PMID: 38539269 Free PMC article.
-
Characterizing the Effects of Sex, APOE ɛ4, and Literacy on Mid-life Cognitive Trajectories: Application of Information-Theoretic Model Averaging and Multi-model Inference Techniques to the Wisconsin Registry for Alzheimer's Prevention Study.J Int Neuropsychol Soc. 2019 Feb;25(2):119-133. doi: 10.1017/S1355617718000954. Epub 2018 Dec 7. J Int Neuropsychol Soc. 2019. PMID: 30522545 Free PMC article.
-
Intraindividual Cognitive Variability in Middle Age Predicts Cognitive Impairment 8-10 Years Later: Results from the Wisconsin Registry for Alzheimer's Prevention.J Int Neuropsychol Soc. 2016 Nov;22(10):1016-1025. doi: 10.1017/S135561771600093X. J Int Neuropsychol Soc. 2016. PMID: 27903330 Free PMC article.
-
Emergence of mild cognitive impairment in late middle-aged adults in the wisconsin registry for Alzheimer's prevention.Dement Geriatr Cogn Disord. 2014;38(1-2):16-30. doi: 10.1159/000355682. Epub 2014 Feb 20. Dement Geriatr Cogn Disord. 2014. PMID: 24556849 Free PMC article.
-
Temporal Order of Alzheimer's Disease-Related Cognitive Marker Changes in BLSA and WRAP Longitudinal Studies.J Alzheimers Dis. 2017;59(4):1335-1347. doi: 10.3233/JAD-170448. J Alzheimers Dis. 2017. PMID: 28731452 Free PMC article.
Cited by
-
Longitudinal normative standards for cognitive tests and composites using harmonized data from two Wisconsin AD-risk-enriched cohorts.Alzheimers Dement. 2024 May;20(5):3305-3321. doi: 10.1002/alz.13774. Epub 2024 Mar 27. Alzheimers Dement. 2024. PMID: 38539269 Free PMC article.
-
Item-Level Story Recall Predictors of Amyloid-Beta in Late Middle-Aged Adults at Increased Risk for Alzheimer's Disease.Front Psychol. 2022 Jun 27;13:908651. doi: 10.3389/fpsyg.2022.908651. eCollection 2022. Front Psychol. 2022. PMID: 35832924 Free PMC article.
-
Validity Evidence for the Research Category, "Cognitively Unimpaired - Declining," as a Risk Marker for Mild Cognitive Impairment and Alzheimer's Disease.Front Aging Neurosci. 2021 Jul 26;13:688478. doi: 10.3389/fnagi.2021.688478. eCollection 2021. Front Aging Neurosci. 2021. PMID: 34381351 Free PMC article.
-
Proper names from story recall are associated with beta-amyloid in cognitively unimpaired adults at risk for Alzheimer's disease.Cortex. 2020 Oct;131:137-150. doi: 10.1016/j.cortex.2020.07.008. Epub 2020 Jul 31. Cortex. 2020. PMID: 32861209 Free PMC article.
-
Mayo normative studies: A conditional normative model for longitudinal change on the Auditory Verbal Learning Test and preliminary validation in preclinical Alzheimer's disease.Alzheimers Dement (Amst). 2022 Jul 15;14(1):e12325. doi: 10.1002/dad2.12325. eCollection 2022. Alzheimers Dement (Amst). 2022. PMID: 35860792 Free PMC article.
References
-
- Benjamini Y, & Hochberg Y (1995). Controlling the False Discovery Rate - a Practical and Powerful Approach. Journal of the Royal Statistical Society Series B-Methodological, 57(1), 289–300.
-
- Berkey CS, Reed RB, & Valadian I (1983). Longitudinal growth standards for preschool children. Annals of Human Biology, 10(1), 57–67. - PubMed
-
- Bowditch H (1891). The growth of children studied by Galton’s percentile grades In 22nd annual report of the State Board of Health of Massachusetts (pp. 479–525). Boston, MA: Wright and Potter.
Publication types
MeSH terms
Grants and funding
- R01 AG037639/AG/NIA NIH HHS/United States
- F30 AG054115/AG/NIA NIH HHS/United States
- UL1 TR000427/TR/NCATS NIH HHS/United States
- T32 GM008692/GM/NIGMS NIH HHS/United States
- T32 GM007507/GM/NIGMS NIH HHS/United States
- RF1 AG027161/AG/NIA NIH HHS/United States
- UL1 TR002373/TR/NCATS NIH HHS/United States
- P50 AG033514/AG/NIA NIH HHS/United States
- R01 AG054059/AG/NIA NIH HHS/United States
- R01 AG027161/AG/NIA NIH HHS/United States
- R01 AG054047/AG/NIA NIH HHS/United States
- K23 AG045957/AG/NIA NIH HHS/United States
- R01 AG021155/AG/NIA NIH HHS/United States
LinkOut - more resources
Full Text Sources
Medical
Miscellaneous
