Review
. 2018:159:43-59.
doi: 10.1016/B978-0-444-63916-5.00003-3.

Gravity estimation and verticality perception

Affiliations
Review

Gravity estimation and verticality perception

Christopher J Dakin et al. Handb Clin Neurol. 2018.

Abstract

Gravity is a defining force that governs the evolution of mechanical forms, shapes and anchors our perception of the environment, and imposes fundamental constraints on our interactions with the world. Within the animal kingdom, humans are relatively unique in having evolved a vertical, bipedal posture. Although a vertical posture confers numerous benefits, it also renders us less stable than quadrupeds, increasing susceptibility to falls. The ability to accurately and precisely estimate our orientation relative to gravity is therefore of utmost importance. Here we review sensory information and computational processes underlying gravity estimation and verticality perception. Central to gravity estimation and verticality perception is multisensory cue combination, which serves to improve the precision of perception and resolve ambiguities in sensory representations by combining information from across the visual, vestibular, and somatosensory systems. We additionally review experimental paradigms for evaluating verticality perception, and discuss how particular disorders affect the perception of upright. Together, the work reviewed here highlights the critical role of multisensory cue combination in gravity estimation, verticality perception, and creating stable gravity-centered representations of our environment.

Keywords: cue disambiguation; cue integration; gravity; multisensory; reference frames; upright; verticality.


Figures

Fig. 3.1.
Fig. 3.1.
Accuracy and precision of sensory representations. (A) Dartboard schematic illustrating four accuracy–precision scenarios. Accuracy describes how close the representation is to the ground truth (the bullseye). Performance is accurate if, on average, the dart hits the bullseye (left column). Precision describes the reliability of the representation. Performance is precise if multiple dart throws result in a tight cluster (top row). As is illustrated here, accuracy and precision can vary independently. (B) Sensory representations can be described as likelihood functions. Given a ground truth tilt of 0° (vertical dotted gray line), each curve shows a Gaussian-shaped likelihood function with different levels of accuracy and precision. The horizontal axis shows the possible tilts, and the vertical axis indicates the likelihood of sensing each of those tilts given the ground truth tilt of 0°.
Fig. 3.2.
Fig. 3.2.
Bayesian cue integration. (A) The visual, vestibular, and somatosensory systems each provide a representation of tilt modeled here as Gaussian likelihood functions. For example, the visual likelihood function p(T^ vis |T) describes the likelihood of visually sensing a particular tilt (T^vis) given the true tilt (T). The mean (μT^) and standard deviation (σT^) characterize the accuracy and precision of the representation, respectively. (B) The product of the individual sensory likelihoods produces a multisensory likelihood function (solid gray curve in the center plot; colored dashed curves show the unisensory likelihood functions). (C) According to Bayes’ rule, the posterior distribution p(T|T^vis,T^vest,T^soma) describes the probability of a tilt given the sensory information (black curve, right-most plot). The posterior is equal to the product of the multisensory likelihood function and a prior describing the probability of each tilt (magenta curve, center-right plot), divided by a normalizing term (that can be safely ignored since it does not affect the shape of the posterior distribution). (D) The posterior has a mean that is equal to a weighted combination of the multisensory likelihood mean and the mean of the prior, and has minimal variance given the likelihood and prior. Colors in the equations correspond to the colors of the plotted functions.
Fig. 3.3.
Fig. 3.3.
Three subjective vertical tasks. (A) During a subjective visual vertical (SVV) task, participants orient a visually displayed bar with perceived vertical using an interfacing controller. (B) During a subjective postural vertical (SPV) task, participants either orient themselves with perceived vertical or are passively rotated until they indicate that they perceive themselves to be vertical. Here, a participant is shown standing on a motion platform that allows side-to-side tilt. Starting from a tilted platform orientation, the participant or experimenter will adjust the participant’s orientation. The participant will then indicate when his/her body is aligned with vertical. (C) During a subjective haptic vertical (SHV) task, participants align a hand-held object with perceived vertical.
Fig. 3.4.
Fig. 3.4.
Bayesian account of the Aubert effect. (A, B) Tilt estimation for ground truth tilts of 45° and 90° relative to the world, respectively. A prior for being upright relative to the world (tilt = 0°), p(T), is illustrated in magenta. The precision of sensory representations of tilt decrease the further an individual is from upright. Reflecting this change in precision, the sensory likelihood function p(T^|T) representing a tilt of 45° is taller and narrower (i.e., more precise) than for a tilt of 90° (gray curves). With Bayesian cue integration, the prior has a larger effect on the posterior, p(T|T^) (black curves), at larger tilts because of the decreased precision of the likelihood function. Correspondingly, the posterior is “pulled” more towards the prior in (B) compared to (A). (C) Taking the tilt with the highest probability as the estimate of the ground truth tilt, this “pull” on the posterior introduces a bias in the perceived tilt that increases the further the individual is from upright. Specifically, the perceived tilt (solid curve) is underestimated at large tilts (dashed curve), resulting in the Aubert effect.(Adapted from De Vrijer M, Medendorp WP, Van Gisbergen JAM (2008) Shared computational mechanism for tilt compensation accounts for biased verticality percepts in motion and pattern vision. J Neurophysiol 99: 915–930.)
Fig. 3.5.
Fig. 3.5.
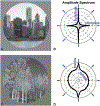
The distribution of orientations in the environment provides a visual cue to the direction of gravity. (A) Urban scene: the Vancouver skyline. (B) Amplitude spectrum of the urban scene shows a prevalence of vertical orientations due to the columnar structure of the buildings, and horizontal orientations due to the roofs and floors of the buildings as well as the shoreline. The angular variable corresponds to the orientation of the contours in the scene, indicated by blue oriented bars. The radial variable shows the prevalence of each orientation in the scene. (C) Natural scene: Logan Canyon, UT. (D) Amplitude spectrum of the natural scene shows a prevalence of vertical orientations due to the tree trunks.
Fig. 3.6.
Fig. 3.6.
Framework incorporating visual and vestibular contributions to gravito-inertial force resolution based on changes in the head’s orientation in space, as summarized by Laurens and Angelaki (2011). Rotation signals originate from the semicircular canals and the visual system. Semicircular canals signals (blue lines) are combined with visual signals (gray lines) to improve the estimate of the angular velocity of the head (shown in red). Changes in the orientation of gravity relative to the head (i.e., changes in head tilt) are estimated by integrating the cross-product of the previous estimate of gravity (Ĝ) and the current estimated angular velocity of the head (Ω^) (shown in purple). Once the new estimate of gravity (Ĝ) is determined, the net gravito-inertial acceleration (GIA) signaled by the otoliths can be subtracted to estimate the linear acceleration of the head (Â) Somatogravic feedback (green-dashed arrow) slowly pulls the estimate of gravity towards the otolith signal to correct for drift in the gravity estimate. This feedback loop can also be formalized as a prior for zero acceleration. Rotation feedback (green vertical arrow) corrects for errant angular velocity signals by adjusting the internal estimate of the angular velocity of the head, thereby also reducing the difference between the internal estimate of gravity (Ĝ) and GIA. Variables with a circumflex are estimates of real-world variables.
Fig. 3.7.
Fig. 3.7.
Einstein’s equivalence principle illustrated for the otoliths. During backward linear acceleration (top left), the inertial force acts in the direction opposite to the acceleration, causing the otolithic membrane to lag behind the skull and the sensory hair cells to bend. Similarly, tilting the head forward (bottom left) causes the otolithic membrane to sag and the sensory hair cells to bend as they do during backward linear acceleration. The otoliths therefore respond to both linear acceleration of the head and head tilt relative to gravity, and cannot distinguish between the two. The same is true for forward linear accelerations and backward head tilts (right column). Although illustrated here for head pitch, the ambiguity also exists between left–right translations and roll. Graviceptive signals arising from the abdominal viscera suffer from a similar ambiguity.
Fig. 3.8.
Fig. 3.8.
Rotation of the visual scene biases estimates of the direction of gravity. Clockwise (A) and counterclockwise (B) rotation of the visual scene from the perspective of a static, upright observer. The black and white dotted arrows indicate the otolith signal (gravito-inertial acceleration: GIA). The solid blue and orange arrows indicate the estimated direction of gravity relative to the head (Ĝ), which is biased away from the otolith signal by the visual motion. (C) Clockwise (counterclockwise) visual rotation can be used to infer left (right) ear-down head tilt, and thus a rotation of the gravitational vector relative to the head in the clockwise (counterclockwise) direction away from the otolith signal (GIA). According to the gravito-inertial force resolution hypothesis, separation of the estimate of gravity relative to the head (Ĝ) from GIA results in the inference of an interaural and vertical acceleration (Â; dashed colored lines) whose magnitude and direction are given by the vector difference between GIA and Ĝ (Zupan and Merfeld, 2003). Variables with a circumflex are estimates of real-world variables.

Similar articles

Cited by

References

    1. Akbarian S, Grusser OJ, Guldin WO (1992). Thalamic connections of the vestibular cortical fields in the squirrel monkey. J Comp Neurol 326: 423–441. - PubMed
    1. Alberts BBGT, de Brouwer AJ, Selen LPJ et al. (2016a). A Bayesian account of visuo-vestibular interactions in the rod-and-frame task. eNeuro 3 (5). - PMC - PubMed
    1. Alberts BBGT, Selen LPJ, Bertolini G et al. (2016b). Dissociating vestibular and somatosensory contributions to spatial orientation. J Neurophysiol 116: 30–40. - PMC - PubMed
    1. Alexander RM (2004). Bipedal animals, and their differences from humans. J Anat 204: 321–330. - PMC - PubMed
    1. Anastasopoulos D, Haslwanter T, Bronstein A et al. (1997). Dissociation between the perception of body verticality and the visual vertical in acute peripheral vestibular disorder in humans. Neurosci Lett 233: 151–153. - PubMed