

Health disparities across the counties of Kenya and implications for policy makers, 1990-2016: a systematic analysis for the Global Burden of Disease Study 2016
- PMID: 30482677
- PMCID: PMC6293072
- DOI: 10.1016/S2214-109X(18)30472-8
Health disparities across the counties of Kenya and implications for policy makers, 1990-2016: a systematic analysis for the Global Burden of Disease Study 2016
Abstract
Background: The Global Burden of Diseases, Injuries, and Risk Factors Study (GBD) 2016 provided comprehensive estimates of health loss globally. Decision makers in Kenya can use GBD subnational data to target health interventions and address county-level variation in the burden of disease.
Methods: We used GBD 2016 estimates of life expectancy at birth, healthy life expectancy, all-cause and cause-specific mortality, years of life lost, years lived with disability, disability-adjusted life-years, and risk factors to analyse health by age and sex at the national and county levels in Kenya from 1990 to 2016.
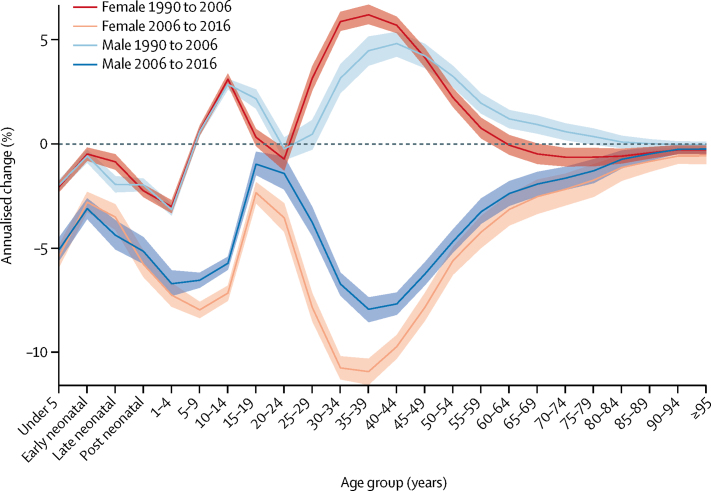
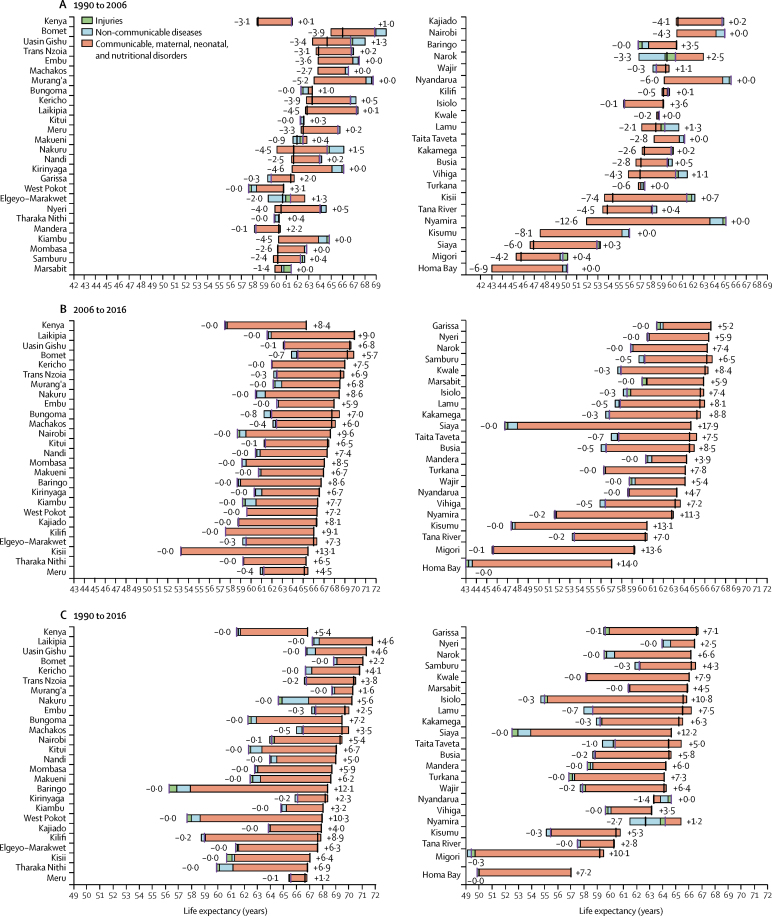
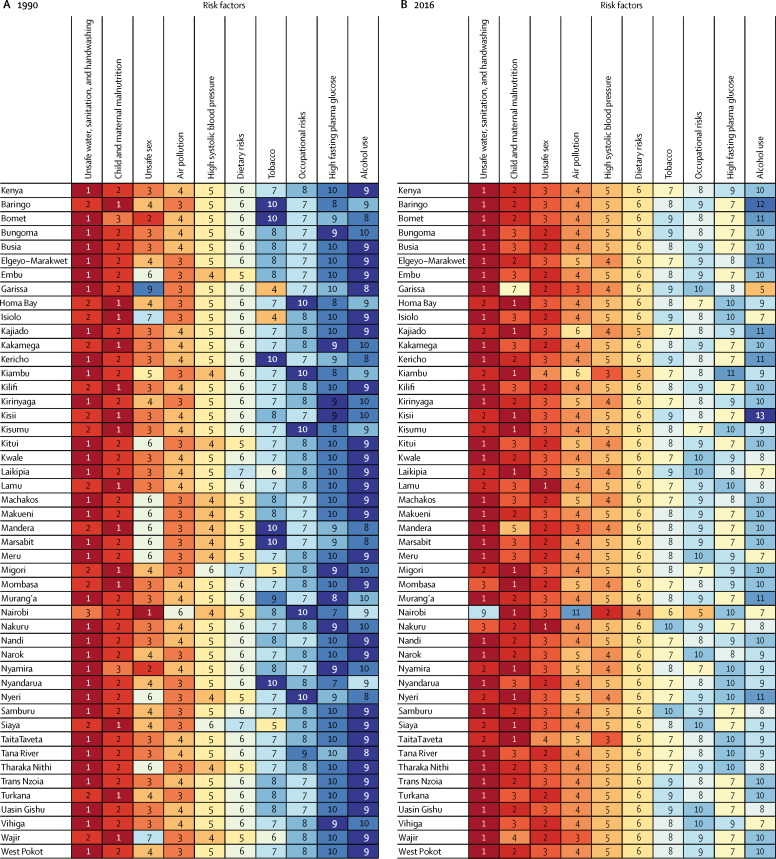
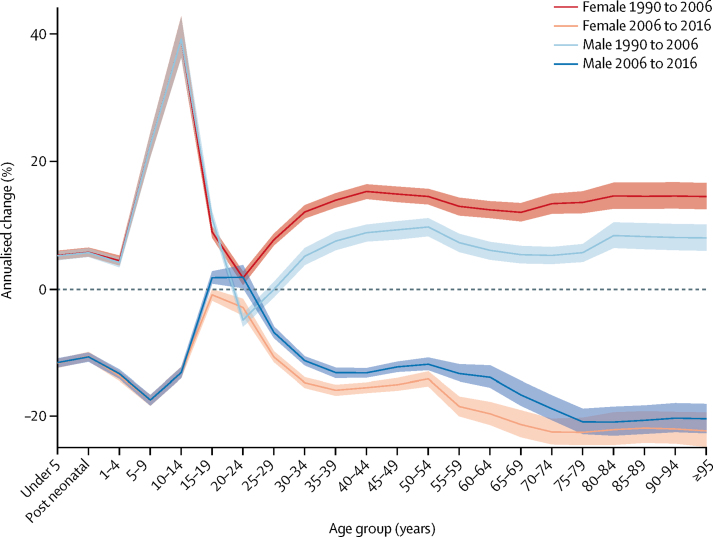
Findings: The national all-cause mortality rate decreased from 850·3 (95% uncertainty interval [UI] 829·8-871·1) deaths per 100 000 in 1990 to 579·0 (562·1-596·0) deaths per 100 000 in 2016. Under-5 mortality declined from 95·4 (95% UI 90·1-101·3) deaths per 1000 livebirths in 1990 to 43·4 (36·9-51·2) deaths per 1000 livebirths in 2016, and maternal mortality fell from 315·7 (242·9-399·4) deaths per 100 000 in 1990 to 257·6 (195·1-335·3) deaths per 100 000 in 2016, with steeper declines after 2006 and heterogeneously across counties. Life expectancy at birth increased by 5·4 (95% UI 3·7-7·2) years, with higher gains in females than males in all but ten counties. Unsafe water, sanitation, and handwashing, unsafe sex, and malnutrition were the leading national risk factors in 2016.
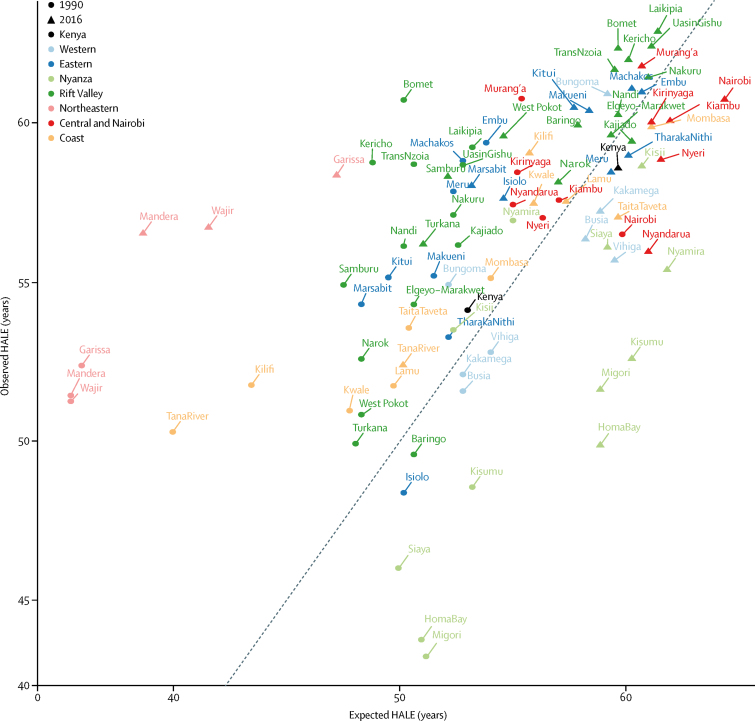
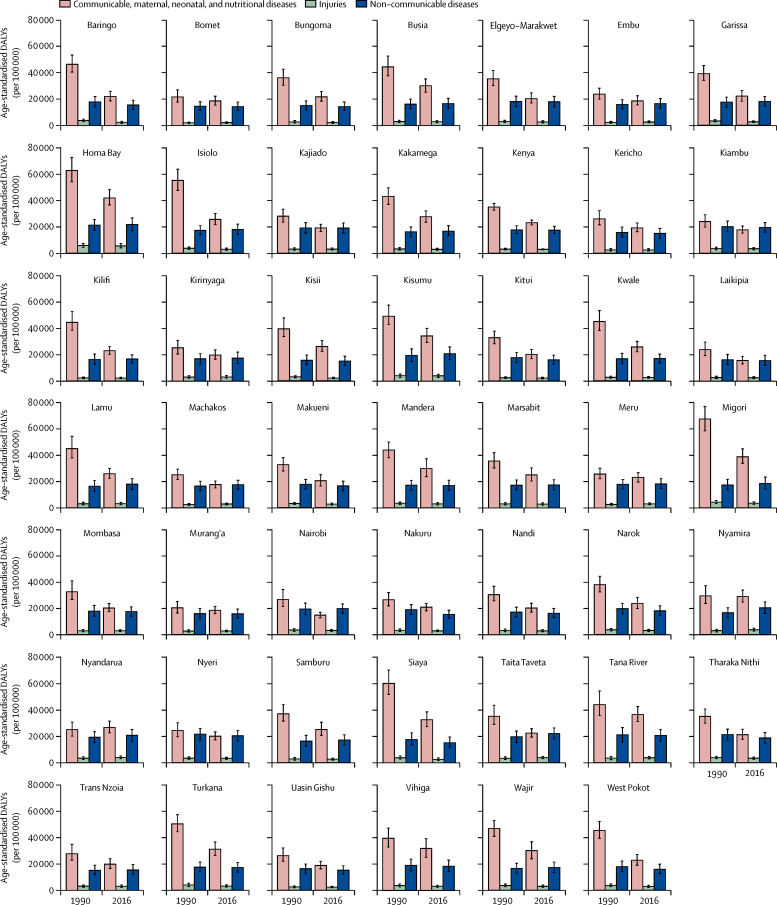
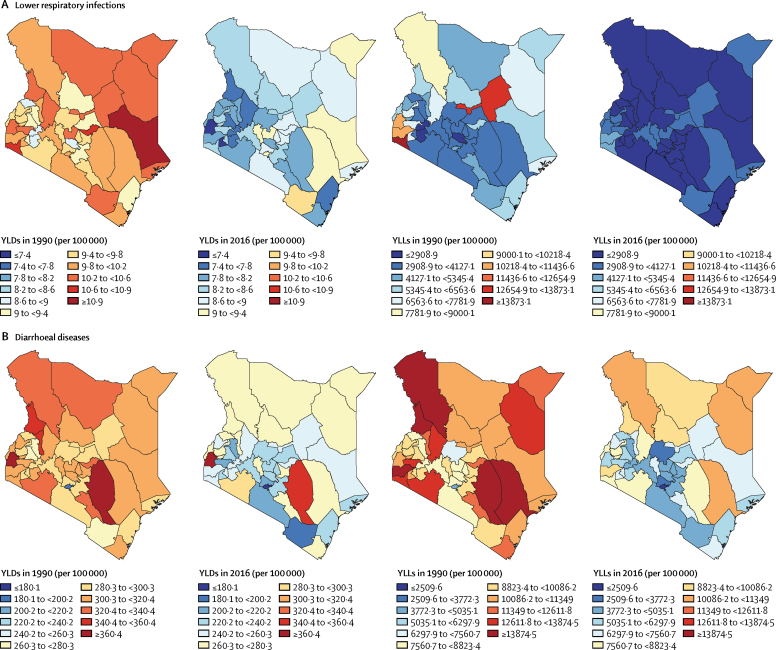
Interpretation: Health outcomes have improved in Kenya since 2006. The burden of communicable diseases decreased but continues to predominate the total disease burden in 2016, whereas the non-communicable disease burden increased. Health gains varied strikingly across counties, indicating targeted approaches for health policy are necessary.
Funding: Bill & Melinda Gates Foundation.
Copyright © 2019 The Author(s). Published by Elsevier Ltd. This is an Open Access article under the CC BY 4.0 license. Published by Elsevier Ltd.. All rights reserved.
Figures
Comment in
-
Estimates of subnational health trends in Kenya.Lancet Glob Health. 2019 Jan;7(1):e8-e9. doi: 10.1016/S2214-109X(18)30516-3. Lancet Glob Health. 2019. PMID: 30554765 Free PMC article. No abstract available.
References
-
- Government of the Republic of Kenya . Government of the Republic of Kenya; Nairobi: 2007. Kenya Vision 2030: the popular version.
-
- Ministry of Health, Kenya . Ministry of Health; Nairobi: 2014. Kenya Health Policy 2014–2030: towards attaining the highest standard of health.
-
- UN . United Nations; Geneva: 2015. Transforming our world: the 2030 agenda for sustainable development.
Publication types
MeSH terms
LinkOut - more resources
Full Text Sources
Medical
