. 2018 Dec 5;100(5):1149-1162.e5.
doi: 10.1016/j.neuron.2018.09.047. Epub 2018 Oct 25.

A Self-Regulating Gap Junction Network of Amacrine Cells Controls Nitric Oxide Release in the Retina

Affiliations

A Self-Regulating Gap Junction Network of Amacrine Cells Controls Nitric Oxide Release in the Retina

Jason Jacoby et al. Neuron. .

Abstract

Neuromodulators regulate circuits throughout the nervous system, and revealing the cell types and stimulus conditions controlling their release is vital to understanding their function. The effects of the neuromodulator nitric oxide (NO) have been studied in many circuits, including in the vertebrate retina, where it regulates synaptic release, gap junction coupling, and blood vessel dilation, but little is known about the cells that release NO. We show that a single type of amacrine cell (AC) controls NO release in the inner retina, and we report its light responses, electrical properties, and calcium dynamics. We discover that this AC forms a dense gap junction network and that the strength of electrical coupling in the network is regulated by light through NO. A model of the network offers insights into the biophysical specializations leading to auto-regulation of NO release within the network.

Keywords: Connexin-45; NOS; amacrine cell; gap junctions; light adaptation; nNOS; nNOS-2; nitric oxide; retina.


Figures

Figure 1.
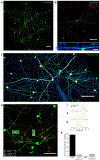
Figure 1.. nNOS-2 ACs Form a Dense Electrically Coupled Network via Connexin 45 Hemichannels
(A) Network coupling from a single nNOS-2 AC filled with neurobiotin. Scale bar, 100 μm. (B) Top: morphology of an nNOS-2 AC filled with neurobiotin (green) in an nNOS-Cre transgenic retina in the presence of MFA; Ai9 reporter-driven expression of tdTomato is observed in both GCL (magenta) and INL (red) somata. Scale bar, 100 μm. Bottom: side view showing dendritic stratification with ChAT bands (blue); the location is marked with blue arrows. Scale bar, 20 μm. (C) Alexa Fluor 488 readily passes through nNOS-2 AC gap junctions. Multi-photon Z projection image of an nNOS-2 gap junction-coupled network, revealed after a single nNOS-2 AC was patched and filled with Alexa Fluor 488. Scale bar, 100 μm. (D) Projection image depicting coplanar crossings (red triangles), coplanar crossings with Cx45 puncta present (blue triangles outlined in red), and a single nonplanar crossing (cyan) to represent neurites offset in the z axis. Scale bar, 50 mm. The numbered crossings (i)–(iii) are graphed below the image z axis profile of neurobiotin-filled neurite channel (green) and Cx45 antibody channel (red). Graphs (i) and (iii) depict Cx45 positive, coplanar crossings and are visualized in the inset images (white boxes), with colocalization between the neurobiotin channel and Cx45 channel yielding a single yellow punctum (the long side of the images measures 5.4 μm). Graph (ii) shows two distinct neurobiotin peaks (nonplanar) and an absence of Cx45 in both offset neurites. (E) Black bars represent the percentage of coplanar crossings that contain Cx45 puncta (48%, 11 of 23) and Cx36 puncta (0%, 0 of 20); the gray bars represent the percentage of coplanar crossings that contain Cx45 puncta (4%, 1 of 23) or Cx36 puncta (5%, 1 of 20) when the connexin channel was rotated 90 degrees.
Figure 2.
Figure 2.. Direct Measurements of Gap Junction Conductance by Paired Recordings
(A) Traced image showing a recorded pair of gap-junctionally coupled nNOS-2 ACs. Scale bar, 100 μm. (B) Membrane voltage changes in cell 1 (green traces) and cell 2 (magenta traces) resulting from current injections in cell 1. Dotted lines indicate the resting membrane potential. (C) The same as in (B), but current injections are in cell 2. Average traces of 10 individual trials are shown for (B) and (C). (D) Current-voltage relationship for the electrically coupled cells in (A). (E) Coupling coefficient versus intersoma distance. Data points are each direction of injections for each of the 4 cell pairs. The error bars in (D) and (E) indicate SEM across n = 8 different amplitude (positive and negative) current injections.
Figure 3.
Figure 3.. Physiology of nNOS-2 ACs
(A) Representative current clamp recording of an nNOS-2 AC in response to a light spot (200 μm diameter, 200 R*/rod/s) from darkness. (B) Membrane potential changes in response to stimuli of increasing light levels; 100% positive Weber contrast spots are presented. Average traces from 10 individual trials are shown for (C) and (D). (C) Top: peak ON (cyan) and OFF (black) response amplitudes of nNOS-2 ACs stimulated at 100% positive Weber contrast. Bottom: changes in kinetics of both response latency (black trace, left axis) and slope (red trace, right [red] axis) derived from responses across light levels as shown in (B). Error bars indicate SEM across cells (n = 4). (D) Single-trial raw traces from a current injection series from a recorded nNOS-2 AC. (E) Top: baseline membrane potential measured before light stimulation at different mean background illumination levels (black traces). Shown is the cycle average response of an nNOS-2 AC to a 3-Hz light flicker at 50,000 R*/rod/s (red trace). Bottom: population average of baseline membrane potentials (black) and peak response to light flicker (red). Error bars indicate SEM across cells (n = 5).
Figure 4.
Figure 4.. Calcium Dynamics of nNOS-2 ACs
(A) Gray traces depict the OGB-1 fluorescence change in response to current injections of increasing amplitude. The red bar indicates the duration of current injection. (B) Two-photon fluorescent image showing OGB-1-filled nNOS-2 ACs; the gray traces on the left were derived from the dendritic region boxed in gray. Pre-stimulus and peak stimulus fluorescence change in primary neurites are depicted at the top. Scale bar, 10 μm. (C) Single traces of change in OGB-1 fluorescence in the soma (red) and neurite (gray) following 200 pA current injection. Regions of interests (ROIs) are marked in with a red circle (soma) and gray square (neurite). (D) Population data of the normalized area measured beneath functional calcium traces plotted versus the voltage response to current injection in various amplitudes, characterizing the fluorescence-to-voltage relationship. Error bars depict SEM across n = 3 cells, with sigmoid fit shown in black. (E) Currents recorded via voltage step pulse protocol under control conditions (left), during cobalt blockade of calcium channels (center), and following washoff (right). (F) Difference currents between cobalt traces subtracted from control traces during the voltage step amplitudes shown in the legend. (G) Population data of the normalized peak current (calcium) versus the voltage change of nNOS-2 ACs characterizing the direct calcium current-to-voltage relationship. Error bars depict SEM across n = 3 cells, with sigmoid fit shown in black.
Figure 5.
Figure 5.. Depolarizing Individual nNOS-2 ACs Produces NO in the IPL
(A) From left to right: neurobiotin fill of an example nNOS-2 AC, DAF fluorescence measured after depolarizing a single nNOS-2 cell in the GCL by +40 mV from resting membrane potential by a train of current injection pulses at 0.5 Hz for 15 min, and merge of the DAF and tdTomato channels. Symbols denote a patched soma (asterisk), neurite (box), surrounding somata (arrow), and capillaries (arrowhead). All images were acquired using confocal microscopy. Scale bars, 50 μm. (B) The same as in (A) but in the presence of the bath-applied NOS inhibitor L-NAME. (C) DAF fluorescence intensity in tdTomato-positive somata as a function of distance from the patched soma. Intensities were normalized to the intensity in the patched soma. Different symbols indicate different retinas using whole-cell depolarizations (gray symbols, n = 3) or perforated patch depolarizations (red symbols, n = 2). Solid lines are single exponential fits excluding the patched soma for both whole-cell access depolarization (black) and perforated patch depolarization (red). (D) DAF fluorescence intensity in the neurites ofthe patched cell as a function of distance from the soma. Symbols are as in (C) (whole cell, n = 3; perforated patch, n = 2). Exponential fits are the same as in (C).
Figure 6.
Figure 6.. Gap Junction Network Coupling Is Regulated by Light and NO and Affects Input Resistance
(A–E) Degree of coupling (denoted by dark somata) derived from a single nNOS-2 AC filled with neurobiotin after exposure to (A) darkness, (B) full-field light flicker, (C) SNAP, (D) MFA, and (E) full-field light flicker in the presence of L-NAME prior to whole-cell access. Scale bars, 200 μm. (F) Population data showing the average number of coupled cells for each condition (dark versus light, p < 10−3; dark versus SNAP, p < 10−4; dark versus MFA, p < 10~4; paired t tests; dark versus L-NAME, p > 0.23; n = 4 for each comparison). A table of p values for t tests is shown to the right of the graph. (G) Resistance measurements from individual nNOS-2 ACs in darkness followed by exposure to light flicker, SNAP, MFA, or light flicker in the presence of L-NAME. Statistical significance between resistance in the dark and other conditions: dark versus light flicker, p < 10−2; dark versus SNAP, p < 10−2; dark versus MFA, p < 10−3; dark versus light flicker + L-NAME, p > 0.23 (paired Student’s t tests, n = 4 for each comparison). A table of p values fort tests is shown to the right of the graph.
Figure 7.
Figure 7.. Kinetics of Light Flicker-Induced Resistance Changes in the nNOS Network
Input resistance measurements of nNOS cells (n = 4) and their population average starting from darkness (baseline), followed by a light flicker stimulus presented at 1-min intervals. The gray line shows sigmoid fit to population data.
Figure 8.
Figure 8.. Biophysical Model of the nNOS-2 AC Network
(A) Diagram of an instantiation of the network model. Somata are numbered, and their neurites are shown in gray. Cell 21 was injected with current for coupling measurements, and its soma and neurites are colored magenta. All other somata are colored according to their coupling coefficient with cell 21. Locations of gap junctions are shown as green triangles. Scale bar, 100 μm. (B) Heatmap of the number of gap junctions made between cells in the network shown in (A). (C) Coupling coefficients ofthe 35 cell pairs tested in 10 different instantiations of the model as in (A), plotted versus the distance between somata. Data points from Figure 2E are shown in red. (D) Median input resistance of the 36 model cells as a function of gap junction conductance. The black line is the mean value across 10 instantiations of the model. SD is shown by the shaded region. Dotted lines highlight the 4 different experimentally measured values of input resistance from Figure 6G and the corresponding values of gap junction conductance in the model.

Similar articles

Cited by

References

    1. Badea TC, and Nathans J (2004). Quantitative analysis of neuronal morphologies in the mouse retina visualized by using a genetically directed reporter. J. Comp. Neurol 480, 331–351. - PubMed
    1. Benda J, Bock R, Rujan P, and Ammermüller J (2001). Asymmetrical dynamics of voltage spread in retinal horizontal cell networks. Vis. Neurosci 18, 835–848. - PubMed
    1. Berntson A, and Taylor WR (2000). Response characteristics and receptive field widths of on-bipolar cells in the mouse retina. J. Physiol 524, 879–889. - PMC - PubMed
    1. Berson DM, Dunn FA, and Takao M (2002). Phototransduction by retinal ganglion cells that set the circadian clock. Science 295, 1070–1073. - PubMed
    1. Biesecker KR, Srienc AI, Shimoda AM, Agarwal A, Bergles DE, Kofuji P, and Newman EA (2016). Glial Cell Calcium Signaling Mediates Capillary Regulation of Blood Flow in the Retina. J. Neurosci 36, 9435–9445. - PMC - PubMed

Publication types