. 2019 Jan;7(1):29-39.
doi: 10.1158/2326-6066.CIR-18-0138. Epub 2018 Nov 27.

Batf3-Dependent Genes Control Tumor Rejection Induced by Dendritic Cells Independently of Cross-Presentation

Affiliations

Batf3-Dependent Genes Control Tumor Rejection Induced by Dendritic Cells Independently of Cross-Presentation

Derek J Theisen et al. Cancer Immunol Res. 2019 Jan.

Abstract

The BATF3-dependent cDC1 lineage of conventional dendritic cells (cDC) is required for rejection of immunogenic sarcomas and for rejection of progressive sarcomas during checkpoint blockade therapy. One unique function of the cDC1 lineage is the efficient cross-presentation of tumor-derived neoantigens to CD8+ T cells, but it is not clear that this is the only unique function of cDC1 required for tumor rejection. We previously showed that BATF3 functions during cDC1 lineage commitment to maintain IRF8 expression in the specified cDC1 progenitor. However, since cDC1 progenitors do not develop into mature cDC1s in Batf3 -/- mice, it is still unclear whether BATF3 has additional functions in mature cDC1 cells. A transgenic Irf8-Venus reporter allele increases IRF8 protein concentration sufficiently to allow autonomous cDC1 development in spleens of Batf3 -/- mice. These restored Batf3 -/- cDC1s are transcriptionally similar to control wild-type cDC1s but have reduced expression of a restricted set of cDC1-specific genes. Restored Batf3 -/- cDC1s are able to cross-present cell-associated antigens both in vitro and in vivo However, Batf3 -/- cDC1 exhibit altered characteristics in vivo and are unable to mediate tumor rejection. These results show that BATF3, in addition to regulating Irf8 expression to stabilize cDC1 lineage commitment, also controls expression of a small set of genes required for cDC1-mediated tumor rejection. These BATF3-regulated genes may be useful targets in immunotherapies aimed at promoting tumor rejection.


Conflict of interest statement

The authors declare no competing financial interests.

Conflict of interest: The authors declare no potential conflict of interest.

Figures

Figure 1.
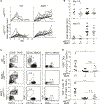
Figure 1.. Irf8VENUS bypasses the need for both Batf3 and Batf in cDC1 development in spleen.
(A) Flow cytometry analysis of splenocytes of the indicated genotypes gated on live singlets that were B220 CD11c+ MHCII+. Numbers indicate the percentage of cells in the CD24+ CD172a gate. (B) Compiled flow cytometric data for for samples analyzed as in (A). Each symbol represents a single mouse. One-way ANOVA, Sidak’s multiple comparisons test; Adjusted P value: * 0.0341; **** <0.0001. (C) Flow cytometry analysis of splenocytes gated on live singlets that were B220 CD11c+ MHCII+. Numbers indicate the percentage of cells in the XCR1+ CD172a gate. (D) Compiled flow cytometric data for samples analyzed as in (C). Each symbol represents a single mouse. One-way ANOVA, Holm-Sidak’s multiple comparisons test, alpha 0.05; adjusted P value: * 0.0386; ** 0.0021.
Figure 2.
Figure 2.. Cross-presentation by IRF8VENUS restored cDC1s does not require Batf3 or Batf.
(A, B) CFSE dilution within OT-1 T cells on day 3 after in vitro exposure to sorted splenic cDCs1from mice of the indicated genotype and no antigen (0), or with 50000 (50), or 100000 (100) irradiated ovalbumin-loaded MHCI−/− splenocytes. Numbers indicate the percentage of CD44+ OT-1 cells with diluted CFSE. OT-1 cells were identified as live singlet CD45.1+Va2+ CD3+ CD8+. (A) Representative flow cytometry analysis. (B) Each circle represents an individual mouse. (C, D) CFSE dilution within OT-1 T cells on day 3 after in vitro exposure to sorted splenic cDC1s or cDC2s from mice of the indicated genotype and no antigen (0) or 100000 (100) irradiated ovalbumin-loaded MHCI−/− splenocytes. Numbers indicate the percentage of CD44+ OT-1 cells with diluted CFSE. (C) Representative flow cytometry analysis. (D) Proliferation is expressed as a percentage of OT-1 T cell proliferation after exposure to wild-type cDC1s and 100,000 irradiated ovalbumin-loaded MHCI−/− splenocytes. Each circle within matching genotypes for cDC1s and cDC2s represents an individual mouse. (E, F) Flow cytometry analysis of CFSE-labelled OT-1 T cells from spleens (E) or inguinal lymph nodes (SDLN, F) after transfer into mice of the indicated genotype. CFSE dilution was analyzed on day 3 after injection of CFSE-labeled OT-1 T cells on day −1 followed by irradiated ovalbumin-loaded splenocytes on day 0. Numbers indicate the percentage of CD44+ OT-1 cells with diluted CFSE. OT-1 cells were identified as live singlet CD45.1+ Vα2+ CD3+ CD8α+. Batf3+/+IRF8VENUS–, n=2; Batf3+/+IRF8VENUS+, n=1; Batf3−/− IRF8VENUS–, n=2; Batf3−/− IRF8VENUS+, n=4.
Figure 3.
Figure 3.. Batf3 is required for tumor rejection even in IRF8VENUS+ mice.
(A, B) Mice of the indicated genotype were injected with 1 × 10⁶ 1969 fibrosarcoma cells subcutaneously. Data are combined from three experiments. (A) Each line represents mean tumor diameter for an individual mouse. (B) Mean tumor diameter compared between the indicated genotypes on day 7–8 and day 18. Each symbol represents an individual tumor. (C, D, E) Flow cytometry analysis of fibrosarcomas from mice of the indicated genotype on day 9–10. (C) Representative flow cytometric analysis. CD45+ 7AAD cells, pre-gated as B220, were analyzed for the percentage of CD11c+ MHCII+ cells and the percentage of CD11c MHCII cells (first column). CD11c+ MHCII+ cells the percentage of XCR1+ CD172a cDC1s (second column). MHCII CD11c cells were analyzed for CD8α+ XCR1 T cells (third column). (D,E) Cumulative flow cytometric analysis from fibrosarcomas grown in mice of the indicated genotype. Each symbol represents an individual tumor. (D) XCR1+ cDCs. One-way ANOVA, Sidak’s multiple comparisons test, alpha 0.05; adjusted P value: *, 0.0241; ns, 0.8645. (E) CD8α+ T cells. One-way ANOVA, Sidak’s multiple comparisons test, alpha 0.05; adjusted P value: ***, 0.0001; ns, 0.6075.
Figure 4.
Figure 4.. Batf3−/− IRF8VENUS+ mice lack XCR1+ dermal cDC1s.
(A-C) Flow cytometry analysis of ear skin of non-tumor bearing mice of the indicated genotype. (A) Percentage of MHCII+ CD11c+ cells. Cells were pre-gated as 7AAD CD45+ B220 CD326INT/LOW. (B) CD24+ CD11b cells within MHCII+ CD11c+ cells from (A). (C) CD24+ XCR1+ cDC1s within MHCII+ CD11c+ cells from (A). Data are representative of at least three biological replicates for each genotype.
Figure 5.
Figure 5.. Batf3−/− IRF8VENUS+ mice lack XCR1+ migratory cDC1s in SDLN.
(A-C) Flow cytometry analysis of SDLN (pooled inguinal, axial, brachial) of non-tumor bearing mice of the indicated genotype. (A) Gating for resident cDCs (MHCIIint CD11chi), and migratory cDCs (MHCIIhi CD11cint), is shown. Cells were pre-gated as B220, CD326int/low. (B) Resident cDCs (MHCIIint CD11chi) as gated from (A) were analyzed for the percentage of CD24+ CD172a or XCR1+ CD172a cDC1s. (C) Migratory cDCs (MHCIIhi CD11cint) as gated from (A) were analyzed for the percentage of CD24+ CD172a or XCR1+ CD172a cDC1s. Data are representative of 6 biological replicates for each genotype.
Figure 6.
Figure 6.. A limited number of cDC1 specific genes are Batf3-dependent.
(A-C) Microarray analysis of cDCs from mice of the indicated genotype. (A) Fold change in expression of annotated probe sets between cDC1s and cDC2s (x-axis) is plotted against the fold change in expression between WT Irf8VENUS+ and WT Irf8VENUS– cells (y-axis). (B) Fold change in expression of annotated probe sets between cDC1s and cDC2s (x-axis) is plotted against fold change between WT Irf8VENUS+ and Batf3−/− Irf8VENUS+ cells (y-axis). (C) Expression of cDC1-specific genes that were ≥ 2.6-fold more highly expressed in WT Irf8VENUS+ compared to Batf3−/− Irf8VENUS+ cDC1s from spleen, shown for spleen cDC1s, and for resident and migratory cDC1s from SDLN (pooled inguinal, brachial and cervical). FC indicates the fold change in gene expression between WT Irf8VENUS+ and Batf3−/− Irf8VENUS+ cells. Each column represents an independent microarray.
Figure 7.
Figure 7.. Batf3-dependent genes harbor nearby enhancers binding BATF3/IRF8.
(A) Expression of selected Batf3-dependent genes in the indicated cell type and genotype. Each symbol represents an independent expression array. Two-tailed unpaired Student t tests; alpha= 0.05. (B) ChIP-seq analysis for H3K27Ac, BATF3 and IRF8 in WT cDC1s for the indicated loci, Clnk, Gcsam, Itga8, and Xcr1 as indicated. Previously reported H3K27Ac, BATF3, and IRF8 ChIP-seq data (GSE66899) were remapped to mm10. Genomic scales are shown beneath each plot.

Similar articles

Cited by

References

    1. Murphy TL, Grajales-Reyes GE, Wu X, Tussiwand R, Briseno CG, Iwata A et al. Transcriptional Control of Dendritic Cell Development. Annu.Rev Immunol 2016;34:93–119. - PMC - PubMed
    1. Hildner K, Edelson BT, Purtha WE, Diamond M, Matsushita H, Kohyama M et al. Batf3 deficiency reveals a critical role for CD8alpha+ dendritic cells in cytotoxic T cell immunity. Science 2008;322:1097–1100. - PMC - PubMed
    1. Torti N, Walton SM, Murphy KM, and Oxenius A. Batf3 transcription factor-dependent DC subsets in murine CMV infection: differential impact on T-cell priming and memory inflation. Eur.J.Immunol. 2011;41:2612–2618. - PubMed
    1. Nopora K, Bernhard CA, Ried C, Castello AA, Murphy KM, Marconi P et al. MHC class I cross-presentation by dendritic cells counteracts viral immune evasion. Front Immunol. 2012;3:348. - PMC - PubMed
    1. Diamond MS, Kinder M, Matsushita H, Mashayekhi M, Dunn GP, Archambault JM et al. Type I interferon is selectively required by dendritic cells for immune rejection of tumors. J.Exp.Med. 2011;208:1989–2003. - PMC - PubMed

Publication types

Substances