

A common molecular logic determines embryonic stem cell self-renewal and reprogramming
- PMID: 30482756
- PMCID: PMC6316172
- DOI: 10.15252/embj.2018100003
A common molecular logic determines embryonic stem cell self-renewal and reprogramming
Abstract
During differentiation and reprogramming, new cell identities are generated by reconfiguration of gene regulatory networks. Here, we combined automated formal reasoning with experimentation to expose the logic of network activation during induction of naïve pluripotency. We find that a Boolean network architecture defined for maintenance of naïve state embryonic stem cells (ESC) also explains transcription factor behaviour and potency during resetting from primed pluripotency. Computationally identified gene activation trajectories were experimentally substantiated at single-cell resolution by RT-qPCR Contingency of factor availability explains the counterintuitive observation that Klf2, which is dispensable for ESC maintenance, is required during resetting. We tested 124 predictions formulated by the dynamic network, finding a predictive accuracy of 77.4%. Finally, we show that this network explains and predicts experimental observations of somatic cell reprogramming. We conclude that a common deterministic program of gene regulation is sufficient to govern maintenance and induction of naïve pluripotency. The tools exemplified here could be broadly applied to delineate dynamic networks underlying cell fate transitions.
Keywords: abstract boolean network; formal verification; maintenance and reprogramming; naive pluripotency; transcription factor network modelling.
© 2018 The Authors. Published under the terms of the CC BY 4.0 license.
Figures
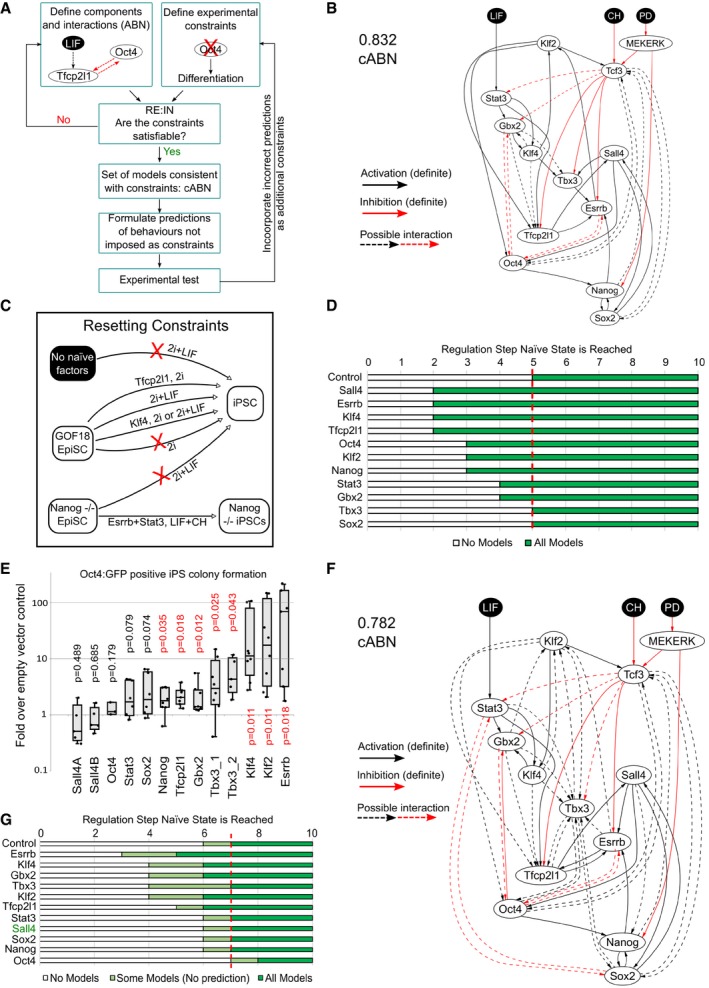
Flowchart describing the methodology. Network components were identified based on functional studies from the literature, and possible interactions between components defined based on pairwise gene expression correlation. A set of experimental results served as constraints. The software RE:IN synthesises all possible interaction networks consistent with the constraints, which is termed the cABN. The cABN is used to formulate predictions to be tested experimentally. Importantly, predictions do not overlap with imposed constraints. If predictions are falsified, the cABN can be further refined by incorporating new experimental results as constraints. The refined cABN is used to generate further predictions.
cABN derived from a Pearson coefficient threshold of 0.832, consistent with constraints previously defined for ESC self‐renewal (Dunn et al, 2014). Solid arrow, required interaction; dashed arrow, possible interaction; black arrow, activation; red arrow, inhibition. There is no regulation hierarchy associated with component positioning.
Illustration of EpiSC resetting constraints. See Appendix Fig S1F.
Predicted number of regulation steps required for all models to stabilise in the naïve state under forced expression of a single network component. The red dashed line indicates the number of steps required under empty vector control.
Fold increase of Oct4‐GFP+ colony number over control under forced expression of individual factors. n ≥ 5, where each dot indicates an independent experiment. Box plots show median, 1st and 3rd quartile values. One‐sample Wilcoxon test P‐values are as indicated, with P < 0.05 shown in red.
cABN derived from a Pearson coefficient threshold of 0.782.
Predictions from the 0.782 cABN. Light green regions indicate where some, but not all, concrete networks allow stable conversion to the naïve state. Sall4 is indicated in green, as this was imposed as a constraint and therefore is not a model prediction.
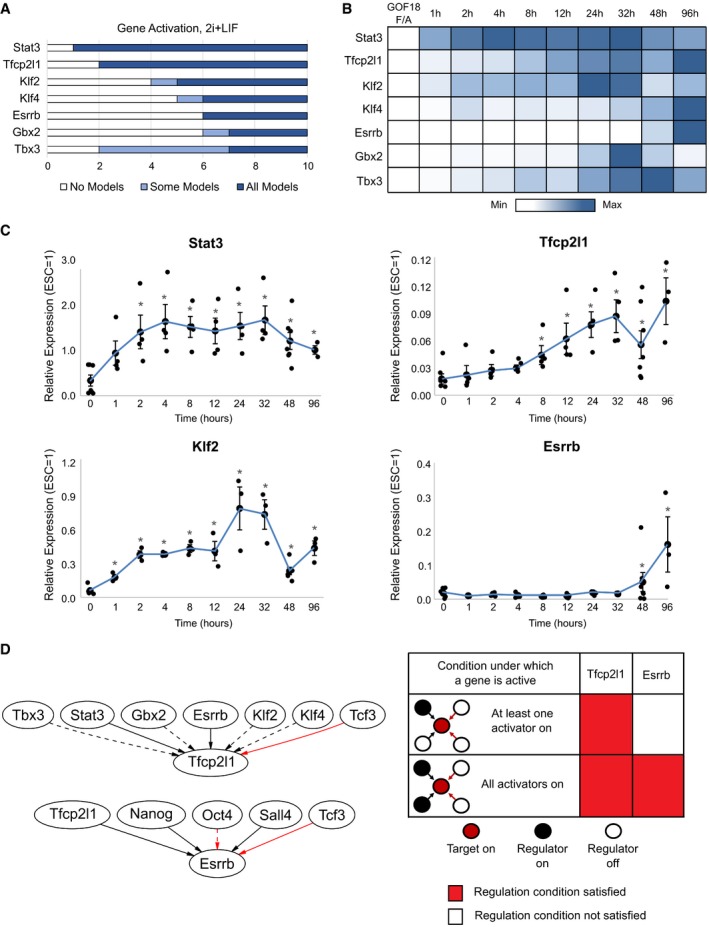
Model predictions of the number of regulation steps required for permanent activation of each network component. Light blue regions indicate where only some, while dark blue regions indicate that all concrete networks predict that the given gene has permanently activated.
Heatmap of average gene expression normalised to β‐actin over an EpiSC resetting time course in 2i+LIF. Each row is coloured according to the unique minimum and maximum for that gene. The values shown are average expression of four independent experiments.
Gene expression for Stat3, Klf2, Esrrb and Tfcp2l1 during EpiSC resetting relative to established mouse ESCs. β‐actin serves as an internal control. Mean ± SEM, n = 4 independent experiments. *P < 0.05 Student's t‐test.
Left: Local network topology for Tfcp2l1 and Esrrb. Right: Summary of regulation conditions required by Tfcp2l1 and Esrrb in the 0.782 cABN.
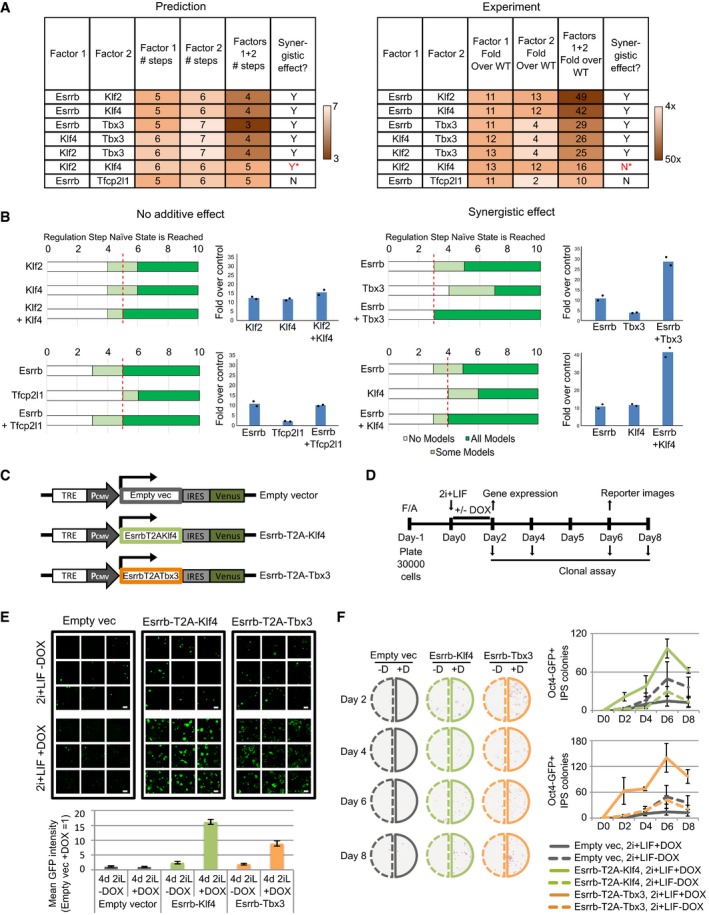
Left: Comparison of the number of steps required for all concrete networks to stabilise in the naïve state under single and dual factor expression. Right: Experimental results showing the fold increase in colony number over empty vector control under single and dual factor expression. Y = Yes, N = No, *incorrect prediction.
Predictions and experimental validation of examples of synergistic and non‐additive factor combinations. Experimental measurement of fold increase over empty vector control of Oct4‐GFP+ colony numbers. Bars indicate the mean of 2 independent experiments, shown as dots.
Scheme for DOX‐inducible constructs used for dual factor expression.
Experimental set‐up for the functional characterisation of Esrrb‐T2A‐Klf4 or Esrrb‐T2A‐Tbx3 forced expression in EpiSC resetting.
Representative confocal images (top) and quantification (bottom) of Oct4‐GFP reporter mean intensity. The indicated cell lines were treated with DOX for the first 2 days and imaged at Day 6. Mean ± SD of 9 technical replicates. One representative experiment of two is shown. Scale bars = 300 μm.
Representative alkaline phosphatase (AP) staining images (left) and quantification (right) of AP+ colonies after clonal replating, as described in panel. Mean ± SEM, n = 3 independent experiments.
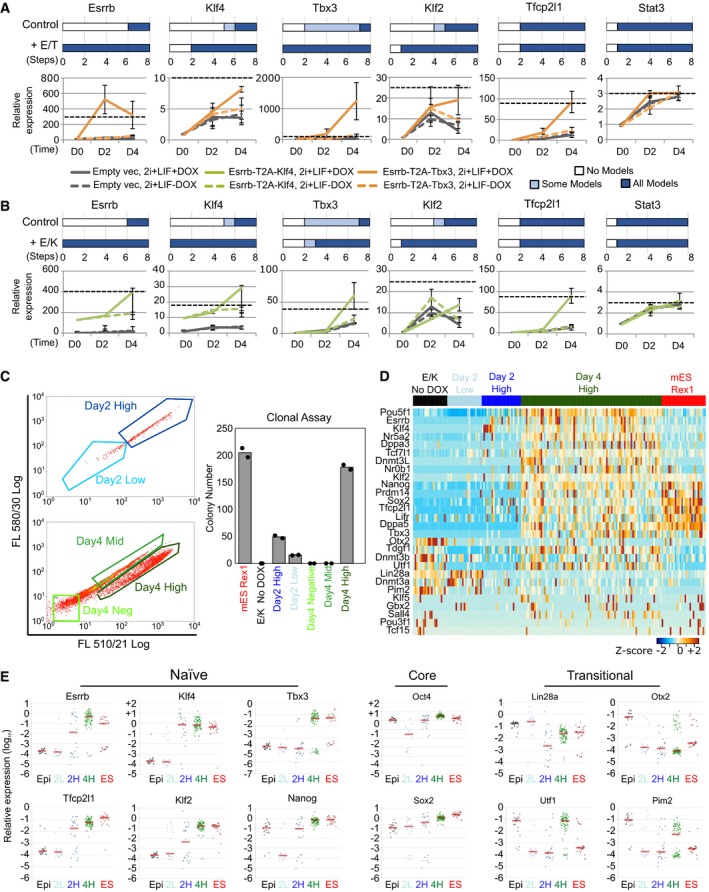
Top: Predictions of the number of regulation steps required for full activation of the indicated gene under control or dual expression of Esrrb and Tbx3 (+E/T). Bottom: Gene expression of EpiSCs harbouring empty vector (grey) or Esrrb/Tbx3 (orange), captured at D0 (F/A), D2 and D4 (as described in Fig 3D). Dashed black line: expression levels in ESCs maintained in 2i+LIF. Data normalised to empty vector cultures in F/A. Gapdh serves as an internal control. Mean ± SEM, n = 3 independent experiments.
As for panel (A), comparison of control with dual expression of Esrrb and Klf4 (+E/K, green in bottom plot). Mean ± SEM, n = 3 independent experiments for bottom qRT–PCR panels.
Left: Flow cytometry profiles of the resetting progression of EpiSCs stably transfected with the Esrrb‐T2A‐Klf4 construct and cultured in 2i+LIF with DOX for 2 and 4 days, with the indicated fraction of cells sorted for colony formation assay. Since the Venus reporter is under the control of a DOX responsive element, and the emission spectra of Venus and GFP fluorescence overlap, the Oct4‐GFP reporter could not be fully distinguished from Venus expression. Right: Number of AP+ colonies formed from 250 sorted cells from indicated fractions. Data points represent two technical replicates of one out of two independent experiments.
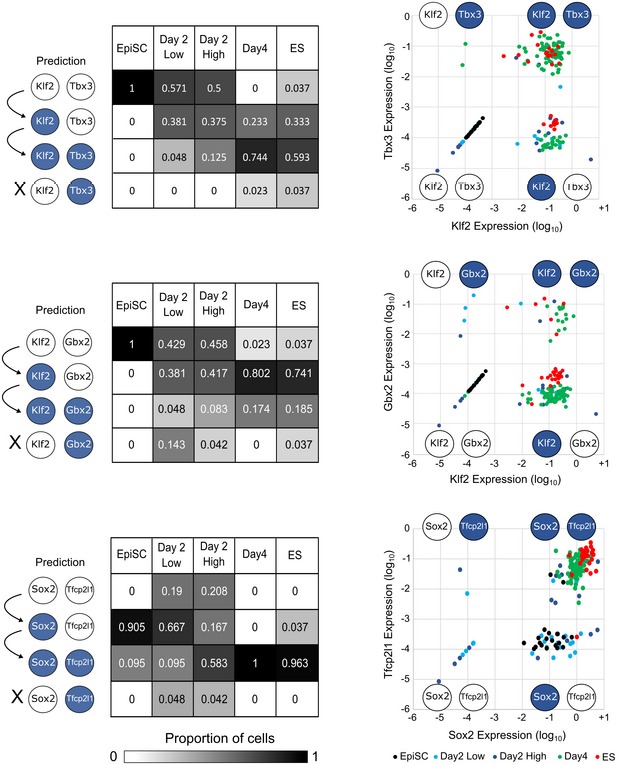
Heatmap of single‐cell expression measured by qRT–PCR of major ESC and EpiSC markers in un‐induced EpiSCs (black), established ESCs (red), Day 2 High/Low (dark and light blue) and Day 4 High cells (green).
Scatterplots of the relative expression of pluripotency and transitional markers. Red bar corresponds to median gene expression, and each dot represents a single cell.
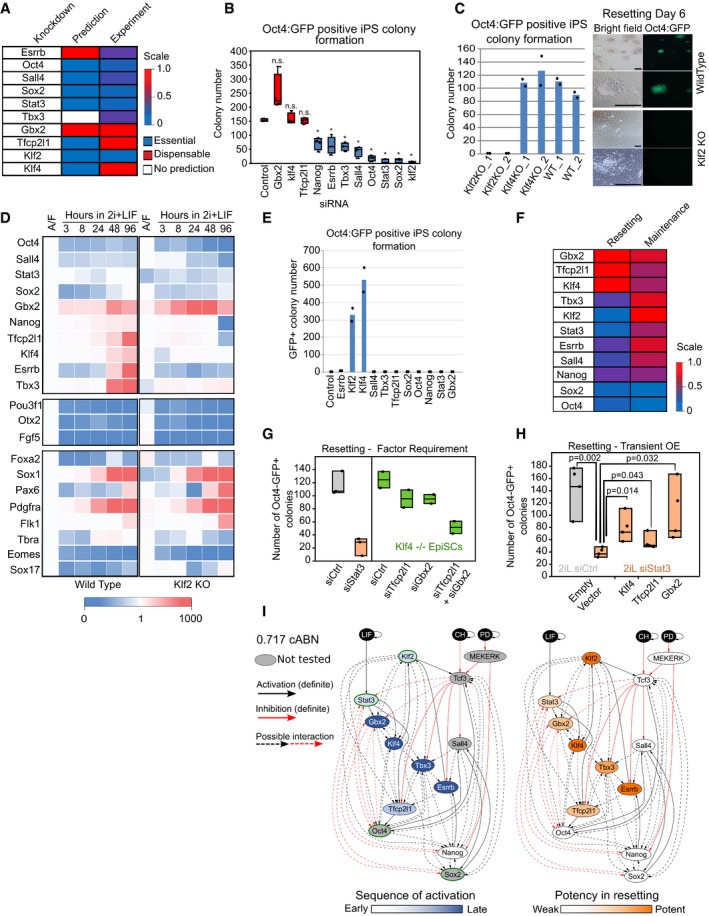
0.782 cABN predictions of essential or dispensable factors for EpiSC resetting, compared with the experiment results shown in panel (B).
siRNA knockdown effects measured by Oct4‐GFP+ colony formation at Day 6 of resetting. n = 4 independent experiments. Box plots indicate 1st, 3rd quartile and median. *P < 0.05 Student's t‐test; n.s. = not significant.
Left, resetting capacity of Klf2 and Klf4 KO EpiSCs measured by Oct4‐GFP+ colony formation at Day 6 of resetting. Data points represent two independent experiments. Right, representative fluorescent and bright field images of wild‐type and Klf2 KO EpiSCs at Day 6 of resetting in 2i+LIF. Scale bars = 100 μm.
Expression of naïve pluripotency, transition and somatic lineage markers in wild‐type and Klf2 KO EpiSCs during a resetting time course in 2i+LIF. Expression is normalised to wild‐type EpiSCs in A/F, and β‐actin was used as internal control. The values shown correspond to the average expression of three technical replicates from one representative experiment out of two.
Rescue of Klf2 KO EpiSC resetting by forced expression of individual network components measured by Oct4‐GFP+ colony formation at Day 6 of resetting in 2i+LIF. Data points represent two independent experiments.
Comparison between the effect of single factor knockdowns on ESC maintenance (n = 4 independent experiments) and EpiSC resetting using experimental results.
EpiSC resetting in 2i+LIF measured by Oct4‐GFP+ colony formation after Stat3 siRNA in wild‐type EpiSCs (left), or Klf4 KO EpiSCs transfected with Tfcp2l1 and Gbx2 siRNAs. n = 3 independent experiments in wild‐type cells (box plots indicate min, median, max), n = 2 for Klf4 −/− cells (box plots indicate min, mean, max).
EpiSC resetting in 2i+LIF measured by Oct4‐GFP+ colony formation of Stat3 knockdown EpiSCs transiently transfected with Tfcp2l1, Gbx2 and Klf4. n = 4 independent experiments: Student's t‐test, P‐value indicated on plot. Box plots indicate min, median, max. See also Appendix Fig S7C.
The 0.717 cABN used to illustrate the kinetics of EpiSC resetting as determined experimentally. Left: Genes coloured according to the order of activation during resetting in 2i+LIF. Right: Genes coloured according to their potency in enhancing the efficiency of resetting. TFs with a green border are the common factors required for ESC self‐renewal and EpiSC resetting. See also Appendix Fig S6A.
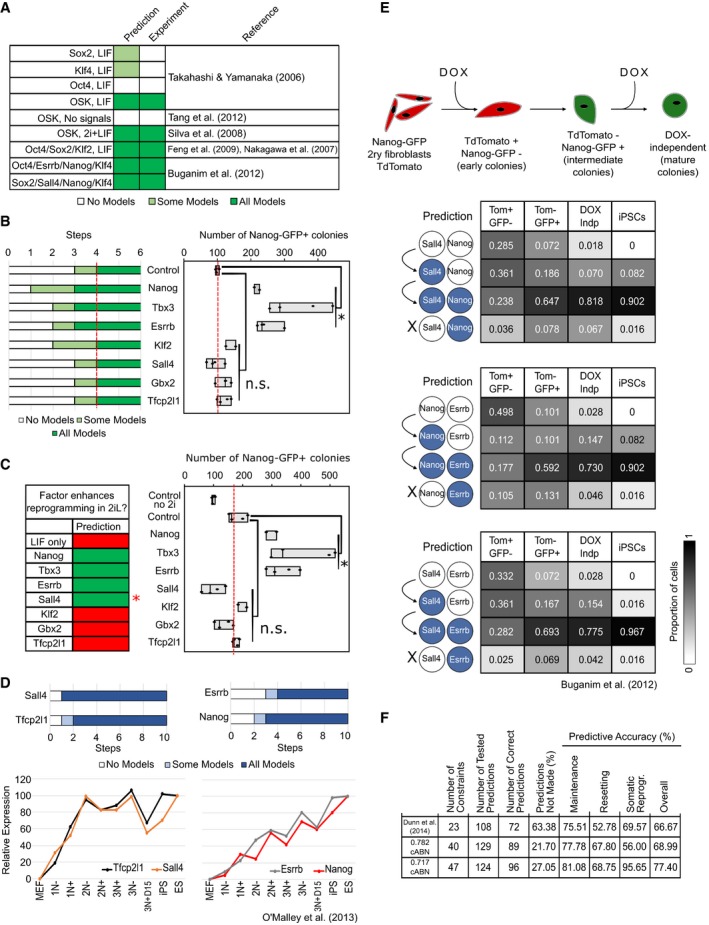
0.717 cABN predictions compared with published data on gene combinations that do (dark green) or do not (white) enable MEF reprogramming.
Comparison of predictions (left) and experimental outcome (right) for the potency of additional network factors in OSKM‐driven MEF reprogramming in LIF containing medium. n = 4 independent experiments, except Klf2 and Nanog where n = 2 independent experiments. *P < 0.05 Student's t‐test. n.s. = not significant. Red dashed lines indicate empty vector + OSKM level. Box plots indicate min, median, max.
Comparison of predictions (left) and experimental outcome (right) for the potency of additional network factors in OSKM‐driven MEF reprogramming in 2i+LIF. n = 4 independent experiments, except Klf2 and Nanog where n = 2 independent experiments. *P < 0.05 Student's t‐test. n.s. = not significant. Empty vector + OSKM reprogramming in LIF (“control no 2i”) was included as a control for the effect of 2i addition. Red dashed lines indicate empty vector + OSKM control level. Box plots indicate min, median, max. The red asterisk indicates that the effect of Sall4 was incorrectly predicted.
Recapitulation of the gene activation kinetics during MEF reprogramming. Top, the number of regulation steps required for permanent activation of the indicated gene. Tfcp2l1 and Sall4 are found to activate earlier than Nanog and Esrrb. Bottom, gene expression measured from sorted populations of reprogramming intermediates from O'Malley et al (2013).
Delineation of gene activation at single‐cell level. Top, experimental scheme used in Buganim et al (2012) for the isolation of reprogramming intermediates profiled by single‐cell RT–qPCR. Bottom, comparison of the predictions of the sequence of gene activation between gene pairs (left) along the reprogramming trajectory in OSKM+LIF, compared with experimental measurements from Buganim et al (2012). Each table shows the percentage of single cells at the indicated stage of reprogramming (column) that have the indicated expression state of the gene pair considered (row).
Summary of the predictive accuracy of the three cABNs progressively refined against experimental results, with the 0.717 cABN having the highest predictive accuracy for each set of the investigation.
Comment in
-
Let it RE:IN: integrating experimental observations to predict pluripotency network behaviour.EMBO J. 2019 Jan 3;38(1):e101133. doi: 10.15252/embj.2018101133. Epub 2018 Dec 13. EMBO J. 2019. PMID: 30545825 Free PMC article.
Similar articles
-
O-GlcNAc regulates pluripotency and reprogramming by directly acting on core components of the pluripotency network.Cell Stem Cell. 2012 Jul 6;11(1):62-74. doi: 10.1016/j.stem.2012.03.001. Epub 2012 May 17. Cell Stem Cell. 2012. PMID: 22608532
-
Naive-like ESRRB+ iPSCs with the Capacity for Rapid Neural Differentiation.Stem Cell Reports. 2017 Dec 12;9(6):1825-1838. doi: 10.1016/j.stemcr.2017.10.008. Epub 2017 Nov 9. Stem Cell Reports. 2017. PMID: 29129686 Free PMC article.
-
Ash2l interacts with Oct4-stemness circuitry to promote super-enhancer-driven pluripotency network.Nucleic Acids Res. 2019 Nov 4;47(19):10115-10133. doi: 10.1093/nar/gkz801. Nucleic Acids Res. 2019. PMID: 31555818 Free PMC article.
-
Ground rules of the pluripotency gene regulatory network.Nat Rev Genet. 2017 Mar;18(3):180-191. doi: 10.1038/nrg.2016.156. Epub 2017 Jan 3. Nat Rev Genet. 2017. PMID: 28045100 Review.
-
A regulatory circuitry locking pluripotent stemness to embryonic stem cell: Interaction between threonine catabolism and histone methylation.Semin Cancer Biol. 2019 Aug;57:72-78. doi: 10.1016/j.semcancer.2019.01.005. Epub 2019 Jan 30. Semin Cancer Biol. 2019. PMID: 30710616 Review.
Cited by
-
BMP4 drives primed to naïve transition through PGC-like state.Nat Commun. 2022 May 19;13(1):2756. doi: 10.1038/s41467-022-30325-4. Nat Commun. 2022. PMID: 35589713 Free PMC article.
-
OneSC: A computational platform for recapitulating cell state transitions.bioRxiv [Preprint]. 2024 Jun 3:2024.05.31.596831. doi: 10.1101/2024.05.31.596831. bioRxiv. 2024. Update in: Bioinformatics. 2024 Nov 28;40(12):btae703. doi: 10.1093/bioinformatics/btae703. PMID: 38895453 Free PMC article. Updated. Preprint.
-
A gene regulatory network controls the balance between mesendoderm and ectoderm at pluripotency exit.Mol Syst Biol. 2019 Dec;15(12):e9043. doi: 10.15252/msb.20199043. Mol Syst Biol. 2019. PMID: 31885203 Free PMC article.
-
Insights into Noncanonical and Diversified Functions of ABCF1: From Health to Disease.J Mol Biol. 2025 Sep 1;437(17):169286. doi: 10.1016/j.jmb.2025.169286. Epub 2025 Jun 11. J Mol Biol. 2025. PMID: 40513648 Review.
-
Canalizing kernel for cell fate determination.Brief Bioinform. 2024 Jul 25;25(5):bbae406. doi: 10.1093/bib/bbae406. Brief Bioinform. 2024. PMID: 39171985 Free PMC article.
References
-
- Acampora D, Omodei D, Petrosino G, Garofalo A, Savarese M, Nigro V, Di Giovannantonio LG, Mercadante V, Simeone A (2016) Loss of the Otx2‐binding site in the nanog promoter affects the integrity of embryonic stem cell subtypes and specification of inner cell mass‐derived epiblast. Cell Rep 15: 2651–2664 - PubMed
-
- Adachi K, Kopp W, Wu G, Heising S, Greber B, Stehling M, Araúzo‐Bravo MJ, Boerno ST, Timmermann B, Vingron M, Schöler HR (2018) Esrrb unlocks silenced enhancers for reprogramming to naive pluripotency. Cell Stem Cell 23: 266–275.e6 - PubMed
-
- Anchang B, Hart TDP, Bendall SC, Qiu P, Bjornson Z, Linderman M, Nolan GP, Plevritis SK (2016) Visualization and cellular hierarchy inference of single‐cell data using SPADE. Nat Protoc 11: 1264–1279 - PubMed
Publication types
MeSH terms
Grants and funding
LinkOut - more resources
Full Text Sources
Molecular Biology Databases
