. 2019 Apr 1;79(7):1465-1479.
doi: 10.1158/0008-5472.CAN-18-1972. Epub 2018 Nov 27.

STING Promotes Homeostasis via Regulation of Cell Proliferation and Chromosomal Stability

Affiliations

STING Promotes Homeostasis via Regulation of Cell Proliferation and Chromosomal Stability

Diana Rose E Ranoa et al. Cancer Res. .

Abstract

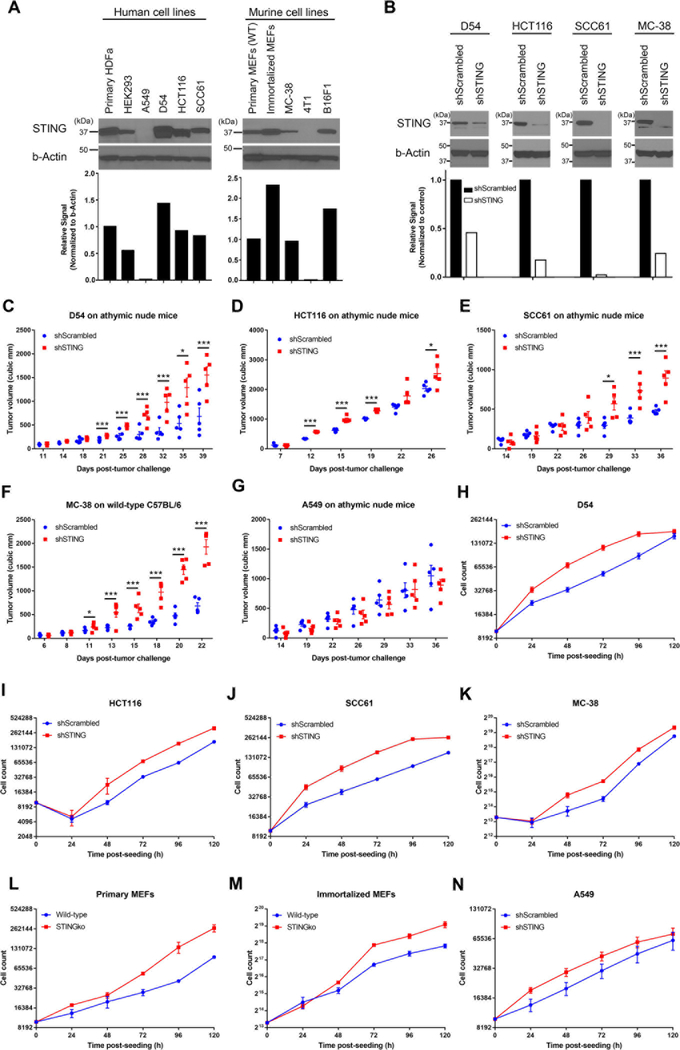
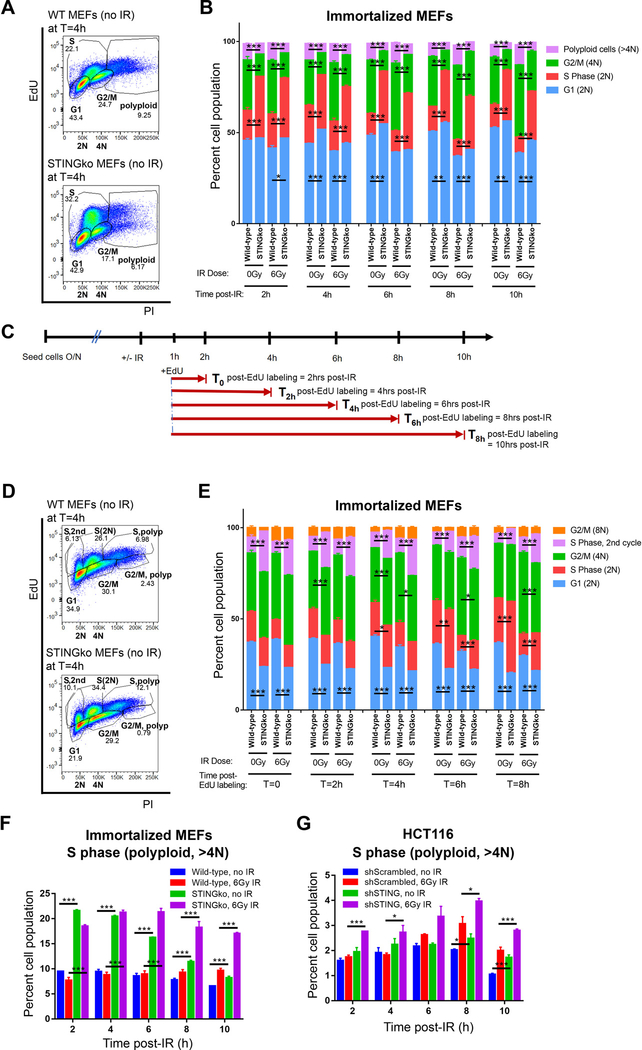
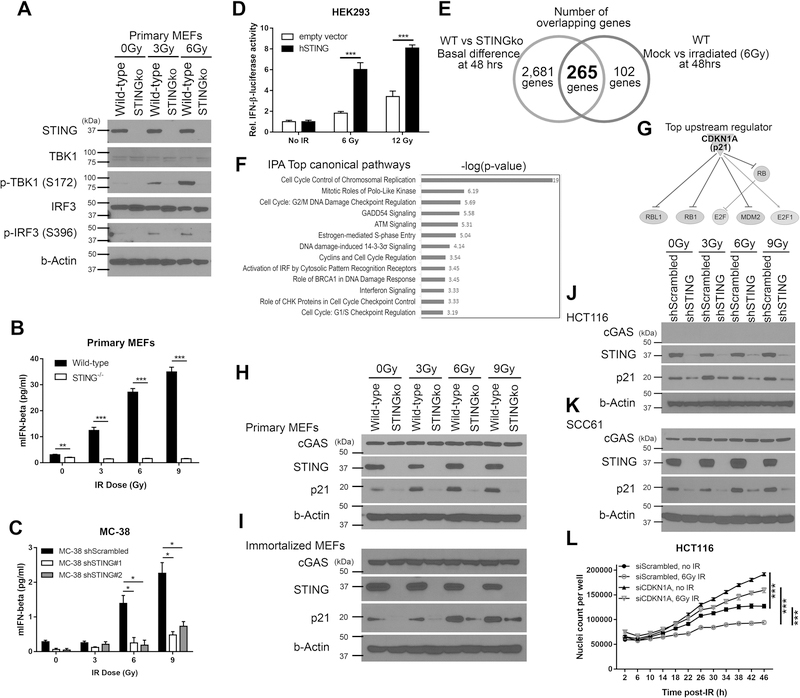
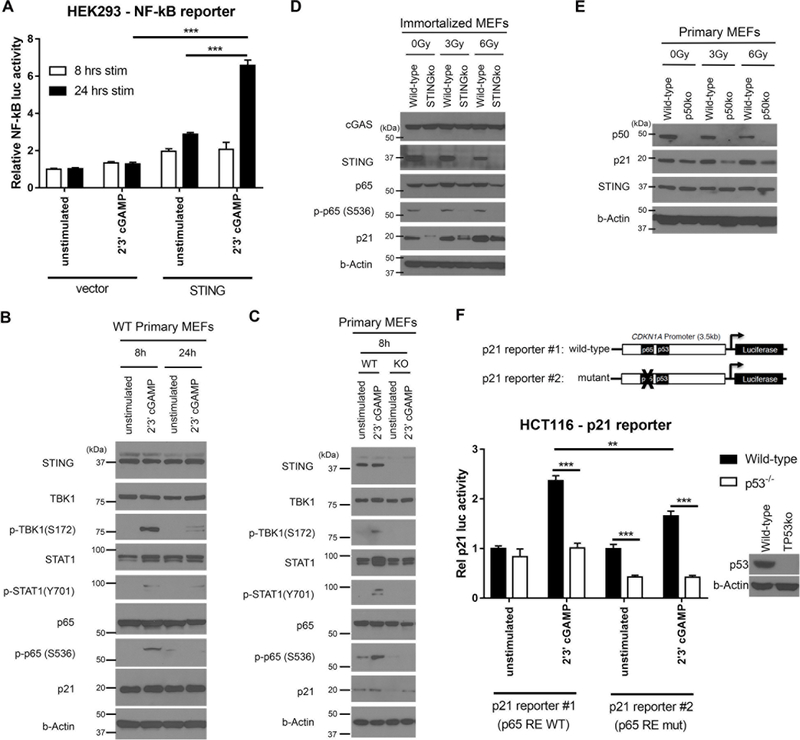
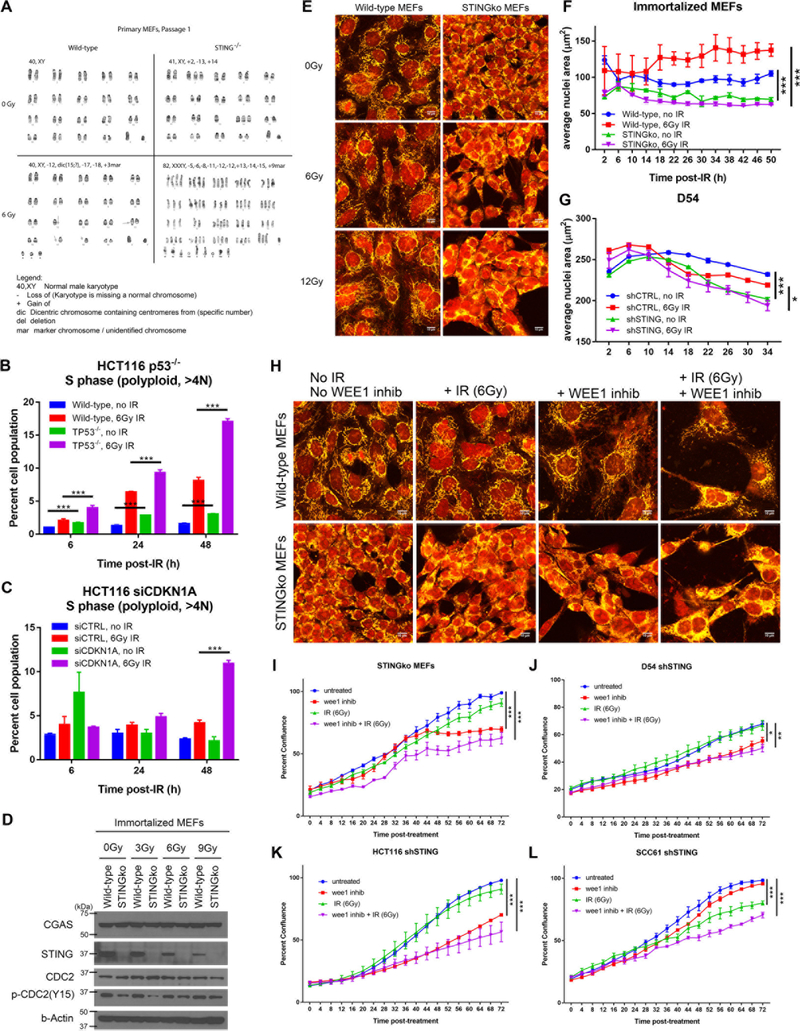
Given the integral role of stimulator of interferon genes (STING, TMEM173) in the innate immune response, its loss or impairment in cancer is thought to primarily affect antitumor immunity. Here we demonstrate a role for STING in the maintenance of cellular homeostasis through regulation of the cell cycle. Depletion of STING in human and murine cancer cells and tumors resulted in increased proliferation compared with wild-type controls. Microarray analysis revealed genes involved in cell-cycle regulation are differentially expressed in STINGko compared with WT MEFs. STING-mediated regulation of the cell cycle converged on NFκB- and p53-driven activation of p21. The absence of STING led to premature activation of cyclin-dependent kinase 1 (CDK1), early onset to S-phase and mitosis, and increased chromosome instability, which was enhanced by ionizing radiation. These results suggest a pivotal role for STING in maintaining cellular homeostasis and response to genotoxic stress. SIGNIFICANCE: These findings provide clear mechanistic understanding of the role of STING in cell-cycle regulation, which may be exploited in cancer therapy because most normal cells express STING, while many tumor cells do not.See related commentary by Gius and Zhu, p. 1295.


Conflict of interest statement

Conflict of Interest: R.C. Widau is a clinical research scientist and has ownership interest (including stock, patents, etc.) in Eli Lilly and Company. R. Parry has ownership interest (including stock, patents, etc.) in Varian Medical Systems. S.J. Kron reports receiving commercial research grant from AbbVie and has ownership interest (including stock, patents, etc.) in OncoSenescence. R.R. Weichselbaum has ownership interest (including stock, patents, etc.) in OncoSenescence and Boost Therapeutics Inc. No potential conflicts of interest were disclosed by the other authors.

Figures

Figure 1.
Figure 1.. STING controls tumor growth in a cell-intrinsic mode.
(A) Western blot analysis of STING expression in various human and mice cell lines. Bottom panel are quantified bands normalized to b-Actin control. (B) Western blot analyses of lysates from stable D54, HCT116, SCC61, and MC-38 tumor cell lines expressing short hairpin RNAs targeting STING (shSTING) or scrambled control (shScrambled). Bottom panel are quantified bands normalized to b-Actin and their respective non-targeting controls. (C-E) Tumor growth of shSTING knockdown and shScrambled control D54 (C); HCT116 (D); and SCC61 (E) cell lines in athymic nude mice. (F) Tumor growth of MC-38 shSTING knockdown in WT C57BL/6 mice. (G) Tumor growth of A549 with shSTING knockdown in athymic nude mice. Tumor model data are representative of three experiments, each with n = 5 mice per group. (H-N) Kinetic analysis of STING-depleted human tumor cell lines D54 (H), HCT116 (I), and SCC61 (J) as well as murine cell lines MC-38 (K), primary WT and STINGko MEFs (L), and SV40-immortalized WT and STINGko MEFs (M) proliferation in vitro were measured over time by manual cell counting. STING-depleted A549 cells were also tested as negative control (N). In vitro growth curve data are representative of at least three experiments, each with n = 3 per group. P-values were determined using unpaired Student’s t-test. Error bars are SEM. *P < 0.05, **P < 0.01, ***P < 0.005.
Figure 2.
Figure 2.. STING-dependent regulation of proliferation is associated with perturbations of cell cycle.
(A) Gating strategy performed on EdU+ and PI+ double-labeled WT (top panel) and STINGko (bottom panel) single cells to identify cell population in G1 (2N), G2/M (4N), S (≥2N, ≤4N), and polyploid cells (>4N). (B) Bar graph representing the percentage of cells in G1 phase, S phase, G2/M phase over time at baseline and in response to IR. (C) Schematic diagram of chase-EdU labeling experiment performed on WT and STINGko MEFs. EdU was added to cells one hour post-IR. Cell were harvested at indicated time points for processing. (D) Gating strategy performed on EdU+ and PI+ double-labeled WT (top panel) and STINGko (bottom panel) single cells to identify cell population in G1 (2N), G2/M (4N), S (≥2N, ≤4N), S phase in second cycle (EdU+ cells at the 2N peak), and polyploid cells (>4N). (E) Bar graph representing the percentage of WT and STINGko cells in G1, G2/M, S phase, and cells in S phase of the second cycle at baseline and in response to IR. (F-G) Bar graph representing the percentage of polyploid cells in WT and STINGko MEFs (F) and shSTING HCT116 (G) over time at baseline and in response to IR. Data are representative of at least two experiments, with each condition done in triplicates. P-values were determined using unpaired Student’s t-test. Error bars are SEM. *P < 0.05, **P < 0.01, ***P < 0.005.
Figure 3.
Figure 3.. STING controls CDKN1A-dependent pathways of cell cycle regulation.
(A) Western analyses of lysates from WT and STING−/− primary MEFs 48 hours post-exposure to increasing doses of IR. The membranes were probed for STING, TBK1, phospho-TBK1 Ser172, IRF3, and phosphor-IRF3 Ser396. Β-actin antibody was used for loading control. (B) IFN-β protein level in WT and STING−/− MEFs supernatant 48 hours following exposure to increasing doses of IR. (C) IFN- β protein secretion in MC-38 with stable shSTING knockdown 48 hours following exposure to increasing doses of IR. (D) Overexpression of STING in HEK293 cells led to a higher IFN-β promoter-driven induction of luciferase activity following exposure to increasing IR dose. (E) Transcriptional profiling of C57BL/6 wild-type (WT) and STINGko primary MEFs 48 hours following 0 or 6 Gy. Venn diagram displays the number of overlapping differentially expressed genes (DEGs) between the basal differences in WT vs. STINGko MEFs and the effects of irradiation in WT MEFs. (F) Top-ranked cellular pathway classification of the 265 DEGs that are activated by IR in WT and STINGko MEFs analyzed using Ingenuity Pathway Analysis (IPA). (G) CDKN1A was predicted as a top upstream regulator that potentially affects most of the 265 DEGs analyzed using IPA Upstream Analysis. (H-K) Western analyses of STING and p21 expression in lysates from primary WT and STINGko MEFs (H), SV40-immortalized WT and STINGko MEFs (I), shSTING HCT116 (J), and shSTING SCC61 (K) harvested 48 hours post-exposure to increasing doses of IR. (L) Kinetic analysis of siCDKN1A HCT116 proliferation in vitro were measured over time in response to 6 Gy IR using the IncuCyte live cell imaging system. In vitro growth curve data are representative of at least two experiments, each with n = 3 per group. P-values were determined using unpaired Student’s t-test. Error bars are SEM. *P < 0.05, **P < 0.01, ***P < 0.005.
Figure 4.
Figure 4.. STING activates CDKN1A in an NF-κB/p53-dependent manner.
(A) Overexpression of STING in HEK293 cells led to a higher NF-κB promoter-driven induction of luciferase activity at 8- and 24-hours following stimulation with 2’3’-cGAMP. (B-C) Western analysis of lysates isolated from WT primary MEFs (B) and STINGko primary MEFs (C) that were stimulated with 2’3’-cGAMP STING-specific agonist at different time points to demonstrate STAT1, NF-κB p65 subunit, and p21 activation. (D) Western analyses of lysates from immortalized WT and STINGko MEFs 48 hours post-exposure to increasing IR dose. (E) Western analyses of lysates from WT and p50−/− primary MEFs 48 hours post-exposure to increasing IR dose. (F) WT and p53−/− HCT116 cells were transiently transfected with either a wild-type (reporter #1) or p65 binding-deficient (reporter #2) CDKN1A promoter-driven luciferase construct. Induction of luciferase activity was measured 24 hours post-stimulation with 2’3’-cGAMP. Data are representative of at least three experiments. P-values were determined using unpaired Student’s t-test. Error bars are SEM. *P < 0.05, **P < 0.01, ***P < 0.005.
Figure 5.
Figure 5.. STING regulates mitotic checkpoint and chromosomal stability.
(A) Representative images of chromosome analysis performed on G-banded metaphase cells from primary WT and STINGko MEFs in passage 1 that were either mock-irradiated or treated with 6 Gy IR. (B-C) Bar graph representing the percentage of polyploid cells in BrdU/PI double-labeled p53−/− (B) and p21-depleted (C) HCT116 cell lines. (D) Western analyses of cGAS, STING, and phospho CDC2 Tyr15 expression in lysates from WT and STINGko MEFs harvested 48 hours post-exposure to increasing IR doses. (E) WT and STINGko MEFs at 48 hours post-treatment with increasing IR dose, stained for DNA and mitochondrial/cytoplasmic compartments using Draq5 and MitoTracker Red, respectively; scale bar, 10 µm. (F-G) Kinetic analysis of average nuclear area of MEFs (F) and D54 tumor cells (G) stained with Nuclight Red dye measured over time at baseline and in response to IR. (H) WT and STINGko MEFs treated with WEE1 inhibitor MK1775 in combination with IR (6 Gy) were stained for DNA and mitochondrial/cytoplasmic compartments using Draq5 and MitoTracker Red, respectively at 48 hours post-treatment; scale bar, 10 µm. (I-L) Kinetic analysis of STINGko MEFs (I) as well as shSTING D54 (J), HCT116 (K), and SCC61 (L) proliferation in vitro were measured over time in response to WEE1 inhibitor MK1775 ± IR (6 Gy) using the IncuCyte live cell imaging system. In vitro growth curve data are representative of at least three experiments, each with n = 3 per group. P-values were determined using unpaired Student’s t-test. Error bars are SEM. *P < 0.05, **P < 0.01, ***P < 0.005.

Comment in

References

    1. Ishikawa H, Barber GN. STING is an endoplasmic reticulum adaptor that facilitates innate immune signalling. Nature 2008;455(7213):674–8. - PMC - PubMed
    1. Ishikawa H, Ma Z, Barber GN. STING regulates intracellular DNA-mediated, type I interferon-dependent innate immunity. Nature 2009;461(7265):788–92 10.1038/nature08476. - DOI - PMC - PubMed
    1. Saitoh T, Fujita N, Hayashi T, Takahara K, Satoh T, Lee H, et al. Atg9a controls dsDNA-driven dynamic translocation of STING and the innate immune response. Proceedings of the National Academy of Sciences of the United States of America 2009;106(49):20842–6 10.1073/pnas.0911267106. - DOI - PMC - PubMed
    1. Zhong B, Yang Y, Li S, Wang Y-Y, Li Y, Diao F, et al. The adaptor protein MITA links virus-sensing receptors to IRF3 transcription factor activation. Immunity 2008;29(4):538–50. - PubMed
    1. Liu S, Cai X, Wu J, Cong Q, Chen X, Li T, et al. Phosphorylation of innate immune adaptor proteins MAVS, STING, and TRIF induces IRF3 activation. Science (New York, NY) 2015;347(6227):aaa2630. - PubMed

Publication types

Substances