. 2019 Feb;179(2):569-587.
doi: 10.1104/pp.18.01036. Epub 2018 Nov 27.

The Plastidic Sugar Transporter pSuT Influences Flowering and Affects Cold Responses

Affiliations

The Plastidic Sugar Transporter pSuT Influences Flowering and Affects Cold Responses

Kathrin Patzke et al. Plant Physiol. 2019 Feb.

Abstract

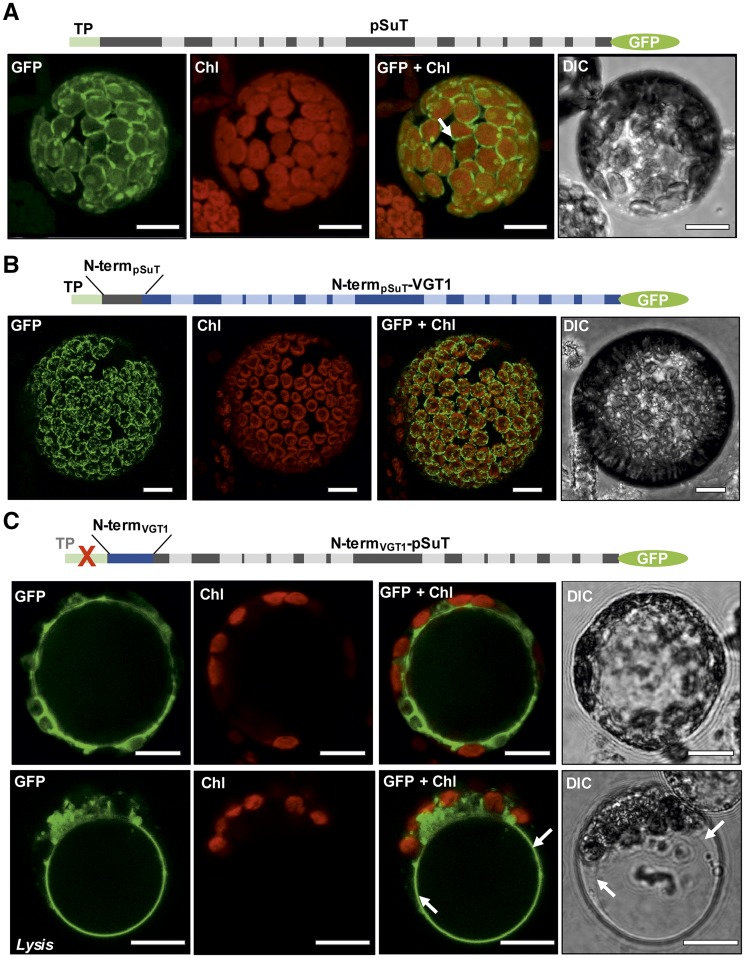
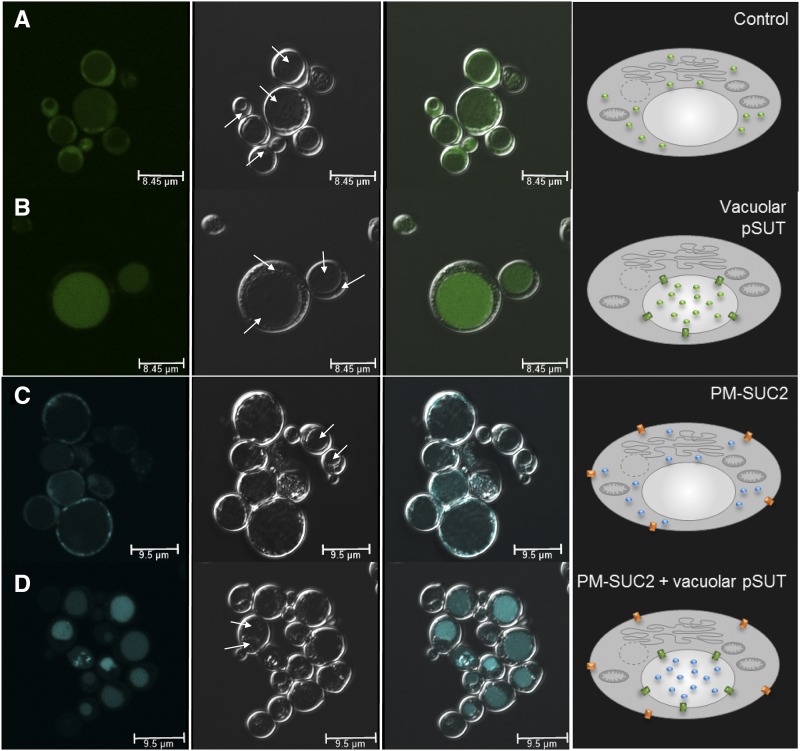
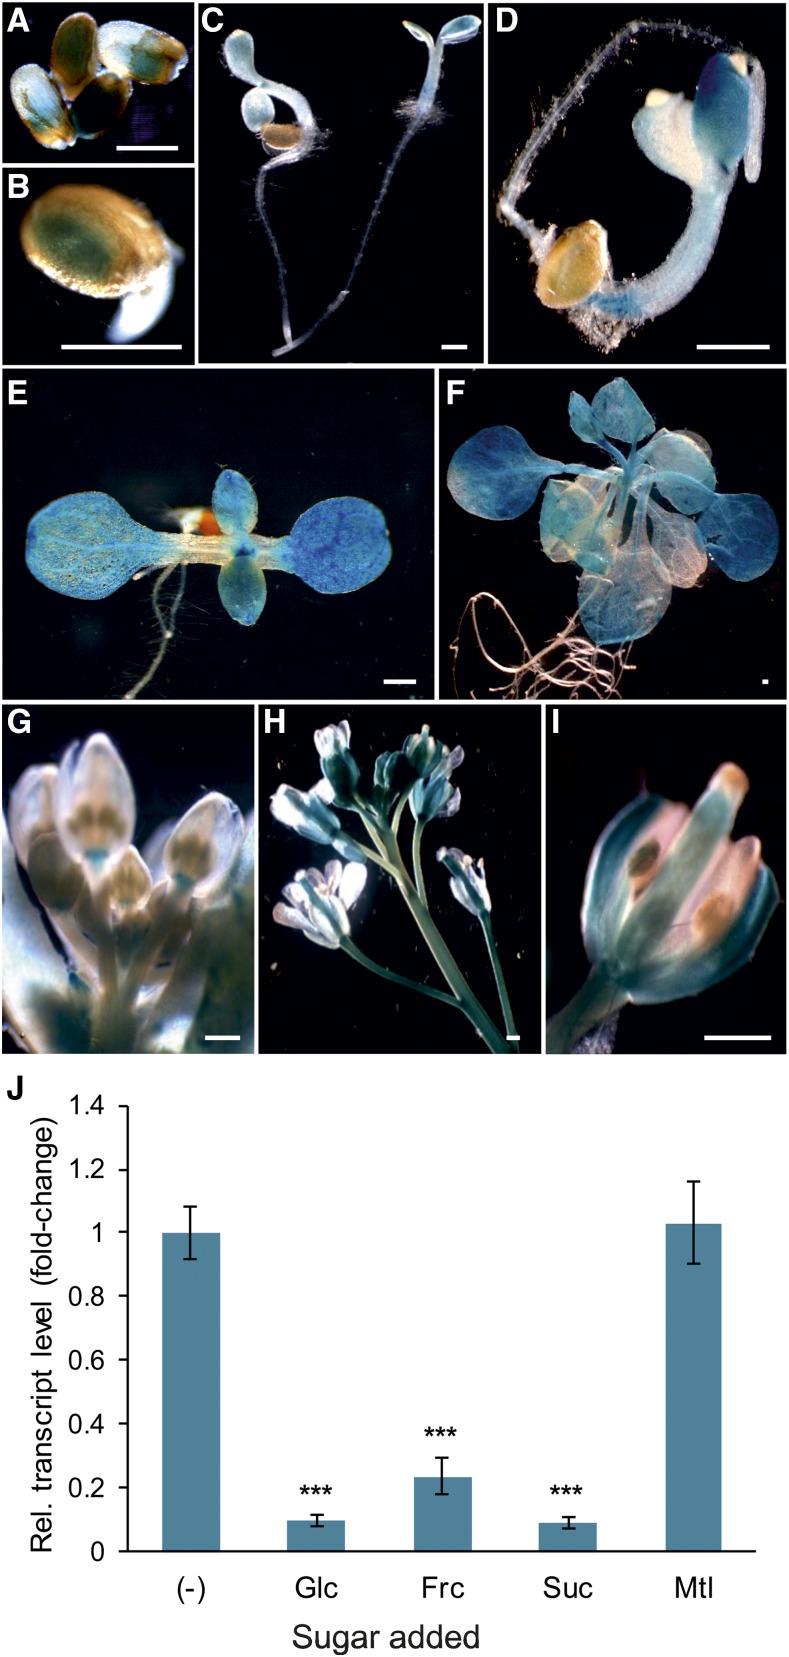
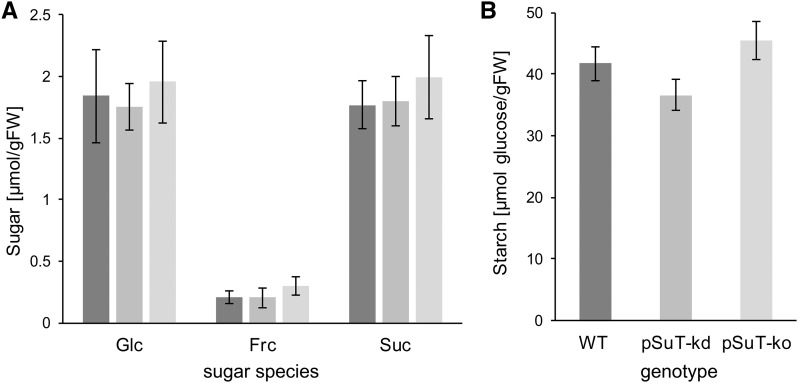
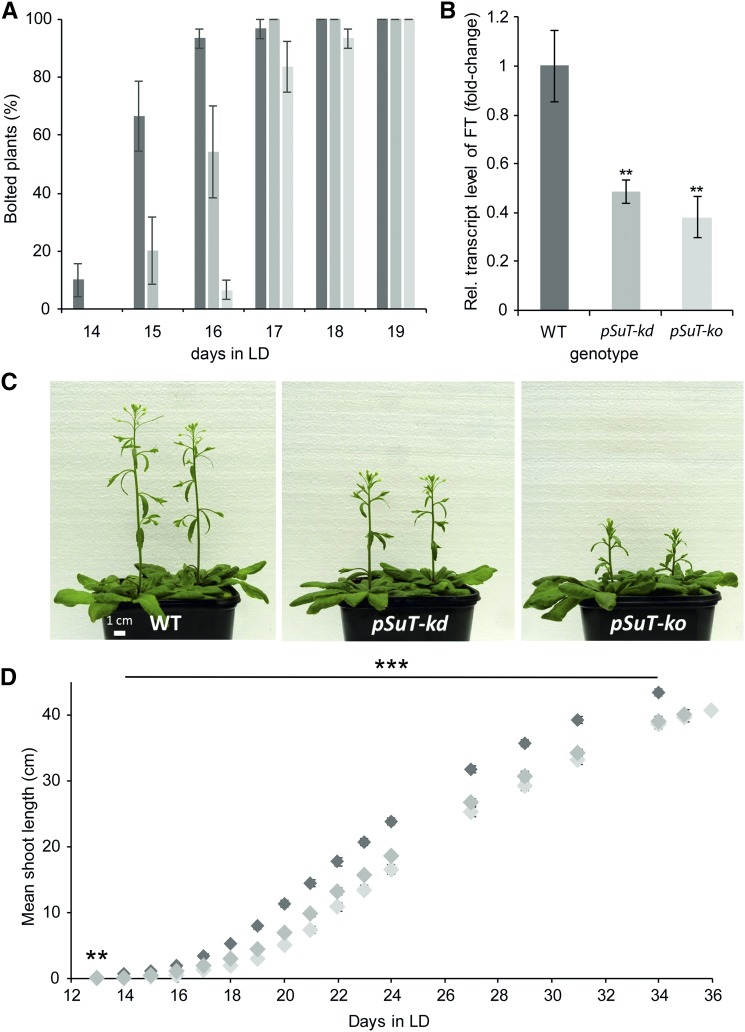
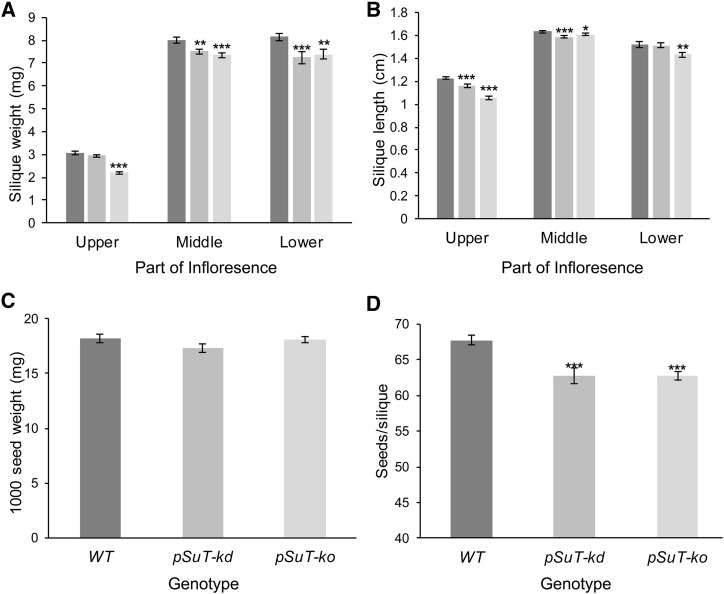
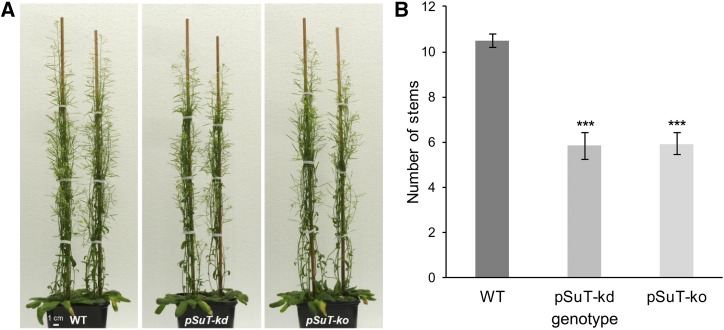
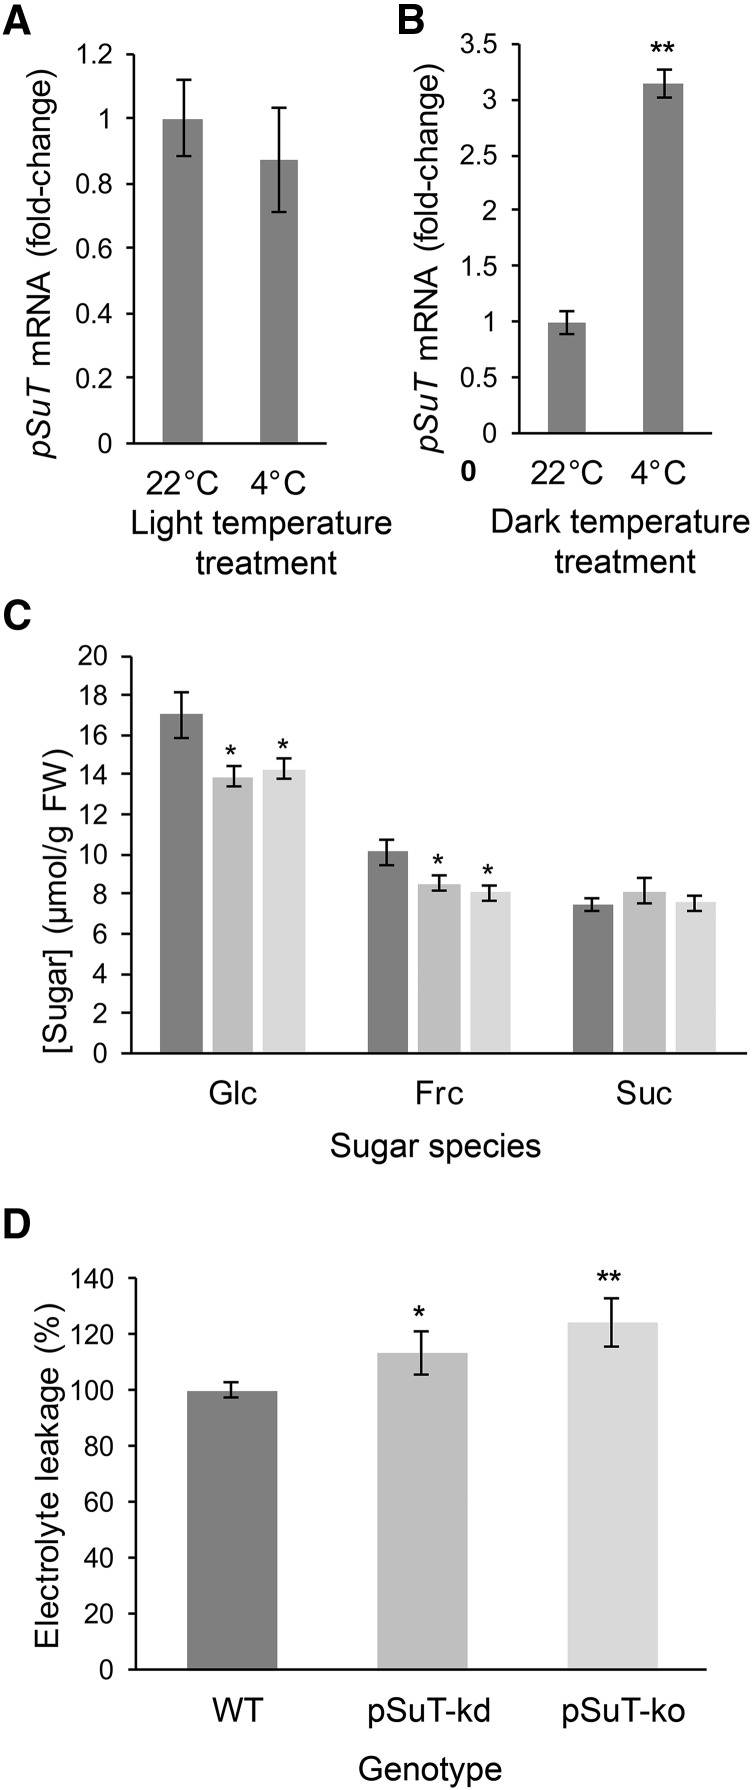
Sucrose (Suc) is one of the most important types of sugars in plants, serving inter alia as a long-distance transport molecule, a carbon and energy storage compound, an osmotically active solute, and fuel for many anabolic reactions. Suc biosynthesis and degradation pathways are well known; however, the regulation of Suc intracellular distribution is poorly understood. In particular, the cellular function of chloroplast Suc reserves and the transporters involved in accumulating these substantial Suc levels remain uncharacterized. Here, we characterize the plastidic sugar transporter (pSuT) in Arabidopsis (Arabidopsis thaliana), which belongs to a subfamily of the monosaccharide transporter-like family. Transport analyses with yeast cells expressing a truncated, vacuole-targeted version of pSuT indicate that both glucose and Suc act as substrates, and nonaqueous fractionation supports a role for pSuT in Suc export from the chloroplast. The latter process is required for a correct transition from vegetative to reproductive growth and influences inflorescence architecture. Moreover, pSuT activity affects freezing-induced electrolyte release. These data further underline the central function of the chloroplast for plant development and the modulation of stress tolerance.


Figures

Figure 1.
Figure 1.
Subcellular localization of pSuT-GFP and pSuT hybrid-GFP fusions. Confocal images show transiently transformed Arabidopsis mesophyll protoplasts. From left to right: GFP fluorescence (GFP), chlorophyll autofluorescence (Chl), fluorescence overlay (GFP + Chl), and Nomarski differential interference contrast (DIC). Schematic illustrations of the fusion constructs are shown above the microscopic images. A, Transient expression of pSuT-GFP carrying the native pSuT N terminus with the chloroplast transit peptide (TP) in maximum projection. GFP fluorescence is confined to the plastid envelope membrane (arrow). B, Transient expression of VGT1-GFP with the VGT1 N terminus replaced by the N terminus of pSuT including the chloroplast transit peptide (N-termpSuT-VGT1) in maximum projection. GFP fluorescence is confined to the plastid envelope. C, Transient expression of pSUT-GFP with the pSuT N terminus replaced by the N terminus of VGT1 (N-termVGT1-pSuT) and without the pSuT chloroplast transit peptide in optical sections. Tonoplast targeting of GFP by N-termVGT1-pSuT is supported by gentle lysis of the protoplast and release of the vacuole (Lysis). Arrows indicate the positions of the tonoplast. Bars = 10 µm.
Figure 2.
Figure 2.
Growth of yeast W303 cells with 2-dGlc. A and B, Droplet test with yeast cells harboring the empty control vector (−) or the construct expressing a vacuole-targeted pSuT-GFP fusion (Supplemental Fig. S5) lacking its chloroplast transit peptide (ΔTP-pSuT). Cells were grown to an OD600 of 1, and serial dilutions were spotted on synthetic complete (SC) agar with 1% (w/v) Glc (A) or 1% (w/v) Glc plus 0.2% (w/v) 2-dGlc (B). C and D, Growth of yeast cells expressing ΔTP-pSuT in liquid SC medium with 2% (w/v) Glc (C) or 2% (w/v) Glc plus 0.2% (w/v) 2-dGlc (D). Data represent means of three independent biological replicates and at least three technical replicates ± sd. E and F, Schematic of the principle of the Glc 2-dGlc uptake assays. The pSuT-dependent sequestration into vacuoles results in the partial detoxification of 2-dGlc. Yellow spheres represent Glc, orange spheres represent 2-dGlc molecules, and green rectangles represent the GFP fusion of ΔTP-pSuT.
Figure 3.
Figure 3.
Uptake of fluorescent sugar derivatives. 2-NBDG and esculin uptake by yeast W303 cells is shown. The first image in each row (left) shows substrate-dependent fluorescence channels (494–551 nm for 2-NBDG and 465–600 nm for esculin). The second image shows the dark-field image, the third image shows the overlay, and the fourth image (right) shows a schematic representation of the underlying transport processes. Solid arrows point to the luminal side of vacuoles, and dashed arrows point to the cytosol. In the schemes, green spheres represent 2-NDBG, blue spheres represent esculin, green rectangles represent ΔTP-pSuT, and orange rectangles represent SUC2. A, 2-NBDG uptake into cells carrying a control vector. The green 2-NBDG-dependent fluorescence fills a broad zone within the cytosol. B, 2-NBDG uptake into cells carrying an expression vector with ΔTP-pSuT. The green 2-NBDG-dependent fluorescence is concentrated in vacuoles. C, Esculin uptake into cells expressing the plasma membrane Suc transporter SUC2 (PM-SUC2). The cyan esculin-dependent fluorescence fills a broad zone within the cytosol. D, Esculin uptake into cells carrying an expression vector with SUC2 (PM-SUC2) plus an expression vector with ΔTP-pSuT. The cyan esculin-dependent fluorescence is concentrated in vacuoles. Bars = 8.45 µm in A and B and 9.5 µm in C and D.
Figure 4.
Figure 4.
Analysis of the tissue-specific and sugar-dependent expression of pSuT. A to I, Transgenic plant lines expressing the glucoronidase reporter gene uidA under the control of the pSuT promoter were subjected to histochemical staining for GUS activity. A and B, GUS staining of germinating seeds. C and D, GUS staining in young seedlings. E, GUS staining in the cotyledons and the vegetative leaves of a 7-d-old seedling. F, GUS staining in rosette leaves of a 3-week-old plant. G, GUS staining of flower buds. H, GUS staining of an inflorescence. I, GUS staining of an opened flower. Bars = 0.5 mm. J, Expression of pSuT is repressed by exogenously supplied sugars. Leaf discs of 6-week-old wild-type plants were incubated in 300 mm Glc, Fru (Frc), Suc, mannitol (Mtl), or solely MES buffer as a reference (−). The data were normalized to the housekeeping genes At4g26410, At1g13320, and At4g05320. Fold change in expression was calculated relative to pSuT expression in MES buffer (set to 1). Data represent means of six biological replicates ± se. Significant differences by one-tailed Student’s t test (***, P ≤ 0.001) are shown in relation to that in the reference sample (−).
Figure 5.
Figure 5.
Carbohydrate levels of pSuT mutant plants. Reduced pSuT expression does not affect total cellular sugar and starch levels of leaves. Wild-type (WT) and pSuT mutant plants were cultivated under standard conditions (120 µE, 10 h of light/14 h of dark). Rosette leaves from 5-week-old plants were harvested at the end of the light phase (about 8 h in light). Carbohydrate levels were determined in leaf tissues from wild-type (dark gray bars), pSuT-kd (gray bars), and pSuT-ko (light gray bars) plants. A, Total cellular Glc, Fru (Frc), and Suc levels. B, Total cellular starch content. Data represent means of at least 14 biological replicates ± se. FW, Fresh weight.
Figure 6.
Figure 6.
Analysis of subcellular sugars after NAF. Reduced pSuT expression affects subcellular sugar distribution. Leaf tissues of 4-week-old wild-type (dark gray bars) and pSuT-ko (light gray bars) plants were subjected to NAF. The distribution of Glc (A), Fru (B), and Suc (C) to chloroplasts (Chl), the cytosol (Cyt), and vacuoles (Vac) is shown. Data are means of nine biological replicates ± se. Significant differences were calculated using one-tailed Student’s t test (*, P ≤ 0.05 and **, P ≤ 0.01).
Figure 7.
Figure 7.
Analysis of the inflorescence development of wild-type (WT) and pSuT mutant plants. A, Determination of differences at the onset of bolting. Wild-type (dark gray bars), pSuT-kd (gray bars), and pSuT-ko (light gray bars) plants were cultivated for 4 weeks under standard conditions (120 µE, 10 h of light/14 h of dark) and transferred to LD conditions (250 µE, 16 h of light/8 h of dark) for flowering induction. When its shoot length reached 1 cm, the corresponding plant was defined as bolted. Data represent means ± se of three replicates with nine or more plants each and are given as percentages of the total number of plants per genotype (set to 100%). B, Plants were cultivated as described in A. Youngest leaves covering the apical meristem were harvested shortly before bolting of the first wild-type plant (when its meristem leaves tended to erect). The relative transcript level of FT in the different genotypes is shown. FT expression in wild-type plants served as a reference (set to 1). Data were normalized to the housekeeping genes At2g28390 and At5g62690. Data represent means of four or more biological replicates ± se. Significant differences compared with the wild type were calculated using one-tailed Student’s t test (**, P ≤ 0.01). C, Representative wild-type, pSuT-kd, and pSuT-ko plants 20 d after their transfer to LD. D, Determination of the total shoot length of wild-type (dark gray diamonds), pSuT-kd (gray diamonds), and pSuT-ko (light gray diamonds) plants after transfer to LD. Data represent means ± se of 29 or more individual plants per line. Significant differences compared with the wild type were calculated using one-tailed Student’s t test (**, P ≤ 0.01 and ***, P ≤ 0.001).
Figure 8.
Figure 8.
Analysis of siliques from wild-type (WT), pSuT-kd, and pSuT-ko plants. A and B, Analyses discriminated between young siliques (top part of the shoot), middle-aged siliques (middle part), and mature siliques (bottom part). For silique weight (A) and length (B) determination, five siliques of 29 or more plants were analyzed. Because of delayed bolting, pSuT-kd was analyzed 1 d and pSuT-ko was analyzed 2 d later than the wild type. C, Quantification of 1,000 seed weight was performed with 10 samples of seeds from two independent pools of at least 20 plants. D, Determination of the seed number per silique was performed with 70 or more siliques from five individual plants. Data represent means ± se. Significant differences compared with the wild type were calculated using one-tailed Student’s t test (*, P ≤ 0.05; **, P ≤ 0.01; and ***, P ≤ 0.001).
Figure 9.
Figure 9.
pSuT mutant plants exhibit fewer inflorescence stems than the wild type (WT). A, Representative images of 8-week-old wild-type, pSuT-kd, and pSuT-ko plants. B, Number of stems at the end of flowering. Because of the delay in bolting, pSuT-kd was analyzed 1 d and pSuT-ko was analyzed 2 d later than the wild type (34 d after transfer to LD). Data represent means ± se of 29 or more individual plants per line. Significant differences compared with the wild type were calculated using one-tailed Student’s t test (***, P ≤ 0.001).
Figure 10.
Figure 10.
pSuT is required for maximal freezing tolerance. A and B, Analysis of cold-associated changes in pSuT transcript levels. The transcript level of plants cultivated at 22°C served as a reference (set to 1). Data were normalized to the expression of the housekeeping genes At5g08290 and At1g13320 and represent means of four biological replicates ± se. Significance differences were calculated using one-factor ANOVA (**, P ≤ 0.01). A, Analysis of pSuT transcript levels of wild-type plants cultivated for 4 weeks at 22°C under short-day conditions, then at 4°C for 24 h under short-day conditions. B, Analysis of pSuT transcript levels of wild-type plants cultivated for 4 weeks at 22°C, then at 4°C for 24 h in the dark. C, Sugar levels in 4-week-old rosette leaves of wild-type (dark gray bars), pSUT-kd (gray bars), and pSuT-ko (light gray bars) plants after exposure to cold (4°C, short-day conditions) for 24 h. Frc, Fru. Data are means from 10 plants per line ± se. Significant differences compared with the wild type were calculated using one-tailed Student’s t test (*, P ≤ 0.05). D, Analysis of the electrolyte leakage from leaves of wild-type (dark gray bars), pSuT-kd (gray bars), and pSuT-ko (light gray bars) plants after 4 d of cold (4°C) acclimation. Electrolyte leakage from mutant plant leaves was normalized to leakage from wild-type leaves (set to 100%). Data represent means of at least 18 biological replicates ± se. Significant differences compared with the wild type were calculated using one-tailed Student’s t test (*, P ≤ 0.05 and **, P ≤ 0.01).

Similar articles

Cited by

References

    1. Alberdi M, Corcuera LJ (1991) Cold acclimation in plants. Phytochemistry 30: 3177–3184
    1. Aluri S, Büttner M (2007) Identification and functional expression of the Arabidopsis thaliana vacuolar glucose transporter 1 and its role in seed germination and flowering. Proc Natl Acad Sci USA 104: 2537–2542 - PMC - PubMed
    1. An YQ, Huang S, McDowell JM, McKinney EC, Meagher RB (1996) Conserved expression of the Arabidopsis ACT1 and ACT3 actin subclass in organ primordia and mature pollen. Plant Cell 8: 15–30 - PMC - PubMed
    1. Arnon DI. (1949) Copper enzymes in isolated chloroplasts: Polyphenoloxidase in Beta vulgaris. Plant Physiol 24: 1–15 - PMC - PubMed
    1. Arrivault S, Guenther M, Florian A, Encke B, Feil R, Vosloh D, Lunn JE, Sulpice R, Fernie AR, Stitt M, et al. (2014) Dissecting the subcellular compartmentation of proteins and metabolites in Arabidopsis leaves using non-aqueous fractionation. Mol Cell Proteomics 13: 2246–2259 - PMC - PubMed

Publication types

MeSH terms

LinkOut - more resources