

Dynamic control of endogenous metabolism with combinatorial logic circuits
- PMID: 30482789
- PMCID: PMC6263354
- DOI: 10.15252/msb.20188605
Dynamic control of endogenous metabolism with combinatorial logic circuits
Abstract
Controlling gene expression during a bioprocess enables real-time metabolic control, coordinated cellular responses, and staging order-of-operations. Achieving this with small molecule inducers is impractical at scale and dynamic circuits are difficult to design. Here, we show that the same set of sensors can be integrated by different combinatorial logic circuits to vary when genes are turned on and off during growth. Three Escherichia coli sensors that respond to the consumption of feedstock (glucose), dissolved oxygen, and by-product accumulation (acetate) are constructed and optimized. By integrating these sensors, logic circuits implement temporal control over an 18-h period. The circuit outputs are used to regulate endogenous enzymes at the transcriptional and post-translational level using CRISPRi and targeted proteolysis, respectively. As a demonstration, two circuits are designed to control acetate production by matching their dynamics to when endogenous genes are expressed (pta or poxB) and respond by turning off the corresponding gene. This work demonstrates how simple circuits can be implemented to enable customizable dynamic gene regulation.
Keywords: control theory; feedback; metabolic engineering; synthetic biology.
© 2018 The Authors. Published under the terms of the CC BY 4.0 license.
Figures
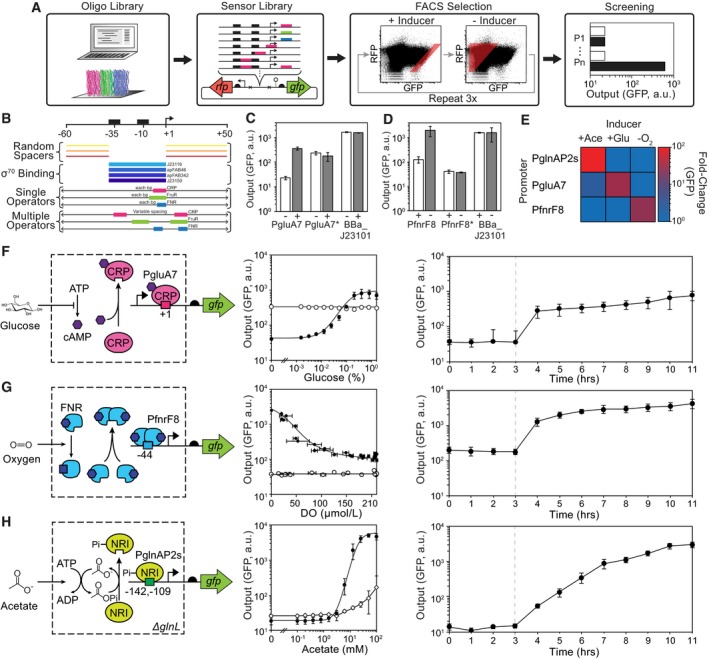
- A
Scheme for sensor design including (left to right): computational design and DNA chip oligo library synthesis, insertion into a plasmid reporter, FACS enrichment, and screening of select mutants in the presence (black) and absence (white) of stimulus. All three sensors were synthesized on a single chip (indicated by the colors).
- B
Design of the promoter library. The location, number, and name of promoter elements are shown. The permutations included different constitutive core promoters (blue) flanked by random spacers (orange). Single operators (colored bars) were varied across the ranges shown with single nucleotide resolution. When two operators were included, they were inserted at multiple sites and the distance between them was varied by up to 6 bp from each site.
- C
Shown are the responses of the glucose sensor promoter (PgluA7), a negative control lacking the CRP operator (PgluA7*), and a constitutive promoter (BBa_J23101) to the presence (+) and absence (−) of glucose.
- D
Shown are the responses of the oxygen sensor promoter (PfnrF8), a negative control lacking the FNR operator (PfnrF8*), and a constitutive promoter (BBa_J23101) to the presence (+) and absence (−) of oxygen.
- E
The orthogonality of the sensors is shown. The averages and standard deviations for these data are provided in Appendix Fig S5.
- F–H
Shown are the schematics and responses for the glucose, oxygen, and acetate sensors, respectively. The response functions (center) are shown for each sensor (black circles) compared to promoter variants where the operators are removed (PgluA7*, PfnrF8*; open circles). Horizontal error bars in the PfnrF8 response reflect one standard deviation of three dissolved oxygen (DO) measurements. For the acetate sensor, the response of the sensor is shown in unmodified Escherichia coli MG1655 with glnL intact (open diamonds). The dynamics of induction are shown (right graph) where cells are induced at the time indicated by the dashed line (see text). Representative cytometry florescence distributions for Fig 1F–H are shown in Appendix Fig S2.
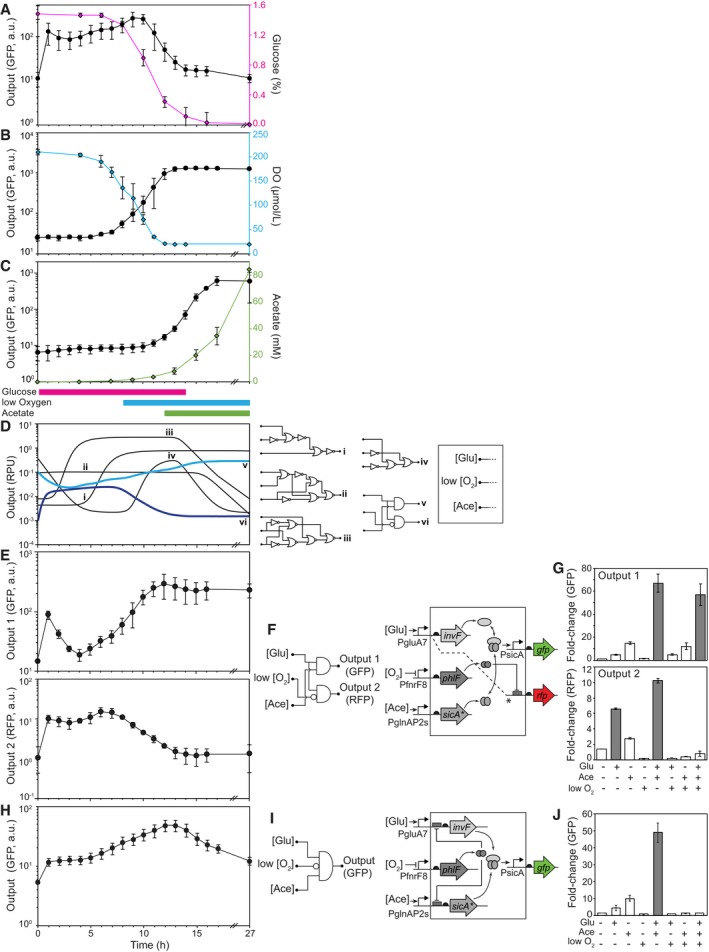
- A–C
The responses of the glucose, oxygen, and acetate sensors during growth in shake flasks are shown. The colored lines (right axes) correspond to the measured changes in the stimuli (Materials and Methods). The colored bars under (C) show the times when the output promoter of each sensor should be on, based on the response functions shown in Fig 1.
- D
Simulations of circuit dynamics. Examples of different characteristic responses are shown, selected from the full set of simulated circuits (Appendix Fig S8). The lines shown in bold blue colors correspond to those circuits experimentally tested. The simulated output promoter activities are in relative promoter units (RPU; Nielsen et al, 2016).
- E
The responses of a 3‐input, 2‐output circuit are shown.
- F
Shown are the circuit (left) and genetic diagram (right) of the circuit corresponding to (E). In the genetic diagram, the dashed line and * indicates a second copy of the PgluA7 promoter that drives rfp expression and is repressed by PhlF via an immediately downstream PhlF operator.
- G
The response of the circuit in (E, F) to different combinations of stimuli under the same conditions as Fig 1 (Materials and Methods). The (+) and (−) indicate whether the output promoter of each sensor is active under those conditions. Bars where the circuit is predicted to be on are shown in gray and white when predicted to be off.
- H
The response of a 3‐input 1‐output circuit is shown.
- I
Shown are the circuit (left) and genetic diagram (right) of the circuit corresponding to (H).
- J
The response of the circuit in (H, I) to different combinations of stimuli under the same conditions as Fig 1 (Materials and Methods).
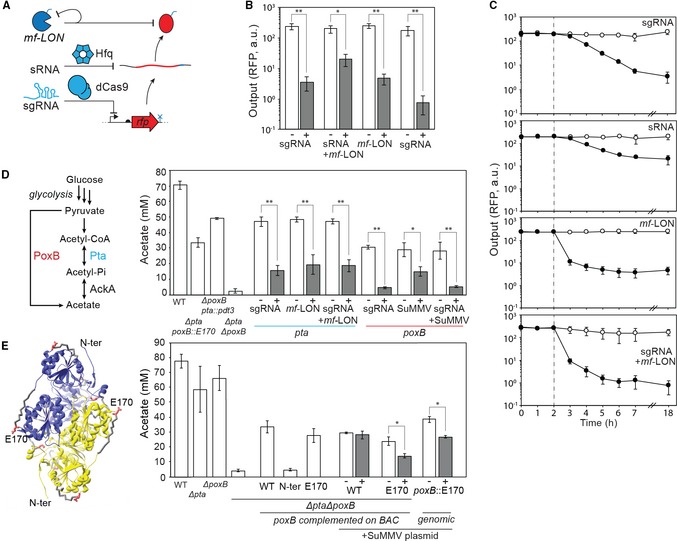
Schematic showing three levels of repression. A small guide RNA (sgRNA) directs deactivated Cas9 (dCas9) to block transcription from a promoter. sRNA binds to the mRNA and promotes degradation by recruiting Hfq. The mf‐Lon protease targets a tag (blue) added to the protein. The protease is also targeted to itself to reduce toxicity (Materials and Methods).
Reduction of fluorescence of RFP by the different mechanisms of repression after 18 h of growth (Materials and Methods). The inducers are either 1 mM IPTG (sRNA) or 25 μM DAPG (sgRNA, mf‐LON). sgRNA and mf‐LON are co‐transcribed on a single transcript that is processed by ribozymes (Appendix Fig S13).
The dynamics of repression by each of the mechanisms is shown. Empty circles are uninduced and black circles are induced (1 mM IPTG or 25 μM DAPG) at the 2‐h time point (dashed line; Materials and Methods).
Metabolic pathways to acetate in Escherichia coli are shown along with the targeted enzymes. The impact of either knocking out these enzymes or knocking them down by the various mechanisms after 20 h is shown. On the left of the graph are shown empty strains containing either no acetate pathway modifications (WT; MG1655∆glnL), a double deletion (∆pta∆poxB), or single knockouts and protease tag modifications (∆poxB pta::pdt3, ∆pta poxB::E170). On the right are shown knockdowns of pta (blue) and poxB (red), tested in strains ∆poxB pta::pdt3 and ∆pta poxB::E170, respectively. Knockdowns are generated by expression of sgRNA, proteases, or both mechanisms encoded on a single transcript.
Design of a PoxB mutant that can be targeted by the SuMMV protease. The structure of PoxB is shown (PDB: 3ey9; Neumann et al, 2008), highlighting the amino acid sites selected for degron insertion (in red). The impact on acetate production of different acetate pathway mutants is shown on the left of the graph. On the right of the graph, a double knockout mutant (ΔptaΔpoxB) contains variants of poxB expressed from a BAC. Note that complementation of unmodified poxB (WT) from the BAC does not fully reconstitute acetate production. N‐ter and E170 refer to the location of the SuMMV degron tag in poxB. A plasmid expressing protease SuMMV from a DAPG‐inducible promoter was also introduced into strains containing poxB variants WT and E170 complemented on a BAC and a strain poxB with an E170 site replacement on the genome (poxB::E170). The graph shows the acetate produced in these strains when either no inducer (white) or 25 μM DAPG (grey) is added to the culture.
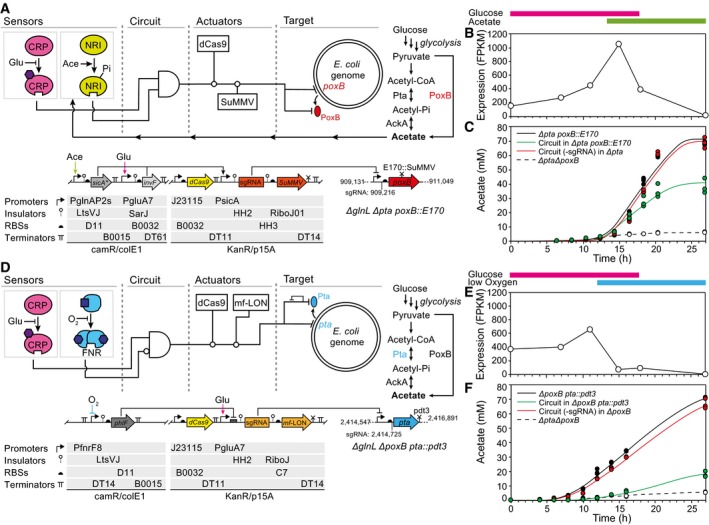
The genetic circuit designed to control poxB is shown. The strain genotype is shown, including the positions targeted by the sgRNA and the SuMMV protease.
The transcription of poxB over time (Escherichia coli MG1655∆glnL), as calculated from RNA‐seq data (Materials and Methods). The colored bars indicate the times at which the glucose/acetate sensors will be on based on metabolite measurements. It should be noted that these are right‐shifted compared to Fig 2 due to slower growth of the tested strains.
The production of acetate is shown over time for E. coli MG1655∆glnL∆pta poxB::E170 (black) as compared to the same strain containing the complete circuit (green). A version of the circuit in which the sgRNA is targeted to rfp (not present in the system) and is tested in MG1655∆glnL∆pta (containing an untagged poxB) is shown as a control (red). Empty circles connected by the dashed line represent MG1655∆glnL∆pta∆poxB.
The genetic circuit design to control pta is shown.
The transcription of pta over time (E. coli MG1655∆glnL), as calculated from RNA‐seq data (Materials and Methods). The colored bars indicate the times at which the glucose/oxygen sensors will be on based on metabolite measurements.
The production of acetate is shown over time for E. coli MG1655∆glnL∆poxB pta::pdt3 as compared to a strain containing the complete circuit (green) tested in same strain. A version of the circuit in which the sgRNA is targeted to rfp (not present in the system) and is tested in MG1655∆glnL∆poxB (containing an untagged pta) is shown as a control (red). Empty circles connected by the dashed line represent MG1655ΔglnLΔptaΔpoxB.
References
-
- Anesiadis N, Kobayashi H, Cluett WR, Mahadevan R (2013) Analysis and design of a genetic circuit for dynamic metabolic engineering. ACS Synth Biol 2: 442–452 - PubMed
-
- Bachmair A, Finley D, Varshavsky A (1986) In vivo half‐life of a protein is a function of its amino‐terminal residue. Science 234: 179–186 - PubMed
Publication types
MeSH terms
Substances
LinkOut - more resources
Full Text Sources
Other Literature Sources
Research Materials
