

Dosage Compensation and Gene Expression of the X Chromosome in Sheep
- PMID: 30482800
- PMCID: PMC6325915
- DOI: 10.1534/g3.118.200815
Dosage Compensation and Gene Expression of the X Chromosome in Sheep
Abstract
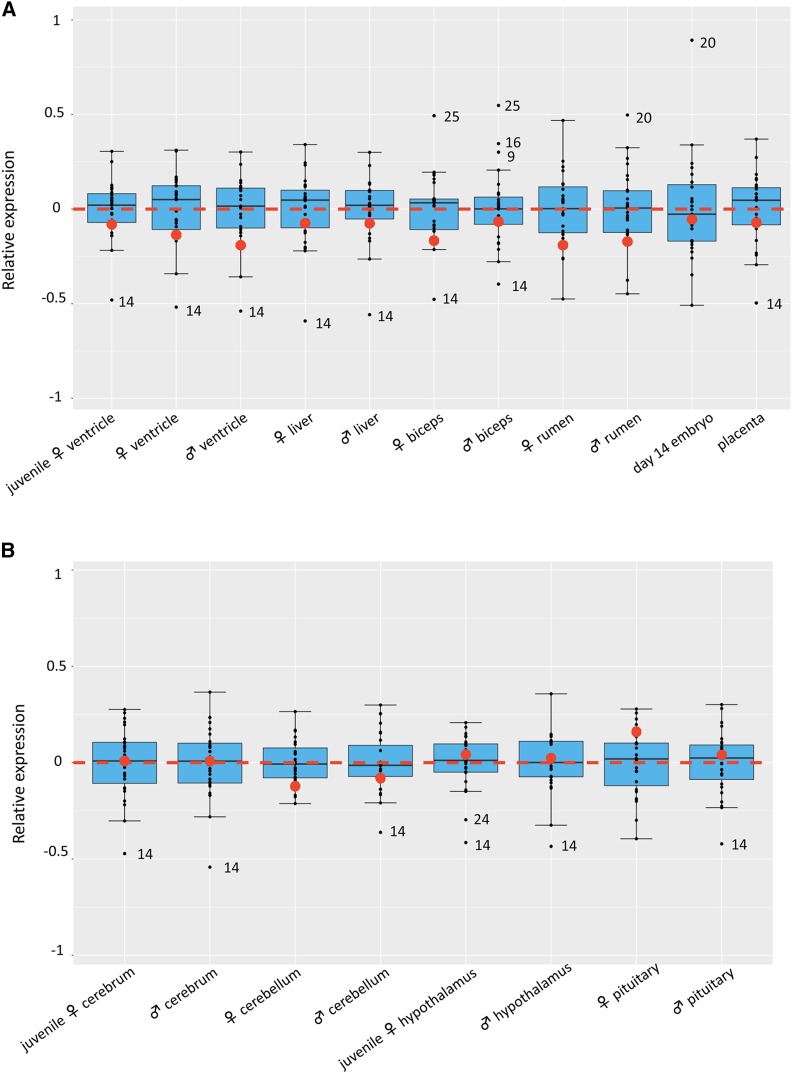
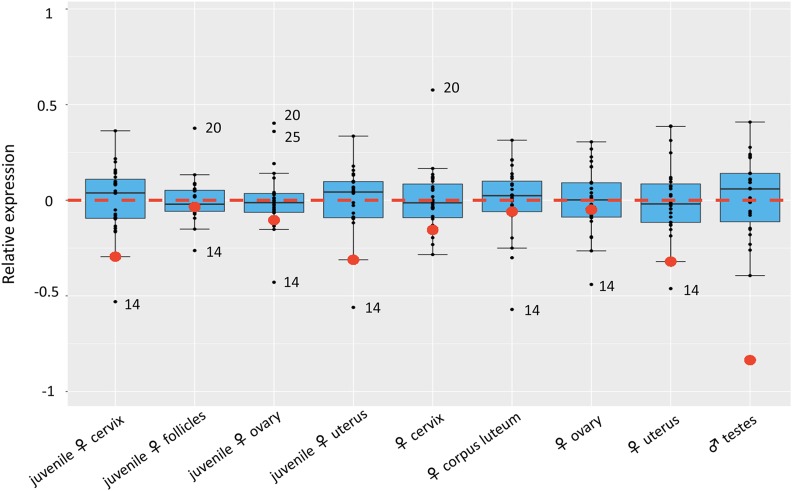
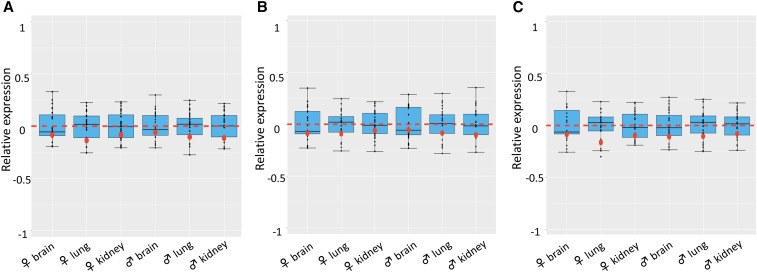
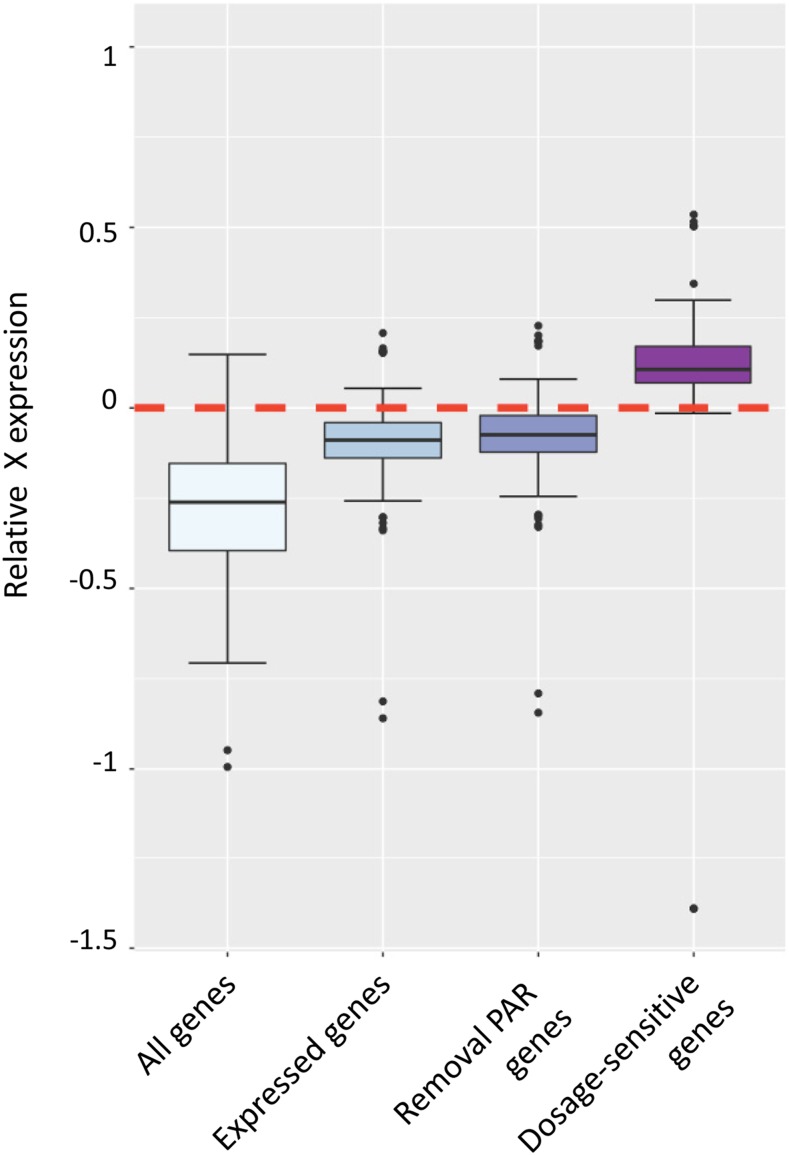
Ohno's hypothesis predicts that the expression of the single X chromosome in males needs compensatory upregulation to balance its dosage with that of the diploid autosomes. Additionally, X chromosome inactivation ensures that quadruple expression of the two X chromosomes is avoided in females. These mechanisms have been actively studied in mice and humans but lag behind in domestic species. Using RNA sequencing data, we analyzed the X chromosome upregulation in sheep fetal tissues from day 135 of gestation under control, over or restricted maternal diets (100%, 140% and 60% of National Research Council Total Digestible Nutrients), and in conceptuses, juvenile, and adult somatic tissues. By computing the mean expression ratio of all X-linked genes to all autosomal genes (X:A), we found that all samples displayed some levels of X chromosome upregulation. The degrees of X upregulation were not significant (P-value = 0.74) between ovine females and males in the same somatic tissues. Brain, however, displayed complete X upregulation. Interestingly, the male and female reproduction-related tissues exhibited divergent X dosage upregulation. Moreover, expression upregulation of the X chromosome in fetal tissues was not affected by maternal diets. Maternal nutrition, however, did change expression levels of several X-linked genes, such as sex determination genes SOX3 and NR0B1 In summary, our results showed that X chromosome upregulation occurred in nearly all sheep somatic tissues analyzed, thus support Ohno's hypothesis in a new species. However, the levels of upregulation differed by different subgroups of genes such as those that are house-keeping and "dosage-sensitive".
Keywords: Maternal nutrition; Ohno’s hypothesis; Ovine; X chromosome upregulation.
Copyright © 2019 by the Genetics Society of America.
Figures
Similar articles
-
Expression reduction in mammalian X chromosome evolution refutes Ohno's hypothesis of dosage compensation.Proc Natl Acad Sci U S A. 2012 Jul 17;109(29):11752-7. doi: 10.1073/pnas.1201816109. Epub 2012 Jul 2. Proc Natl Acad Sci U S A. 2012. PMID: 22753487 Free PMC article.
-
No X-chromosome dosage compensation in human proteomes.Mol Biol Evol. 2015 Jun;32(6):1456-60. doi: 10.1093/molbev/msv036. Epub 2015 Feb 19. Mol Biol Evol. 2015. PMID: 25697342 Free PMC article.
-
RNA sequencing shows no dosage compensation of the active X-chromosome.Nat Genet. 2010 Dec;42(12):1043-7. doi: 10.1038/ng.711. Nat Genet. 2010. PMID: 21102464
-
The evolution of X chromosome inactivation in mammals: the demise of Ohno's hypothesis?Cell Mol Life Sci. 2014 Apr;71(8):1383-94. doi: 10.1007/s00018-013-1499-6. Epub 2013 Oct 31. Cell Mol Life Sci. 2014. PMID: 24173285 Free PMC article. Review.
-
Role and control of X chromosome dosage in mammalian development.Curr Opin Genet Dev. 2013 Apr;23(2):109-15. doi: 10.1016/j.gde.2013.01.008. Epub 2013 Mar 4. Curr Opin Genet Dev. 2013. PMID: 23465885 Review.
Cited by
-
Variation in TAF1 expression in female carrier induced pluripotent stem cells and human brain ontogeny has implications for adult neostriatum vulnerability in X-linked Dystonia Parkinsonism.eNeuro. 2022 Jul 21;9(4):ENEURO.0129-22.2022. doi: 10.1523/ENEURO.0129-22.2022. Online ahead of print. eNeuro. 2022. PMID: 35868859 Free PMC article.
-
Transcriptomics of Tasmanian Devil (Sarcophilus Harrisii) Ear Tissue Reveals Homogeneous Gene Expression Patterns across a Heterogeneous Landscape.Genes (Basel). 2019 Oct 12;10(10):801. doi: 10.3390/genes10100801. Genes (Basel). 2019. PMID: 31614864 Free PMC article.
-
De novo transcriptome reveals blood coagulation/antithrombin factors and infection mechanisms in Angiostrongylus cantonensis adult worms.Parasitology. 2021 Jun;148(7):857-870. doi: 10.1017/S0031182021000469. Epub 2021 Mar 17. Parasitology. 2021. PMID: 33729108 Free PMC article.
-
TAF4b transcription networks regulating early oocyte differentiation.Development. 2022 Feb 1;149(3):dev200074. doi: 10.1242/dev.200074. Epub 2022 Feb 9. Development. 2022. PMID: 35043944 Free PMC article.
-
Dissection of X chromosome dosage compensation for quantitative traits in sheep using different statistical models.Sci Rep. 2024 Dec 5;14(1):30361. doi: 10.1038/s41598-024-77060-y. Sci Rep. 2024. PMID: 39638809 Free PMC article.
References
-
- Andrews S., 2010. FastQC A Quality Control tool for High Throughput Sequence Data. http://www.bioinformatics.babraham.ac.uk/projects/fastqc/.
Publication types
MeSH terms
Associated data
LinkOut - more resources
Full Text Sources
Molecular Biology Databases