. 2018 Nov 27;9(6):e01765-18.
doi: 10.1128/mBio.01765-18.

Mycobacterium tuberculosis Type VII Secretion System Effectors Differentially Impact the ESCRT Endomembrane Damage Response

Affiliations

Mycobacterium tuberculosis Type VII Secretion System Effectors Differentially Impact the ESCRT Endomembrane Damage Response

Ekansh Mittal et al. mBio. .

Abstract

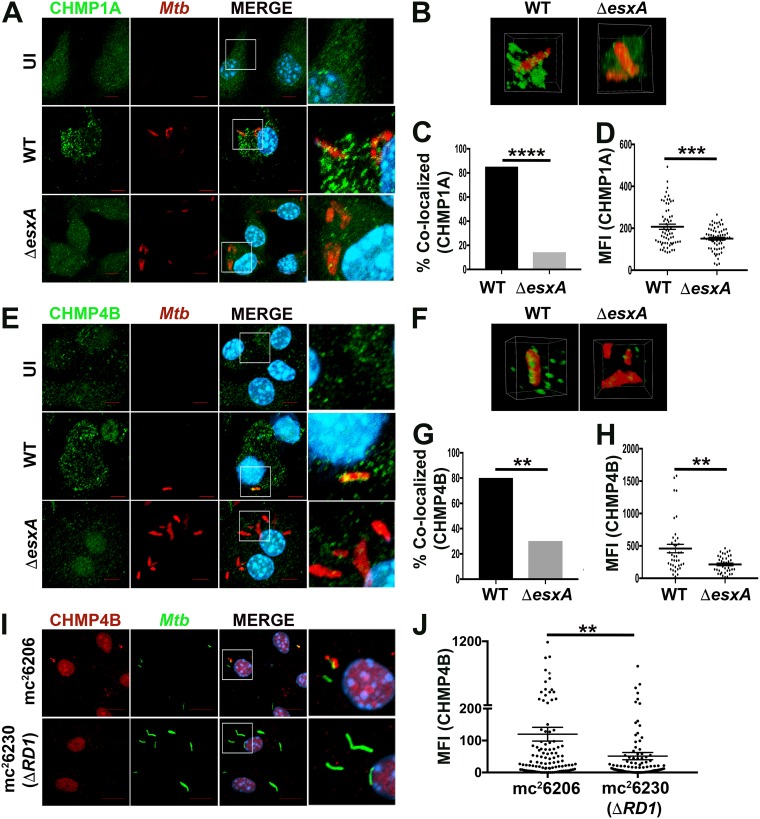
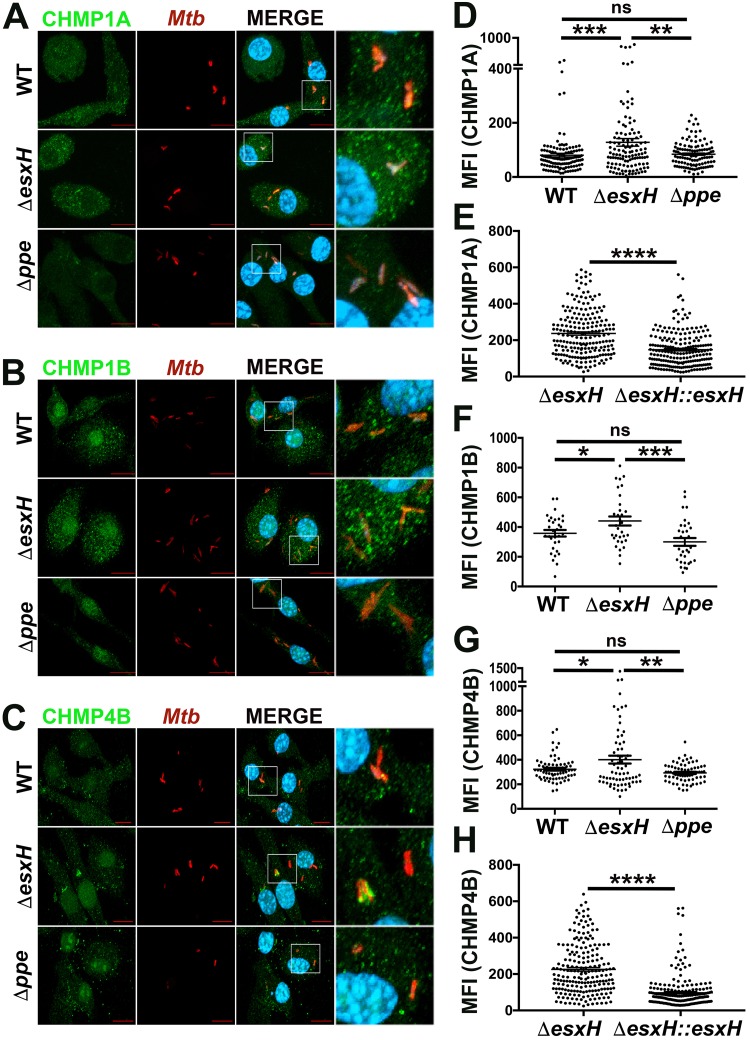
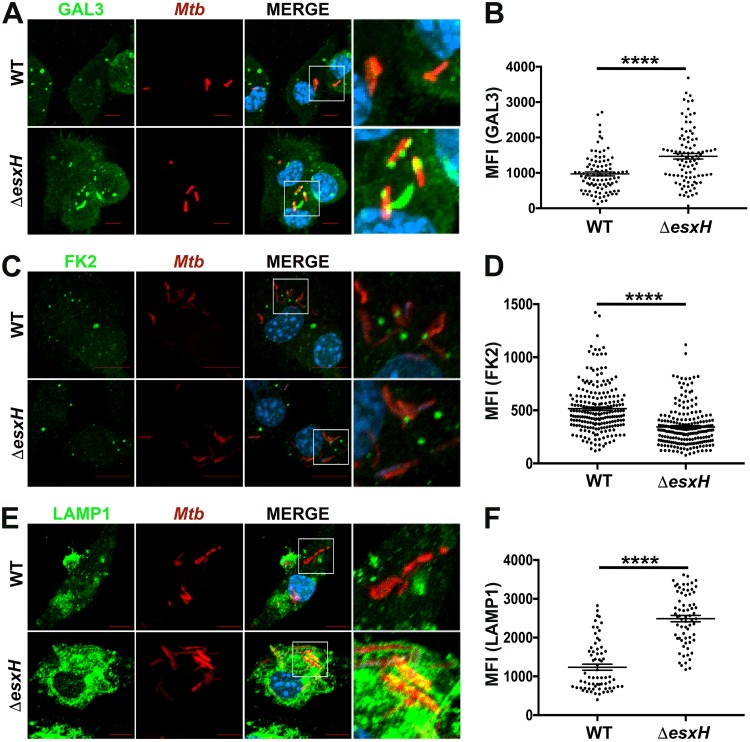
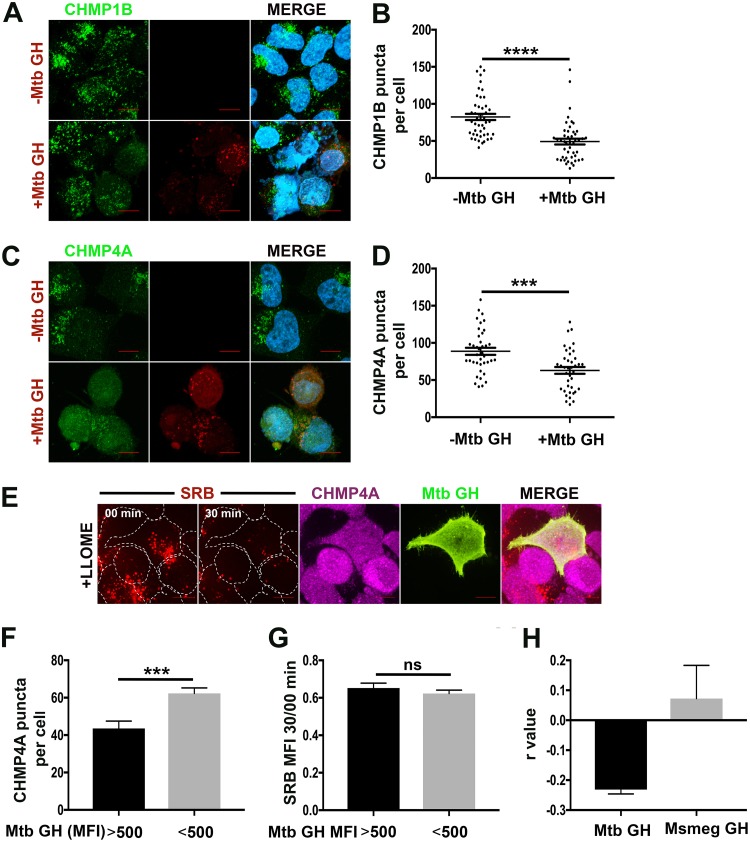
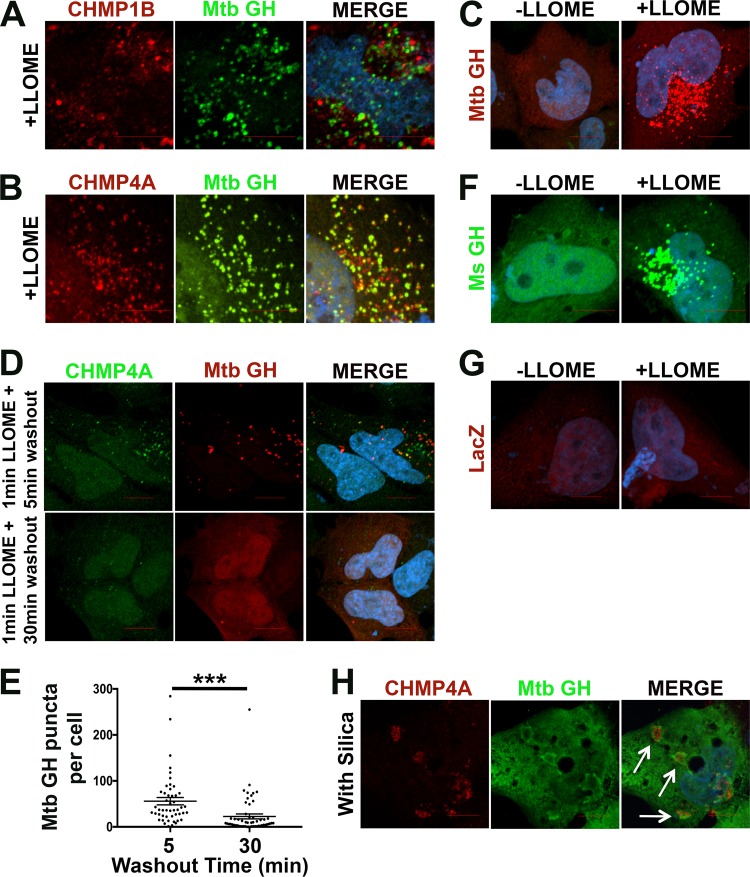
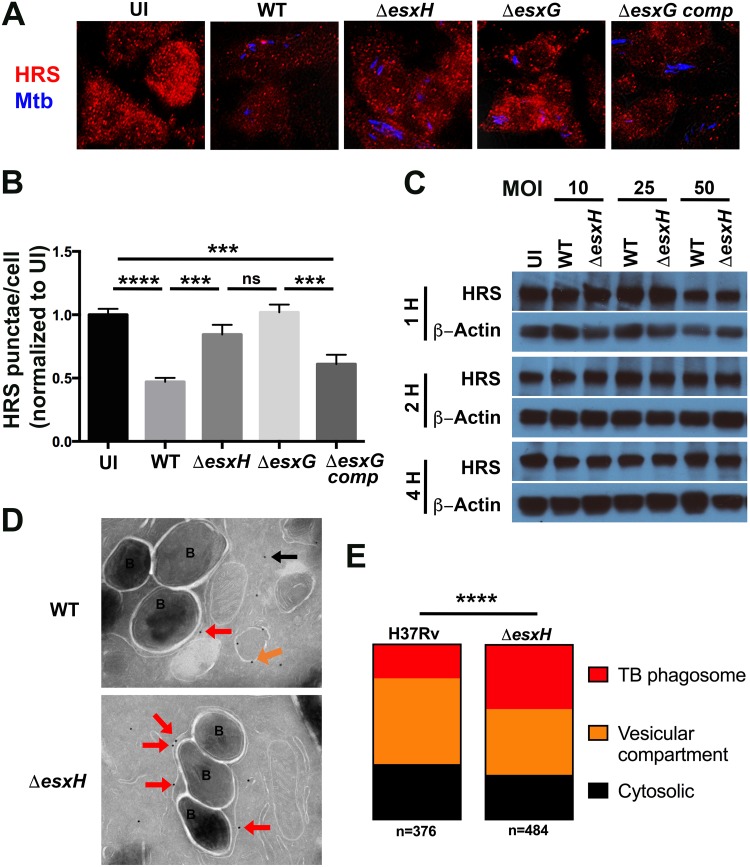
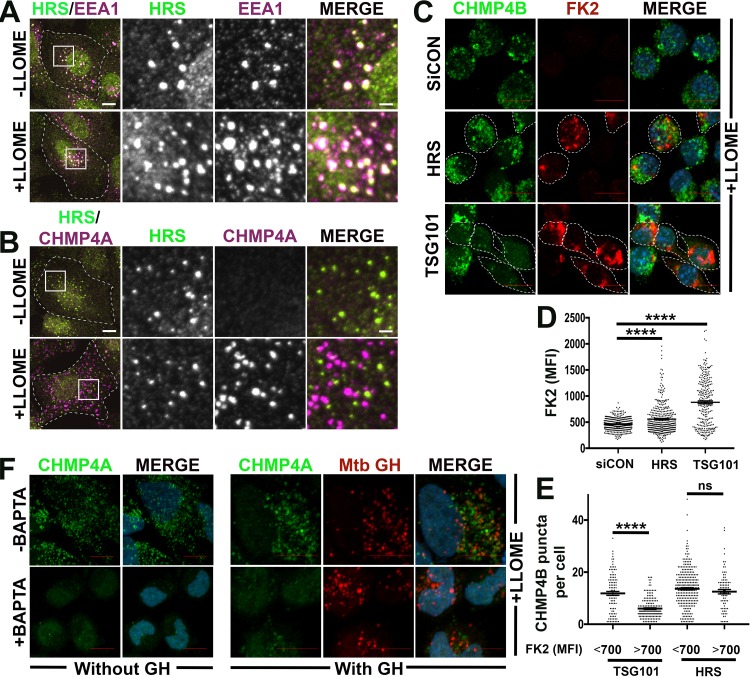
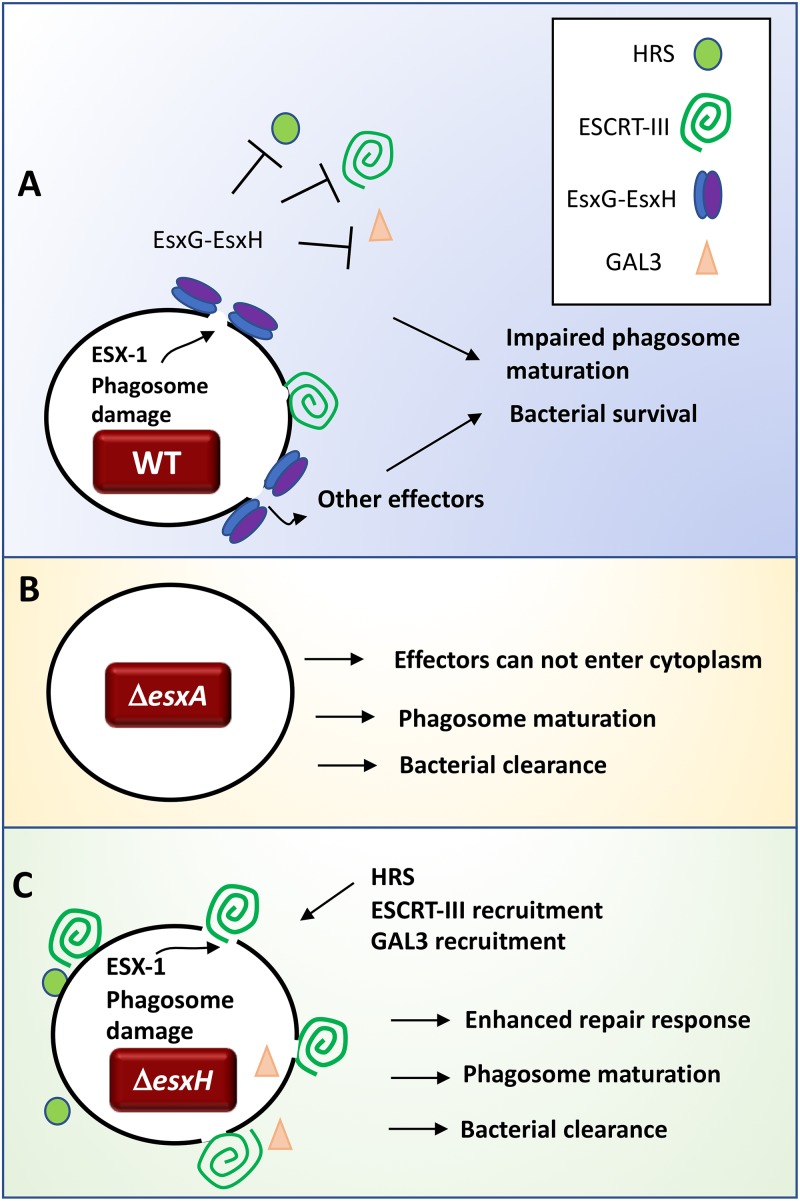
Intracellular pathogens have varied strategies to breach the endolysosomal barrier so that they can deliver effectors to the host cytosol, access nutrients, replicate in the cytoplasm, and avoid degradation in the lysosome. In the case of Mycobacterium tuberculosis, the bacterium perforates the phagosomal membrane shortly after being taken up by macrophages. Phagosomal damage depends upon the mycobacterial ESX-1 type VII secretion system (T7SS). Sterile insults, such as silica crystals or membranolytic peptides, can also disrupt phagosomal and endolysosomal membranes. Recent work revealed that the host endosomal sorting complex required for transport (ESCRT) machinery rapidly responds to sterile endolysosomal damage and promotes membrane repair. We hypothesized that ESCRTs might also respond to pathogen-induced phagosomal damage and that M. tuberculosis could impair this host response. Indeed, we found that ESCRT-III proteins were recruited to M. tuberculosis phagosomes in an ESX-1-dependent manner. We previously demonstrated that the mycobacterial effectors EsxG/TB9.8 and EsxH/TB10.4, both secreted by the ESX-3 T7SS, can inhibit ESCRT-dependent trafficking of receptors to the lysosome. Here, we additionally show that ESCRT-III recruitment to sites of endolysosomal damage is antagonized by EsxG and EsxH, both within the context of M. tuberculosis infection and sterile injury. Moreover, EsxG and EsxH themselves respond within minutes to membrane damage in a manner that is independent of calcium and ESCRT-III recruitment. Thus, our study reveals that T7SS effectors and ESCRT participate in a series of measures and countermeasures for control of phagosome integrity.IMPORTANCEMycobacterium tuberculosis causes tuberculosis, which kills more people than any other infection. M. tuberculosis grows in macrophages, cells that specialize in engulfing and degrading microorganisms. Like many intracellular pathogens, in order to cause disease, M. tuberculosis damages the membrane-bound compartment (phagosome) in which it is enclosed after macrophage uptake. Recent work showed that when chemicals damage this type of intracellular compartment, cells rapidly detect and repair the damage, using machinery called the endosomal sorting complex required for transport (ESCRT). Therefore, we hypothesized that ESCRT might also respond to pathogen-induced damage. At the same time, our previous work showed that the EsxG-EsxH heterodimer of M. tuberculosis can inhibit ESCRT, raising the possibility that M. tuberculosis impairs this host response. Here, we show that ESCRT is recruited to damaged M. tuberculosis phagosomes and that EsxG-EsxH undermines ESCRT-mediated endomembrane repair. Thus, our studies demonstrate a battle between host and pathogen over endomembrane integrity.

Keywords: ESCRT; Mycobacterium tuberculosis; endomembrane damage; phagosomes; type VII secretion system.


Figures

FIG 1
FIG 1
ESCRT-III is recruited to M. tuberculosis (Mtb) phagosomes in an esxA-dependent manner. (A, E, and I) Immunofluorescence (IF) images of CHMP1A (A) and CHMP4B (E and I) in BMDMs that were uninfected (UI) or infected with PKH-labeled H37Rv (WT) or the ΔesxA mutant or GFP-expressing mc26206 or mc26230 (ΔRD1) for 3 h. Images are maximum-intensity projections. Scale bar, 10 μm. Boxed areas in the merged image are shown in higher magnification in the rightmost panel. (B and F) Three-dimensional renderings of individual bacilli, which are also shown in Movies S1 to S4. (C and G) The percentages of bacteria in CHMP1A- and CHMP4B-positive phagosomes were quantified from over 100 bacteria by an individual blind to sample identity (****, P ≤ 0.0001 for CHMP1A, and **, P ≤ 0.0079 for CHMP4B, Fisher's exact test). Automated image analysis was used to quantify the mean fluorescence intensity (MFI) of CHMP1A (D) and CHMP4B (H and J) colocalized with individual bacilli from 5 fields from a 12-mm coverslip. Data are means ± SEM from one representative experiment of three for H37Rv strains or two independent experiments for mc26206 and mc26230. *, P ≤ 0.05, **, P ≤ 0.01, and ***, P ≤ 0.001, Student's t test.
FIG 2
FIG 2
EsxH antagonizes ESCRT-III recruitment. (A, B, and C) IF images of CHMP1A (A), CHMP1B (B), and CHMP4B (C) with DsRed-expressing H37Rv or ΔesxH and Δpe5-ppe4ppe) mutants 3 hpi in BMDMs. Images are maximum-intensity projections. Scale bar, 10 μm. Boxed areas in the merged image are shown in higher magnification in the rightmost panel. Mtb, M. tuberculosis. (D to H) Automated image analysis was used to quantify the MFI of CHMP1A (D and E), CHMP1B (F), and CHMP4B (G and H) colocalized with individual bacilli in 5 fields from a 12-mm coverslip. In panels E and H, BMDMs were infected with the PKH-labeled ΔesxH or ΔesxH::esxH mutant for 3 h. Data are means ± SEM from one representative experiment from three (for the WT and ΔesxH mutant in panels A to D, F, and G and the Δpe5-ppe4 mutant in panels A, C, D, and G) or two (for panels E and H and the Δpe5-ppe4 mutant in panels B and F) independent experiments. *, P ≤ 0.05, **, P ≤ 0.01, ***, P ≤ 0.001, and ****, P ≤ 0.0001, Student’s t test. ns, not significant.
FIG 3
FIG 3
EsxG-EsxH alters phagosomal GAL3, ubiquitin, and LAMP1. (A, C, and E) IF images of GAL3 (A), ubiquitin (FK2 antibody) (C), and LAMP1 (E) in BMDMs that were infected with DsRed-expressing H37Rv (WT) or the ΔesxH mutant for 3 h. Images are maximum-intensity projections. Scale bar, 10 μm. Boxed areas in the merged image are shown in higher magnification in the rightmost panel. Mtb, M. tuberculosis. (B, D, and F) Automated image analysis was used to quantify the MFI of GAL3 (B), ubiquitin (D), and LAMP1 (F) colocalized with individual bacilli from 5 fields of a 12-mm coverslip. Data are means ± SEM from one representative experiment from three (A, B, E, and F) or two (C and D) independent experiments. ****, P ≤ 0.0001, Student's t test.
FIG 4
FIG 4
EsxG-EsxH impairs ESCRT-III recruitment to damaged lysosomes. (A and C) HeLa cells transfected with M. tuberculosis (Mtb) EsxG-EsxH (GH) or the vector control were treated with LLOME or the solvent control and stained for CHMP1B (A) or CHMP4A (C). ESCRT-III and EsxG-EsxH are shown in green and red, respectively. EsxG-EsxH was visualized with an anti-EsxG-EsxH monoclonal antibody. (B and D) Automated image analysis was used to quantify the number of CHMP1B (A) or CHMP4A (B) punctae on 30 macrophages per sample. Data are means ± SEM from one representative experiment from at least three independent experiments. ***, P ≤ 0.001, and ****, P ≤ 0.0001, Student's t test. (E) HeLa cells were transfected with Mtb EsxG-EsxH and loaded with SRB. Live-cell imaging was used to visualize SRB before and after addition of LLOME, after which cells were fixed and stained to visualize EsxG-EsxH (green) and CHMP4A (magenta). Image panels of representative cells are shown at the times indicated from each recording. Individual cells are outlined by white dashed lines. Images are maximum-intensity projections. Scale bars, 10 µm. (F and G) Automated image analysis was used to quantify the number of CHMP4A punctae, the reduction in SRB signal, and the MFI of EsxG-EsxH on a per cell basis. The number of CHMP4A punctae and the reduction is SRB signal were compared in cells with an EsxG-EsxH MFI greater than and less than 500. Data are means ± SEM from one representative experiment from at least three independent experiments. ***, P ≤ 0.001, Student’s t test. ns, not significant. (H) HeLa cells transfected with Mtb or M. smegmatis (Msmeg) EsxG-EsxH were treated with LLOME, and CHMP4A and EsxG-EsxH were visualized. Automated image analysis was used to quantify the EsxG-EsxH MFI and the number of CHMP4A punctae in individual cells. The correlation between EsxG-EsxH expression and number of CHMP4A punctae is shown (R value). Data are means ± SEM from four independent experiments in which at least 100 cells were evaluated.
FIG 5
FIG 5
EsxG-EsxH relocalizes in response to membrane damage. HeLa cells transfected with M. tuberculosis (Mtb) EsxG-EsxH were treated with LLOME, and CHMP1B (A) or CHMP4A (B) (red) and EsxG-EsxH (green) was visualized by IF. (C) HeLa cells expressing Mtb EsxG-EsxH were treated with LLOME or the solvent control for 2.5 min. EsxG-EsxH is shown in red. (D) HeLa cells expressing Mtb EsxG-EsxH were treated with LLOME for 1.0 min and then incubated in excess LLOME-free medium for 5 to 30 min as indicated and stained for CHMP4A (green) and EsxG-EsxH (red). (E) Automated image analysis was used to quantify the number of CHMP4A punctae on 30 macrophages per sample from panel D. Data are means ± SEM from one representative experiment from at least two independent experiments. ***, P ≤ 0.001, Student's t test. (F and G) HeLa cells expressing Ms EsxG-EsxH (green) (F) or LacZ (vector control [red]) (G) were treated with LLOME or the solvent control. (H) U2OS cells transfected with Mtb EsxG-EsxH were treated with silica (SiO2) nanoparticles for 15 min and stained for CHMP4A (red) and EsxG-EsxH (green). White arrows indicate the silica nanoparticles. (A to H) Both EsxG-EsxH and LacZ were detected with anti-V5 antibody. Nuclei were stained with DAPI. Images are maximum-intensity projections. Scale bar 10 μm.
FIG 6
FIG 6
EsxG-EsxH alters HRS localization during infection. (A) BMDMs were uninfected (UI) or infected with H37Rv (WT), the ΔesxH or ΔesxG mutant, or the ΔesxG complemented strain for 3 h, and HRS was examined by IF. Mtb, M. tuberculosis. (B) The number of HRS punctae was quantified. Data are means ± SEM from three independent experiments. ****, P < 0.0001, and ***, P ≤ 0.0005, one-way ANOVA with Tukey’s multiple-comparison test. ns, not significant. (C) BMDMs were uninfected or infected with the WT or ΔesxH mutant for 1 to 4 h at a multiplicity of infection (MOI) of 10 to 50 as indicated. HRS and β-actin were examined by Western blotting. (D) Immunoelectron microscopy of BMDMs infected for 3 h with the WT and ΔesxH mutant. Red arrows indicate anti-HRS gold particles on M. tuberculosis phagosomes, while vesicular and cytosolic gold particles are indicated with orange and black arrows, respectively. Bacteria are labeled “B.” (E) The subcellular localization of anti-HRS gold particles was quantified from two independent experiments by an investigator blind to sample identity. At least 25 images with at least 174 bacilli per sample were analyzed. The number of anti-HRS gold particles in each sample is indicated (n). ****, P <0.0001, Fisher’s exact test.
FIG 7
FIG 7
HRS is not required for ESCRT-III endomembrane damage response. (A and B) HRS does not assemble with ESCRT machinery on LLOME-disrupted endolysosomes. U20S cells were treated with LLOME or the solvent control for 10 min and then stained for HRS and EEA1 (A) or for HRS and CHMP4A (B). Boxed areas are magnified at right. The middle two columns show each indicated stain in grayscale; overlap of both stains in leftmost and rightmost columns appears white. Individual cells are outlined by white dashed lines; scale bars equal 10 μm (2 μm in magnified views). (C) RAW cells were treated with siRNA to deplete HRS or TSG101 for 2 days. Macrophages were then treated with LLOME for 15 min, and ubiquitin (FK2 antibody [red]) and CHMP4B (green) were examined. FK2-positive cells are outlined by white dashed lines. (D and E) Automated image analysis was used to quantify the mean fluorescent intensity (MFI) of FK2 (D) or the number of CHMP4B (E) punctae on 50 macrophages per sample. The number of CHMP4B punctae was compared in cells with FK2 MFI greater than and less than 700. Data are means ± SEM from one representative experiment from at least two independent experiments. ****, P ≤ 0.0001, Student’s t test. ns, not significant. (F) HeLa cells were transfected with M. tuberculosis (Mtb) EsxG-EsxH or vector control, preincubated for 1 h with BAPTA-AM, and then treated with LLOME for 15 min and stained for CHMP4A (green) and EsxG-EsxH (red). EsxG-EsxH was detected with anti-V5 antibody. Nuclei were stained with DAPI. Images are maximum-intensity projections. Scale bar, 10 μm.
FIG 8
FIG 8
Model depicting how the presence of ESCRT at the M. tuberculosis phagosome is determined by ESX-1 and ESX-3. (A) In WT bacilli, ESX-1 effectors generate phagosomal damage. EsxG-EsxH antagonizes recruitment of HRS, ESCRT-III, and GAL3 to the phagosome. EsxG-EsxH alters HRS localization during infection, which might impair ESCRT-III recruitment in the context of receptor trafficking, but is unlikely to account for ESCRT-III inhibition in response to endomembrane damage. (B) During infection with a ΔesxA mutant, there is reduced phagosome damage. Without phagosomal perforation, M. tuberculosis is impaired in its ability to manipulate cellular trafficking and immune responses, and therefore, the bacilli are cleared. (C) Infection with ΔesxH mutants results in enhanced recruitment of HRS, ESCRT-III, and GAL3 to bacilli, which interferes with the bacterial virulence program.

Similar articles

Cited by

References

    1. McDonough KA, Kress Y, Bloom BR. 1993. Pathogenesis of tuberculosis: interaction of Mycobacterium tuberculosis with macrophages. Infect Immun 61:2763–2773. - PMC - PubMed
    1. van der Wel N, Hava D, Houben D, Fluitsma D, van Zon M, Pierson J, Brenner M, Peters PJ. 2007. M. tuberculosis and M. leprae translocate from the phagolysosome to the cytosol in myeloid cells. Cell 129:1287–1298. doi:10.1016/j.cell.2007.05.059. - DOI - PubMed
    1. Watson RO, Manzanillo PS, Cox JS. 2012. Extracellular M. tuberculosis DNA targets bacteria for autophagy by activating the host DNA-sensing pathway. Cell 150:803–815. doi:10.1016/j.cell.2012.06.040. - DOI - PMC - PubMed
    1. Simeone R, Bobard A, Lippmann J, Bitter W, Majlessi L, Brosch R, Enninga J. 2012. Phagosomal rupture by Mycobacterium tuberculosis results in toxicity and host cell death. PLoS Pathog 8:e1002507. doi:10.1371/journal.ppat.1002507. - DOI - PMC - PubMed
    1. Skowyra ML, Schlesinger PH, Naismith TV, Hanson PI. 2018. Triggered recruitment of ESCRT machinery promotes endolysosomal repair. Science 360:eaar5078. doi:10.1126/science.aar5078. - DOI - PMC - PubMed

Publication types

MeSH terms

Substances

LinkOut - more resources