. 2019 Jan 25;294(4):1161-1172.
doi: 10.1074/jbc.RA118.004614. Epub 2018 Nov 27.

Cooperative actions of Tbc1d1 and AS160/Tbc1d4 in GLUT4-trafficking activities

Affiliations

Cooperative actions of Tbc1d1 and AS160/Tbc1d4 in GLUT4-trafficking activities

Hiroyasu Hatakeyama et al. J Biol Chem. .

Abstract

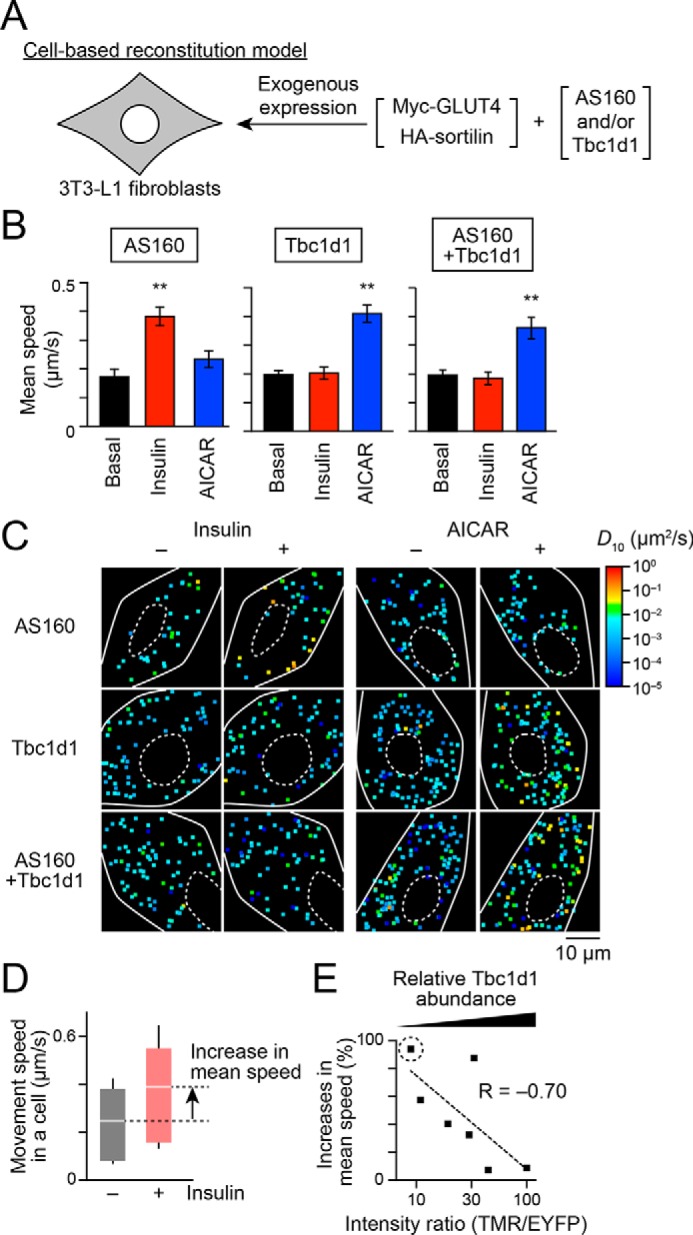
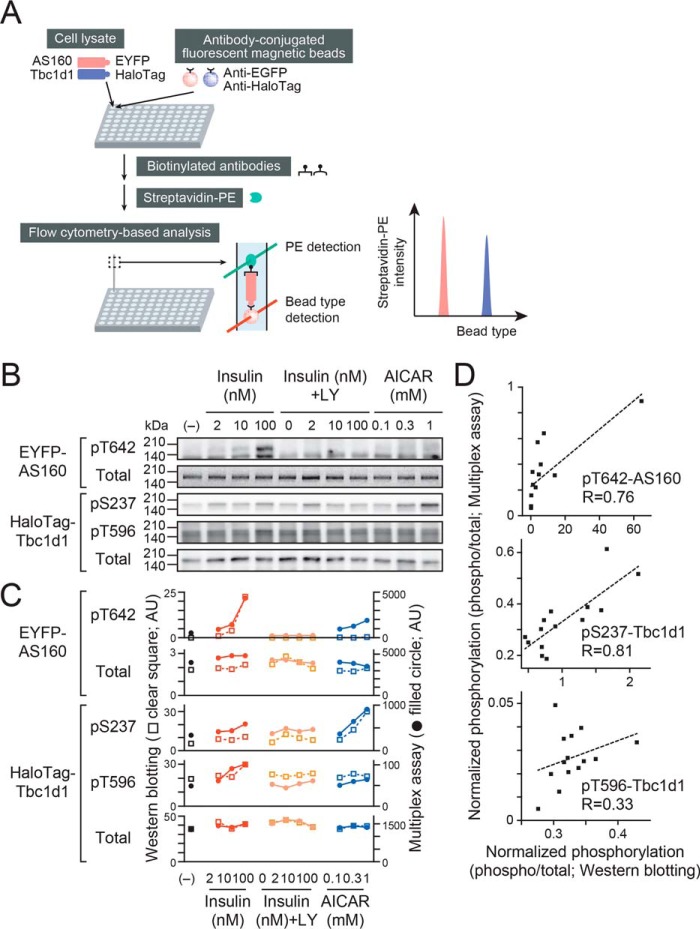
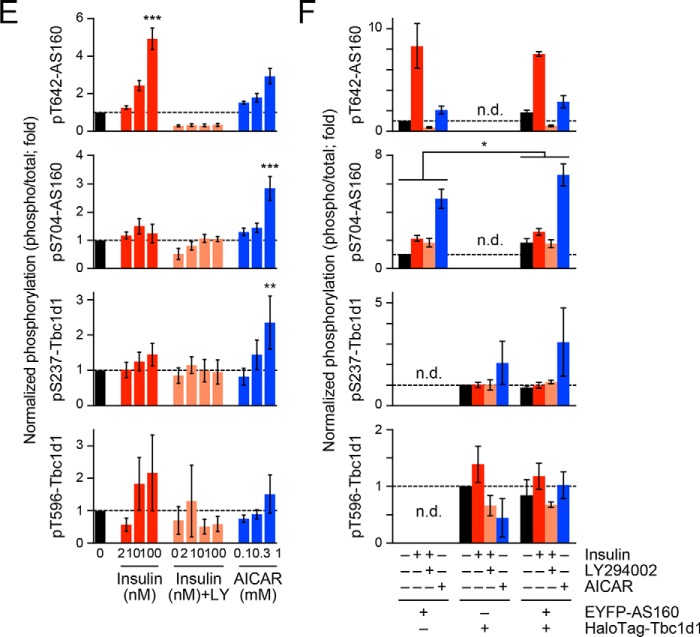
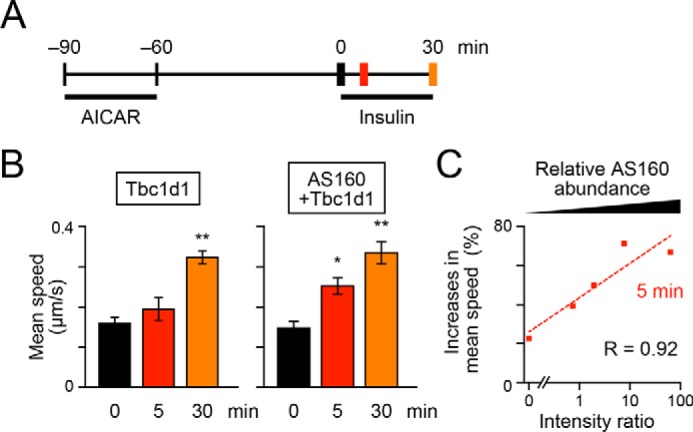
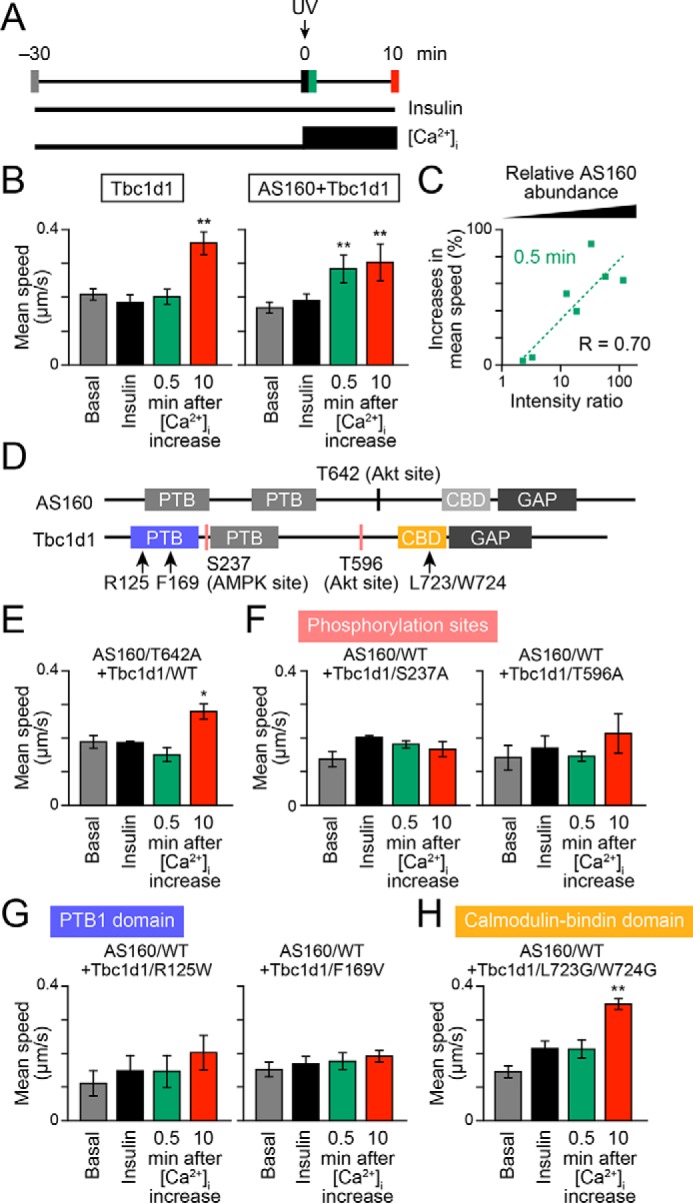
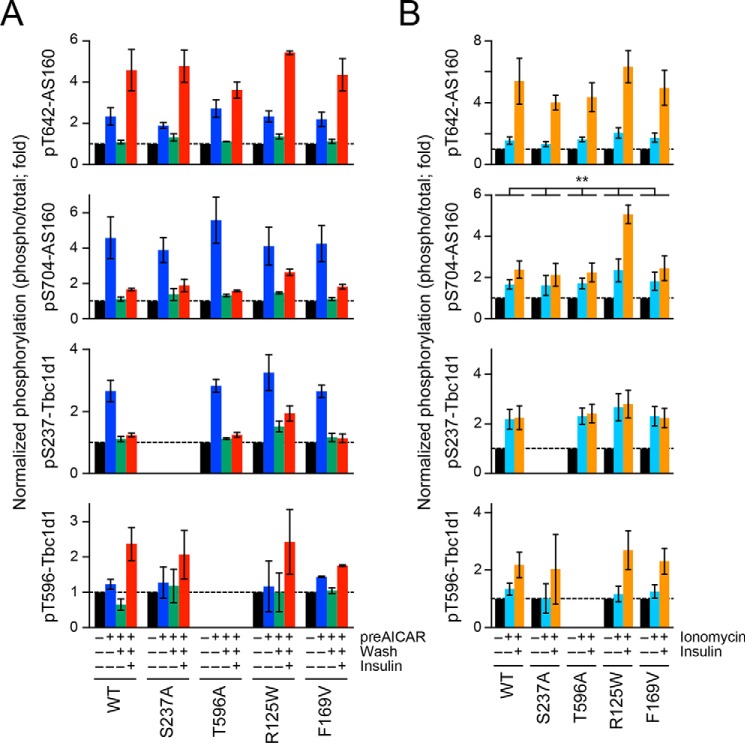
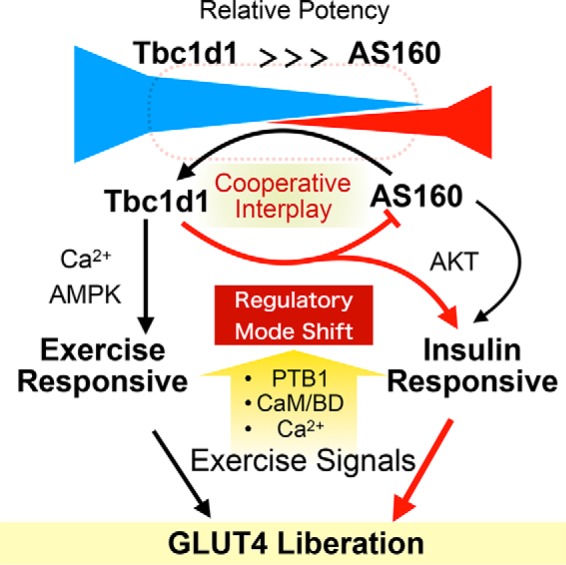
AS160 and Tbc1d1 are key Rab GTPase-activating proteins (RabGAPs) that mediate release of static GLUT4 in response to insulin or exercise-mimetic stimuli, respectively, but their cooperative regulation and its underlying mechanisms remain unclear. By employing GLUT4 nanometry with cell-based reconstitution models, we herein analyzed the functional cooperative activities of the RabGAPs. When both RabGAPs are present, Tbc1d1 functionally dominates AS160, and stimuli-inducible GLUT4 release relies on Tbc1d1-evoking proximal stimuli, such as AICAR and intracellular Ca2+ Detailed functional assessments with varying expression ratios revealed that AS160 modulates sensitivity to external stimuli in Tbc1d1-mediated GLUT4 release. For example, Tbc1d1-governed GLUT4 release triggered by Ca2+ plus insulin occurred more efficiently than that in cells with little or no AS160. Series of mutational analyses revealed that these synergizing actions rely on the phosphotyrosine-binding 1 (PTB1) and calmodulin-binding domains of Tbc1d1 as well as key phosphorylation sites of both AS160 (Thr642) and Tbc1d1 (Ser237 and Thr596). Thus, the emerging cooperative governance relying on the multiple regulatory nodes of both Tbc1d1 and AS160, functioning together, plays a key role in properly deciphering biochemical signals into a physical GLUT4 release process in response to insulin, exercise, and the two in combination.

Keywords: AMP-activated kinase (AMPK); Akt PKB; GTPase activating protein (GAP); glucose transporter type 4 (GLUT4); insulin; membrane trafficking; microscopic imaging; signal transduction.


Conflict of interest statement

The authors declare that they have no conflicts of interest with the contents of this article

Figures

Figure 1.
Figure 1.
Dominant actions of Tbc1d1 in insulin-responsive GLUT4 liberation in cells co-expressing AS160 and Tbc1d1. A, cell-based reconstitution model. In this study, 3T3-L1 fibroblasts exogenously expressing Myc-GLUT4, HA-sortilin, and both Tbc1d1 and AS160, or either one alone, were used. B, mean speed of intracellular movement of GLUT4 under the indicated conditions in cells expressing Tbc1d1 (left), AS160 (middle), or both (right). The cells were simulated without (black) or with insulin (red; 100 nm) or AICAR (blue; 1 mm) for 30 min. **, p < 0.01 by Dunnett's multiple comparison versus basal states (n = 6–8). C, representative diffusion coefficient maps of GLUT4 movement in cells under the indicated conditions. D, box plots of GLUT4 movement speeds in a cell expressing EYFP-AS160 and HaloTag-Tbc1d1 before (black) and after (red) insulin stimulation (100 nm, 30 min). HaloTag-Tbc1d1 was stained with HaloTag TMR ligand, and epifluorescence of TMR and EYFP was acquired just before analyzing single-molecule GLUT4 behavior. The ratio of HaloTag-Tbc1d1 to EYFP-AS160 was calculated on the basis of their fluorescence intensities. We also calculated the percentage increase in the mean movement speed of GLUT4 in response to insulin stimulation (arrow). Intensity ratio (TMR/EYFP) and percentage increase in the movement speed in this cell were 9.4 and 94.1%, respectively. White lines and error bars represent mean and S.D., respectively. E, relationship between insulin-responsive GLUT4 liberation and relative Tbc1d1 abundance to that of AS160. Each dot represents a cell. A dot surrounded by a dotted circle represents the data shown in D.
Figure 2.
Figure 2.
Analysis of phosphorylation signals of AS160 and Tbc1d1 by multiplex assay. A, schematic drawing for multiplex assays of phosphorylation signals. B, representative Western blotting of HaloTag-Tbc1d1 or EYFP-AS160 (phosphorylation or total) of cell lysates treated under the indicated conditions. Note that total EYFP-AS160 was obtained by its EYFP fluorescence. Some cells were pretreated with LY294002 (LY; 50 μm) for 30 min before stimulation with insulin or AICAR for 10 min. C, quantification of HaloTag-Tbc1d1 or EYFP-AS160 (phosphorylation or total) analyzed by Western blotting (open squares) and multiplex assay (filled circles). These values were obtained from the same samples as those shown in B. D, correlation between results obtained with the two assay systems. The values were obtained from the data shown in C and are presented as ratios (phosphorylation/total). E, -fold changes in phosphorylation of HaloTag-Tbc1d1 and EYFP-AS160 analyzed by multiplex assays. **, p < 0.01; ***, p < 0.001 by Dunnett's multiple comparison versus basal states (n = 3). F, phosphorylation signals in the co-presence of AS160 and Tbc1d1. The values are shown as ratios (phosphorylation/total) and as -fold increases, as compared with untreated cells expressing either AS160 or Tbc1d1. *, p < 0.05 by two-way repeated measures analysis of variance for the expressed proteins (n = 3). n.d., not detected. Error bars, S.E.
Figure 2.
Figure 2.
Analysis of phosphorylation signals of AS160 and Tbc1d1 by multiplex assay. A, schematic drawing for multiplex assays of phosphorylation signals. B, representative Western blotting of HaloTag-Tbc1d1 or EYFP-AS160 (phosphorylation or total) of cell lysates treated under the indicated conditions. Note that total EYFP-AS160 was obtained by its EYFP fluorescence. Some cells were pretreated with LY294002 (LY; 50 μm) for 30 min before stimulation with insulin or AICAR for 10 min. C, quantification of HaloTag-Tbc1d1 or EYFP-AS160 (phosphorylation or total) analyzed by Western blotting (open squares) and multiplex assay (filled circles). These values were obtained from the same samples as those shown in B. D, correlation between results obtained with the two assay systems. The values were obtained from the data shown in C and are presented as ratios (phosphorylation/total). E, -fold changes in phosphorylation of HaloTag-Tbc1d1 and EYFP-AS160 analyzed by multiplex assays. **, p < 0.01; ***, p < 0.001 by Dunnett's multiple comparison versus basal states (n = 3). F, phosphorylation signals in the co-presence of AS160 and Tbc1d1. The values are shown as ratios (phosphorylation/total) and as -fold increases, as compared with untreated cells expressing either AS160 or Tbc1d1. *, p < 0.05 by two-way repeated measures analysis of variance for the expressed proteins (n = 3). n.d., not detected. Error bars, S.E.
Figure 3.
Figure 3.
Accelerating potency of AS160 on insulin-responsive GLUT4 liberation in response to sequential treatments with AICAR and insulin. A, treatment and acquisition protocols. Cells were first stimulated with AICAR (1 mm) for 30 min and then washed for 1 h, followed by stimulation with insulin (100 nm). Imaging was performed before (black) and after (red, 5 min; orange, 30 min) insulin stimulation. B, mean speeds of intracellular movements of GLUT4 in cells expressing Tbc1d1 (left) or both AS160 and Tbc1d1 (right). *, p < 0.05; **, p < 0.01 by Dunnett's multiple comparison versus before insulin stimulation (n = 5–7). C, relationship between insulin-responsive GLUT4 liberation at 5 min of insulin stimulation and relative AS160 abundance. Error bars, S.E.
Figure 4.
Figure 4.
Accelerating potency of AS160 to insulin-responsive GLUT4 liberation in response to treatment with insulin and Ca2+ combined. A, treatment and acquisition protocols. Cells were first stimulated with insulin (100 nm) for 30 min, and then, at time 0, photolysis of the caged Ca2+ compound NPE was induced (UV; arrow). Imaging was performed in the basal (gray), insulin-stimulated (black), and after (green, 0.5 min; red, 10 min) photolysis states. B, mean speeds of intracellular movements of GLUT4 in cells expressing Tbc1d1 (left) or both AS160 and Tbc1d1 (right). **, p < 0.01 by Dunnett's multiple-comparison versus insulin-stimulated states (just before photolysis) (n = 6–8). C, relationship between insulin-responsive GLUT4 liberation at 0.5 min of photolysis and relative AS160 abundance. D, schematic domain structures of human AS160 and Tbc1d1. Mutated amino acids are shown as text. E–H, effects of AS160 (E) or Tbc1d1 (F–H) mutants on GLUT4 liberation in response to combined treatment with insulin and Ca2+. *, p < 0.05; **, p < 0.01 by Dunnett's multiple comparison versus insulin-stimulated states (n = 5–7). Error bars, S.E.
Figure 5.
Figure 5.
Effects of Tbc1d1 mutants on phosphorylation signals of AS160 and Tbc1d1 analyzed by multiplex assays. Cells expressing Myc-GLUT4-mCherry, HA-sortilin, EYFP-AS160, and WT or the indicated mutants of HaloTag-Tbc1d1 were stimulated as follows. In A, cells were first stimulated without (black) or with AICAR (1 mm) for 30 min (blue) and then washed for 1 h (green), followed by stimulation with insulin (100 nm) for 5 min (red). In B, cells were stimulated without (black) or with ionomycin (1 μg/ml) (cyan) or ionomycin + insulin (100 nm) for 5 min (orange). The values are shown as ratios (phosphorylation/total) and as -fold increases, as compared with untreated cells. **, p < 0.01 by two-way repeated measures analysis of variance (n = 3). n.d., not detected. Error bars, S.E.
Figure 6.
Figure 6.
Schematic depiction of cooperative governance for stimulus-dependent GLUT4 liberation process via Tbc1d1 and AS160. Under coexistence of Tbc1d1 and AS160 conditions, Tbc1d1 functionally dominates AS160, given that stimuli-dependent GLUT4 liberation predominantly relies on Tbc1d1-evoking proximal stimuli, such as AMPK activation (AICAR) and an increase in intracellular Ca2+. However, AS160 modulates sensitivity to external stimuli in the Tbc1d1-dominated GLUT4 release process via promoting the regulatory mode shift of Tbc1d1, resulting in efficient acquisition of insulin responsiveness, which requires an intact PTB1 domain and Ser237 phosphorylation of Tbc1d1. This potentiating action of AS160 also relies on the CBD of both Tbc1d1 and Thr642 (Akt site) of AS160. This cooperative governance, which relies on combined regulatory modes involving both Tbc1d1 (e.g. PTB1, CBD, Ser237 phosphorylation) and AS160 (e.g. Thr642 phosphorylation), plays a key role in deciphering biochemical signals (e.g. phosphorylation and [Ca2+]i) into physical GLUT4 release processes in response to insulin and exercise-related stimuli.

References

    1. Bruss M. D., Arias E. B., Lienhard G. E., and Cartee G. D. (2005) Increased phosphorylation of Akt substrate of 160 kDa (AS160) in rat skeletal muscle in response to insulin or contractile activity. Diabetes 54, 41–50 10.2337/diabetes.54.1.41 - DOI - PubMed
    1. Taylor E. B., An D., Kramer H. F., Yu H., Fujii N. L., Roeckl K. S., Bowles N., Hirshman M. F., Xie J., Feener E. P., and Goodyear L. J. (2008) Discovery of TBC1D1 as an insulin-, AICAR-, and contraction-stimulated signaling nexus in mouse skeletal muscle. J. Biol. Chem. 283, 9787–9796 10.1074/jbc.M708839200 - DOI - PMC - PubMed
    1. Kane S., Sano H., Liu S. C., Asara J. M., Lane W. S., Garner C. C., and Lienhard G. E. (2002) A method to identify serine kinase substrates: Akt phosphorylates a novel adipocyte protein with a Rab GTPase-activating protein (GAP) domain. J. Biol. Chem. 277, 22115–22118 10.1074/jbc.C200198200 - DOI - PubMed
    1. Kane S., and Lienhard G. E. (2005) Calmodulin binds to the Rab GTPase activating protein required for insulin-stimulated GLUT4 translocation. Biochem. Biophys. Res. Commun. 335, 175–180 10.1016/j.bbrc.2005.07.056 - DOI - PubMed
    1. Roach W. G., Chavez J. A., Mîinea C. P., and Lienhard G. E. (2007) Substrate specificity and effect on GLUT4 translocation of the Rab GTPase-activating protein Tbc1d1. Biochem. J. 403, 353–358 10.1042/BJ20061798 - DOI - PMC - PubMed

Publication types