. 2018 Nov 27;11(558):eaar8278.
doi: 10.1126/scisignal.aar8278.

Aspirin ameliorates experimental autoimmune encephalomyelitis through interleukin-11-mediated protection of regulatory T cells

Affiliations

Aspirin ameliorates experimental autoimmune encephalomyelitis through interleukin-11-mediated protection of regulatory T cells

Susanta Mondal et al. Sci Signal. .

Abstract

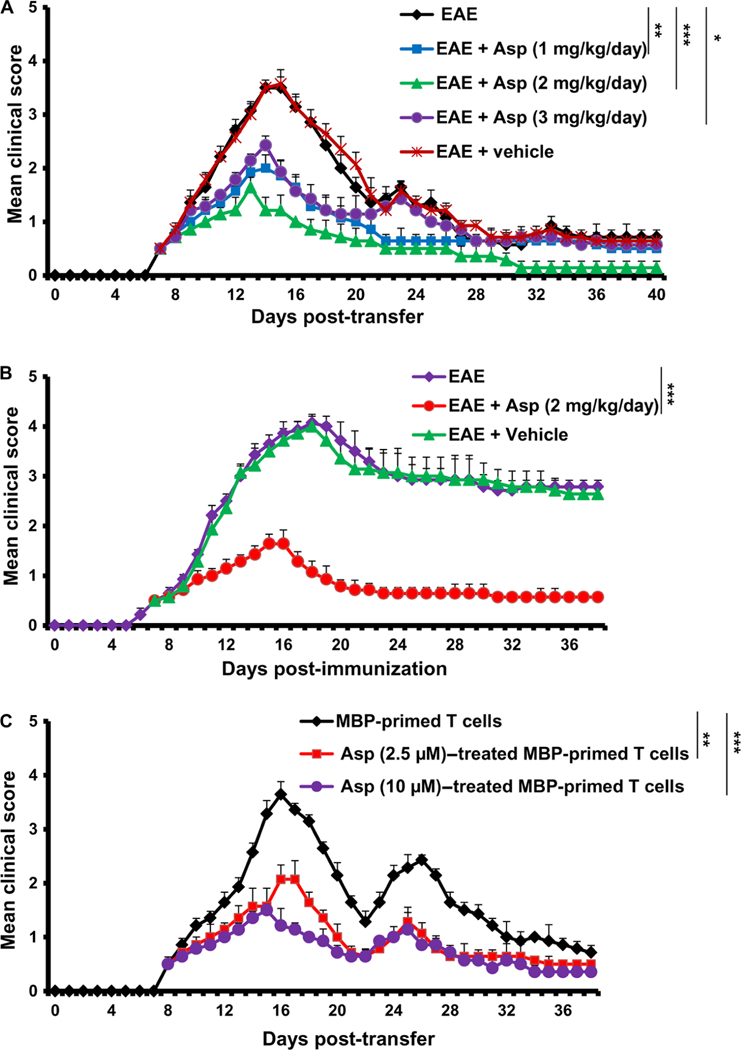
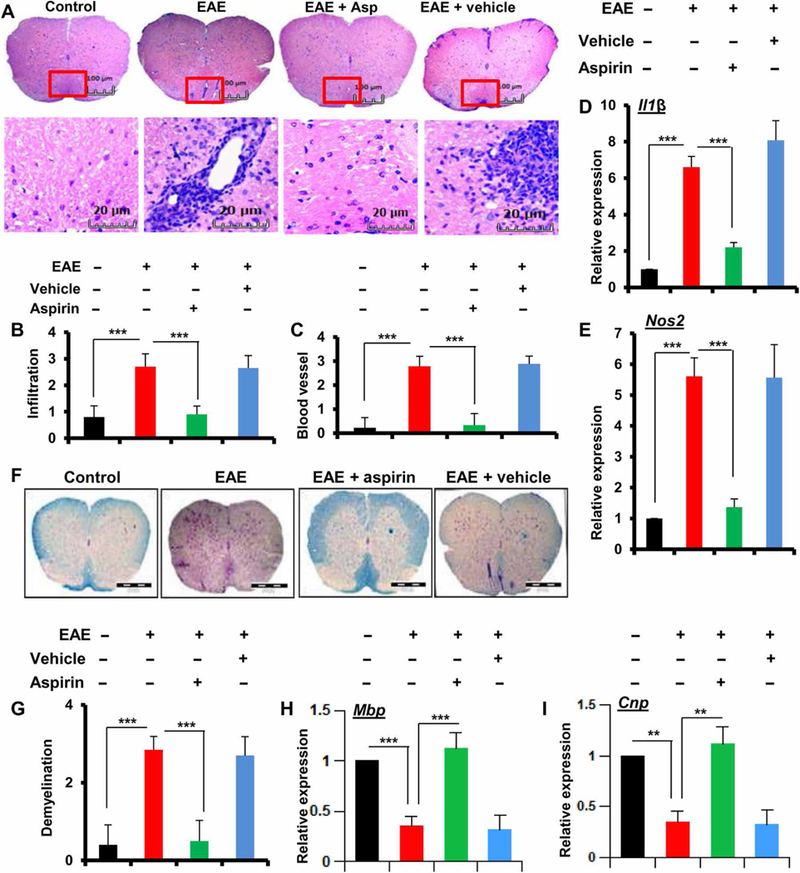
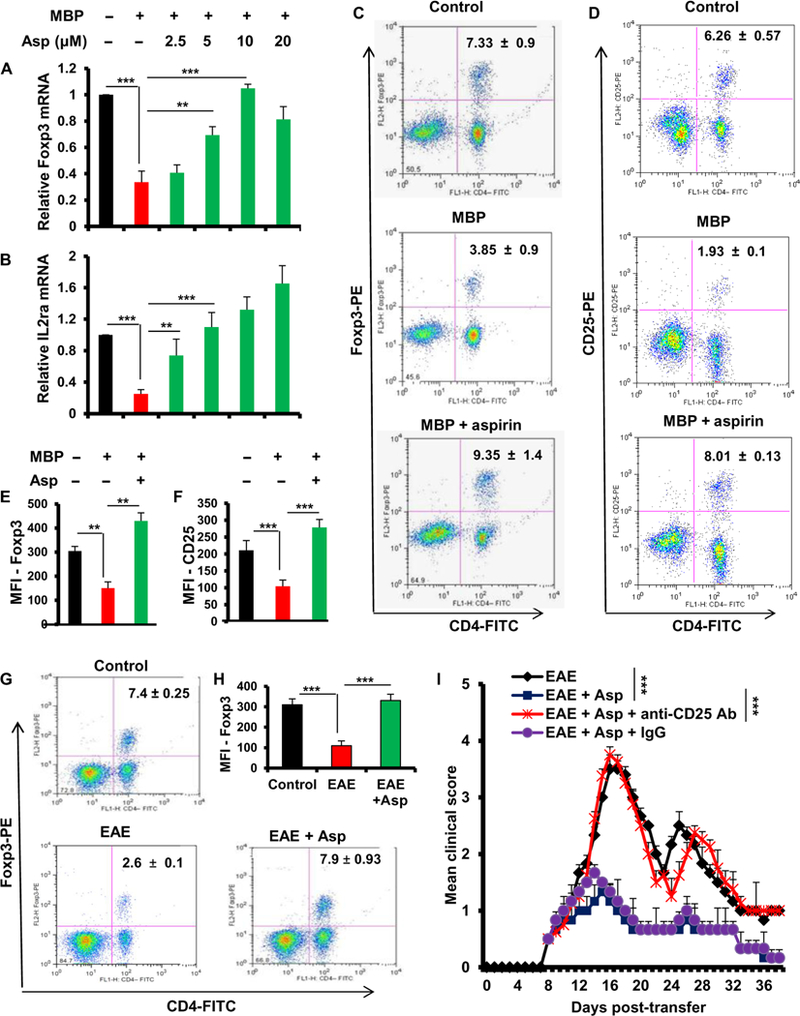
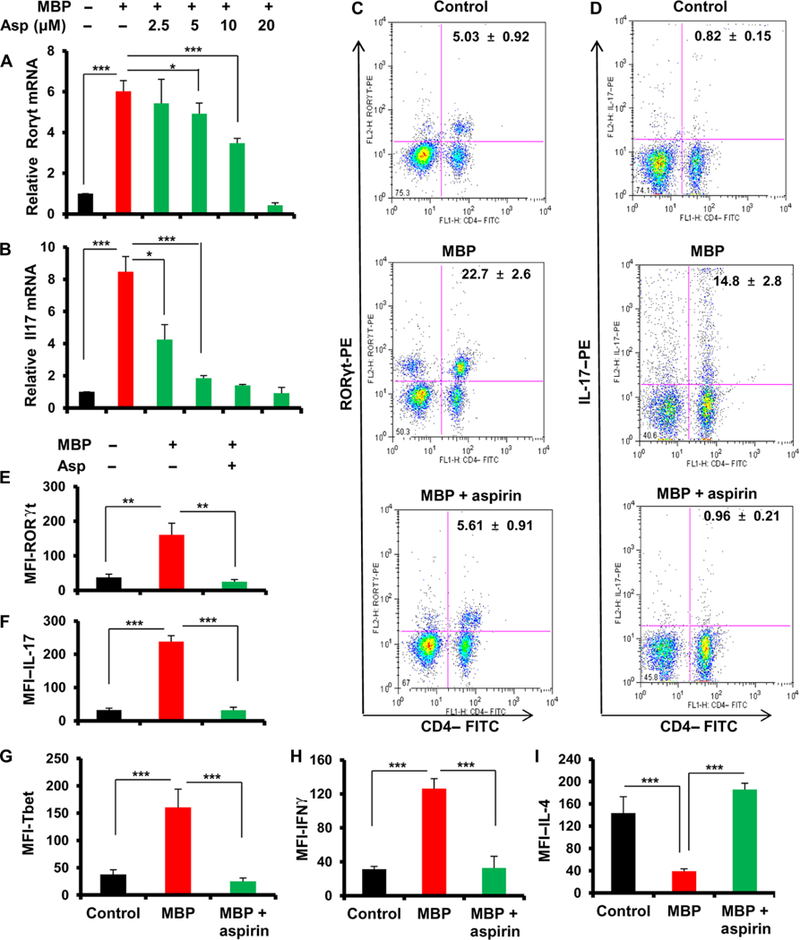
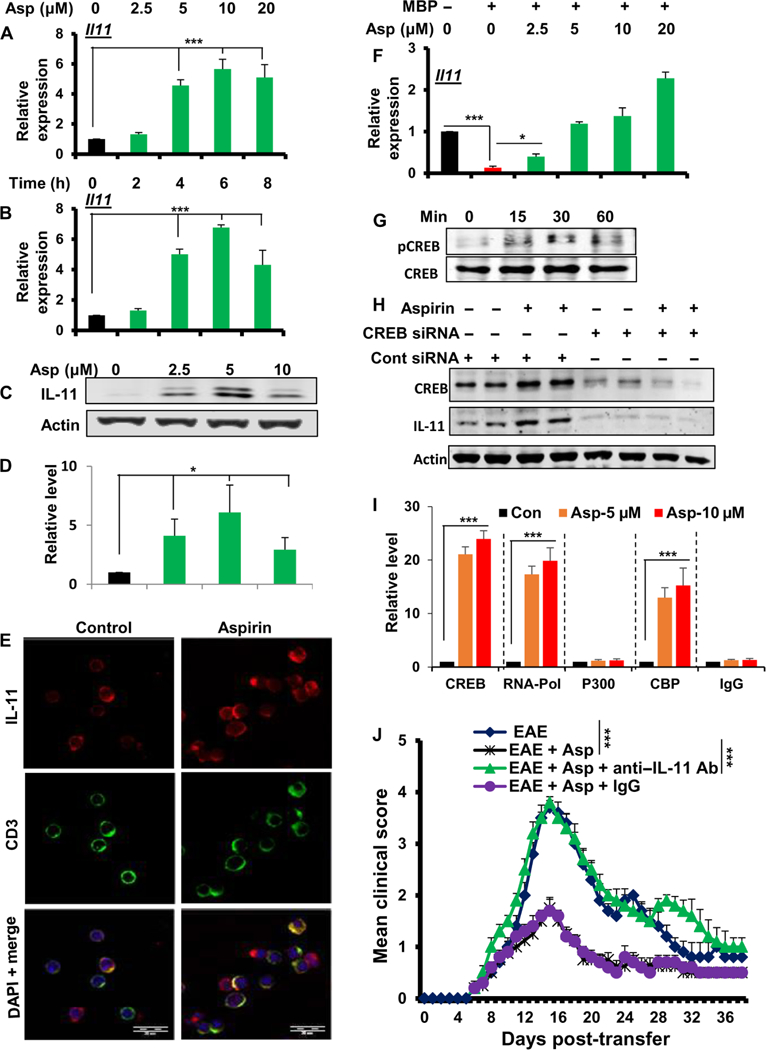
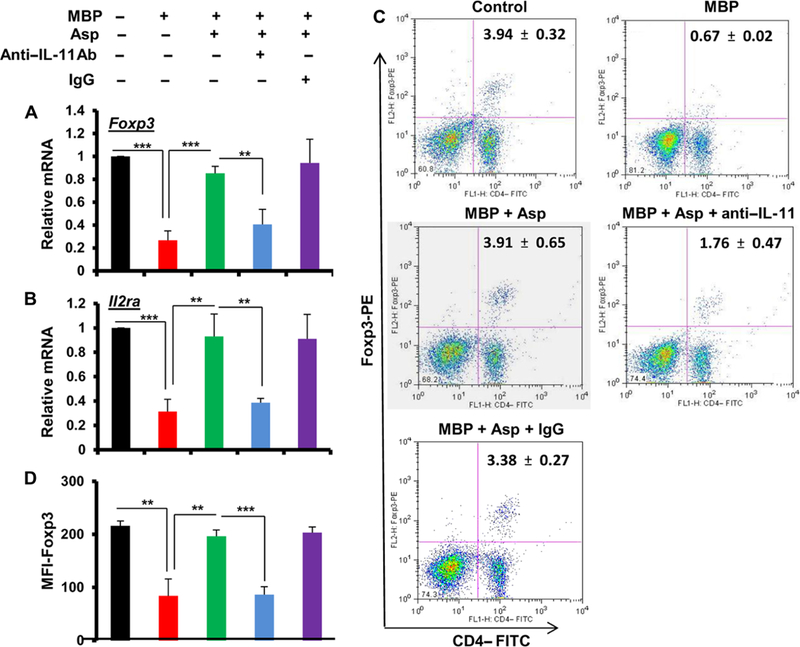
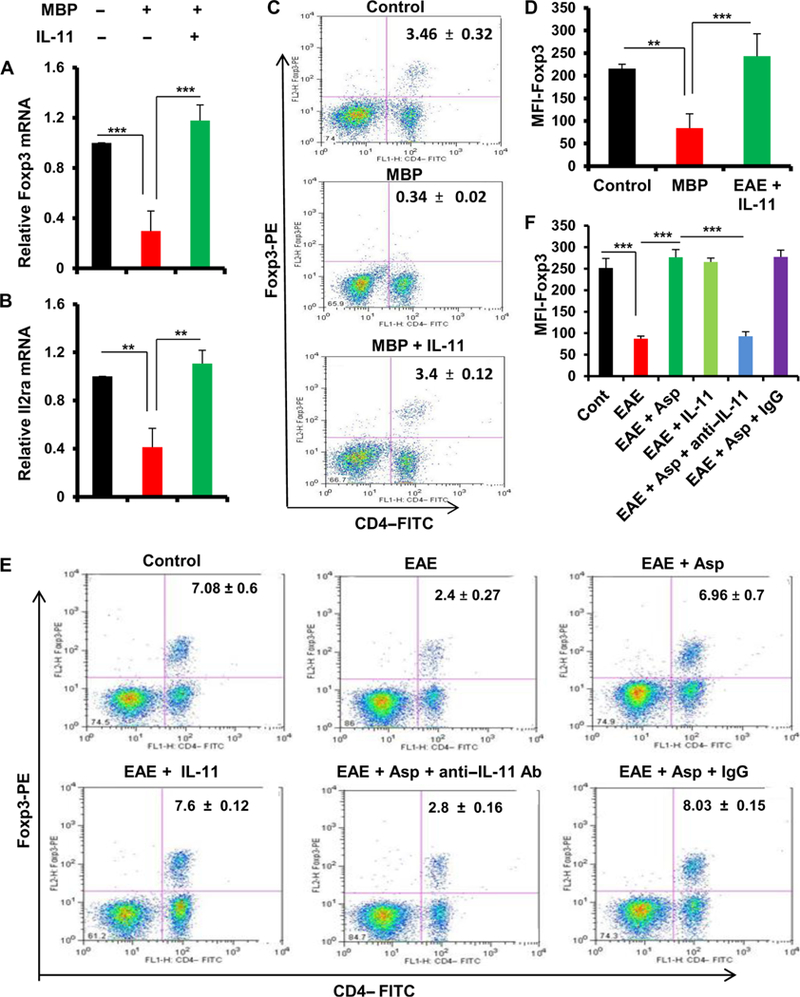
Multiple sclerosis (MS) is a human disease that results from autoimmune T cells targeting myelin protein that is expressed within the central nervous system. In MS, the number of FoxP3-expressing regulatory T cells (Tregs) is reduced, which facilitates the activation of autoreactive T cells. Because aspirin (acetylsalicylic acid) is the most widely used nonsteroidal anti-inflammatory drug, we examined its immunomodulatory effect in mice with experimental autoimmune encephalomyelitis (EAE), an animal model of MS. We found that low-dose aspirin suppressed the clinical symptoms of EAE in mouse models of both relapsing-remitting and chronic disease. Aspirin reduced the development of EAE driven by myelin basic protein (MBP)-specific T cells and the associated perivascular cuffing, inflammation, and demyelination. The effects of aspirin required the presence of CD25+FoxP3+ Tregs Aspirin increased the amounts of Foxp3 and interleukin-4 (IL-4) in T cells and suppressed the differentiation of naïve T cells into T helper 17 (TH17) and TH1 cells. Aspirin also increased the transcription of Il11 mediated by the transcription factor CREB, which was necessary for the generation of Tregs Neutralization of IL-11 negated the effects of aspirin on Treg development and exacerbated EAE. Furthermore, we found that IL-11 alone was sufficient to maintain the percentage of FoxP3+ Tregs and protect mice from EAE. These results identify a previously uncharacterized mode of action of aspirin.


Conflict of interest statement

Competing interests: The authors declare that they have no competing interests.

Figures

Fig. 1.
Fig. 1.. Low-dose aspirin suppresses clinical symptoms of EAE.
(A) Clinical EAE disease scores of mice after adoptive transfer of MBP-primed T cells and daily treatment with aspirin, as indicated. Data are means ± SEM of seven mice per group from two independent experiments. (B) Clinical EAE disease scores of mice after immunization with MOG35–55 and daily treatment with aspirin, as indicated. Data are means ± SEM of seven mice per group from two independent experiments. (C) Clinical EAE disease scores of mice after adoptive transfer of MBP-primed T cells stimulated in vitro with the indicated concentrations of aspirin. Data are means ± SEM of seven mice per group from two independent experiments. *P < 0.05, **P < 0.01, and ***P < 0.005 by Sidak’s multiple comparisons test.
Fig. 2.
Fig. 2.. Low-dose aspirin inhibits demyelination and suppresses immune cell infiltration of the spinal cord in EAE.
(A) H&E staining of spinal cord sections from mice after the indicated treatments. Data are representative of five mice per group from two independent experiments. Scale bars, 100 µm (top) or 20 µm (bottom). (B and C) Histology scores of immune cell infiltration and cuffed blood vessels in spinal cord sections from mice after the indicated treatments. Data are means ± SEM of five mice per group from two independent experiments. (D and E) qRT-PCR analysis of Nos2 and Il1β mRNA expression in spinal cord tissue of mice after the indicated treatments. Data are means ± SEM of five mice per group from two independent experiments. (F and G) Luxol fast blue staining for myelin in spinal cord sections from mice after the indicated treatments. Images (F) are representative of two independent experiments. Quantified scores from tissue sections (G) are means ± SEM of five mice per group. (H and I) qRT-PCR analysis of Mbp and Cnp mRNA expression in spinal cord tissue of mice after the indicated treatments. Data are means ± SEM of five mice per group from two independent experiments. **P < 0.01 and ***P < 0.005 by two-sample t tests.
Fig. 3.
Fig. 3.. Aspirin treatment stabilizes Tregs and protects mice from EAE.
(A and B) qRT-PCR analysis of Foxp3 and IL2ra mRNA expression in splenocytes from MBP-immunized mice stimulated with MBP with or without aspirin. Data are means ± SEM from three independent experiments performed in duplicate. (C to F) Flow cytometry analysis of FoxP3 and CD25 abundance in CD4 T cells from MBP-immunized mice stimulated as indicated. Dot plots are representative of three independent experiments performed in duplicate. Quantified mean florescence intensity (MFI) values are means ± SEM from all experiments. (G and H) Flow cytometry analysis of FoxP3 abundance in CD4+ T cells from mice that received MBP-primed T cells and were treated with aspirin as indicated. Dot plots (G) are representative of five mice per group from two independent experiments. Quantified MFI data (H) are means ± SEM from all experiments. (I) Clinical EAE disease scores of mice after adoptive transfer of MBP-primed T cells and daily treatment with aspirin and anti-CD25 or control IgG, as indicated. Data are means ± SEM of seven mice per group from two independent experiments. **P < 0.01 and ***P < 0.005 by two-sample t tests (A, B, D, and H) or Sidak’s multiple comparisons test (I). Ab, antibody.
Fig. 4.
Fig. 4.. Aspirin suppresses TH17 and TH1, but not TH2, responses.
(A and B) qRT-PCR analysis of Rorγt and Il17 mRNA expression in splenocytes isolated from MBP-immunized donor mice stimulated with MBP with the indicated concentrations of aspirin for 24 hours. Data are means ± SEM of three independent experiments performed in duplicate. (C to F) Flow cytometry analysis of RORγt and IL-17 in CD4+ T cells from MBP-immunized donor mice treated as indicated. Dot plots (C and D) are representative of three independent experiments performed in duplicate. Quantified MFI data are means ± SEM from all experiments. (G to I) Flow cytometry analysis of Tbet, IFNγ, and IL-4 in CD4+ T cells from MBP-immunized donor mice treated as indicated. Quantified MFI data are means ± SEM from three independent experiments performed in duplicate. *P < 0.05, **P < 0.01, and ***P < 0.005 by two-sample t tests.
Fig. 5.
Fig. 5.. Aspirin promotes CREB-mediated IL-11 expression, which protects mice from EAE.
(A) qRT -PCR analysis of Il11 mRNA expression in splenocytes from normal mice treated with increasing doses of aspirin for 4 hours. Data are means ± SEM from three independent experiments performed in duplicate. (B) qRT-PCR analysis of Il11 mRNA expression in splenocytes from normal mice treated with aspirin for up to 8 hours. Data are means ± SEM from three independent experiments performed in duplicate. (C and D) Western blot analysis of IL- 11 abundance in lysate of splenocytes from normal mice treated with the indicated doses of aspirin for 8 hours. Blots (C) are representative of three independent experiments performed in duplicate. Quantified data (D) are means ± SEM from all experiments. (E) Immunofluorescence microscopy analysis of IL-11 and CD3 expression in splenocytes from normal mice treated with and without aspirin. Images are representative of three independent experiments performed in duplicate. DAPI, 4′ ,6- d i a m i d i n o −2-phenylindole. (F) qRT-PCR analysis of Il11 mRNA expression in splenocytes from MBP-immunized mice that were stimulated with MBP and increasing doses of aspirin for 4 hours. Data are means ± SEM from three independent experiments performed in duplicate. (G) Western blot analysis of pCREB abundance in lysates of splenocytes treated with aspirin for the indicated times. Blots are represent­ ative of three independent experiments performed in duplicate. (H) Western blot analysis of CREB and IL-11 abundance in lysates of splenocytes transfected with either control or CREB siRNA and treated with aspirin for 6 hours. Blots are representative of three independent experiments performed in duplicate. (I) qRT-PCT analysis of the IL-11 promoter association with CREB, CBP, p300, and RNA polymerase after ChIP from lysate of splenocytes stimulated with aspirin for 2 hours. Data are means ± SEM from three independent experiments performed in duplicate. (J) Clinical EAE disease scores of mice after adoptive transfer of MBP-primed T cells and daily treatment with aspirin and control IgG, IL-11–neutralizing anti-body, or recombinant mouse IL-11, as indicated. Data are means ± SEM of seven mice per group from two independent experiments. *P < 0.05, **P < 0.01, and ***P < 0.005 by two-sample t tests (A, B, D, F, and I) or Sidak’s multiple comparisons test (J).
Fig. 6.
Fig. 6.. Aspirin-induced IL-11 stimulates Treg differentiation.
(A and B) qRT-PCR analysis of Foxp3 and IL2ra mRNA expression in splenocytes from MBPimmunized mice stimulated with MBP and aspirin, with or without IL-11–neutralizing antibody. Data are means ± SEM from three independent experiments performed in duplicate. (C and D) Flow cytometry analysis of FoxP3 abundance in CD4+ T cells from MBP-immunized mice that were stimulated with MBP, aspirin, and IL-11–neutralizing antibody, as indicated. Dot plots (C) are representative of three independent experiments performed in duplicate. Quantifieewd MFI data (D) are means ± SEM from all experiments. **P < 0.01 and ***P < 0.005 by two-sample t tests
Fig. 7.
Fig. 7.. IL-11 alone is capable of stabilizing Tregs in MBP-primed splenocytes and in vivo in EAE mice.
(A and B) qRTPCR analysis of Foxp3 (A) and IL2ra (B) mRNA expression in splenocytes from MBP-immunized mice stimulated with MBP and IL-11. Data are means ± SEM from three independent experiments performed in duplicate. (C and D) Flow cytometry analysis of FoxP3 abundance in CD4+ T cells from MBP-immunized mice that were stimulated with MBP and recombinant IL-11, as indicated. Dot plots (C) are representative of three independent experiments performed in duplicate. Quantified MFI data (D) are means ± SEM from all experiments. (E and F) Flow cytometry analysis of FoxP3 abundance in CD4+ T cells from mice after adoptive transfer of MBP-specific T cells and treatment with aspirin and IL-11–neutralizing antibody or recombinant mouse IL-11. Dot plots (E) are representative of three independent experiments performed in duplicate. Quantified MFI data (F) are means ± SEM from all experiments. **P < 0.01 and ***P < 0.005 by two-sample t tests.

References

    1. Martin R, McFarland H F, McFarlin D E, Immunological aspects of demyelinating diseases. Annu. Rev. Immunol 10, 153–187 (1992). - PubMed
    1. Sambucci M, Gargano F, De Rosa V, De Bardi M, Picozza M, Placido R, Ruggieri S, Capone A, Gasperini C, Matarese G, Battistini L, Borsellino G, FoxP3 isoforms and PD-1 expression by T regulatory cells in multiple sclerosis. Sci. Rep 8, 3674 (2018). - PMC - PubMed
    1. Coffer P J, Burgering B M T , Forkhead-box transcription factors and their role in the immune system. Nat. Rev. Immunol 4, 889–899 (2004). - PubMed
    1. Sakaguchi S, Powrie F, Emerging challenges in regulatory T cell function and biology. Science 317, 627–629 (2007). - PubMed
    1. Lu L, Barbi J, Pan F, The regulation of immune tolerance by FOXP3. Nat. Rev. Immunol 17, 703–717 (2017). - PMC - PubMed

Publication types

MeSH terms

LinkOut - more resources