. 2018 Nov 27;11(558):eaat9093.
doi: 10.1126/scisignal.aat9093.

Hippocampal mGluR1-dependent long-term potentiation requires NAADP-mediated acidic store Ca2+ signaling

Affiliations

Hippocampal mGluR1-dependent long-term potentiation requires NAADP-mediated acidic store Ca2+ signaling

William J Foster et al. Sci Signal. .

Abstract

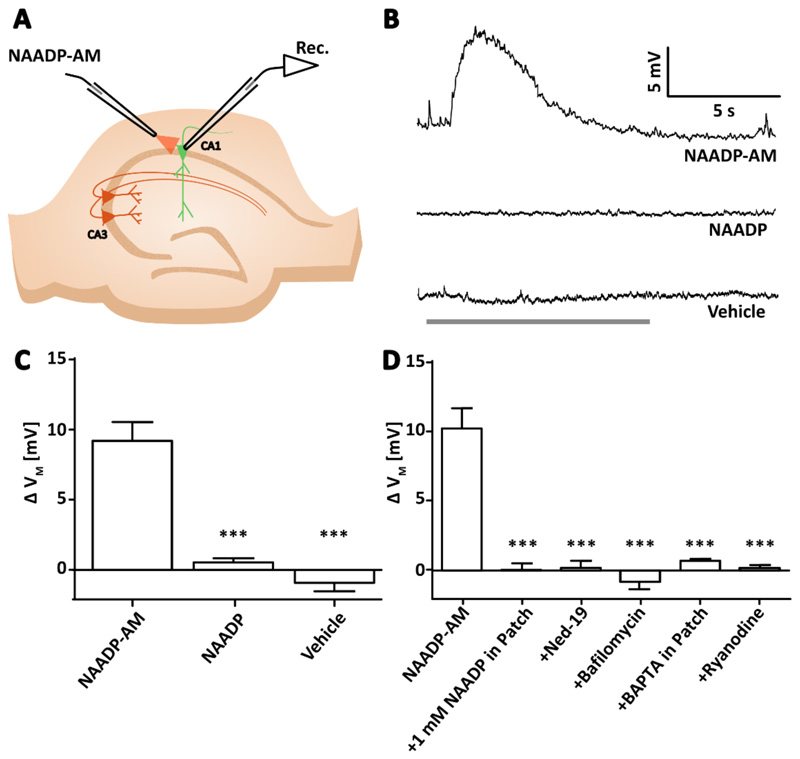
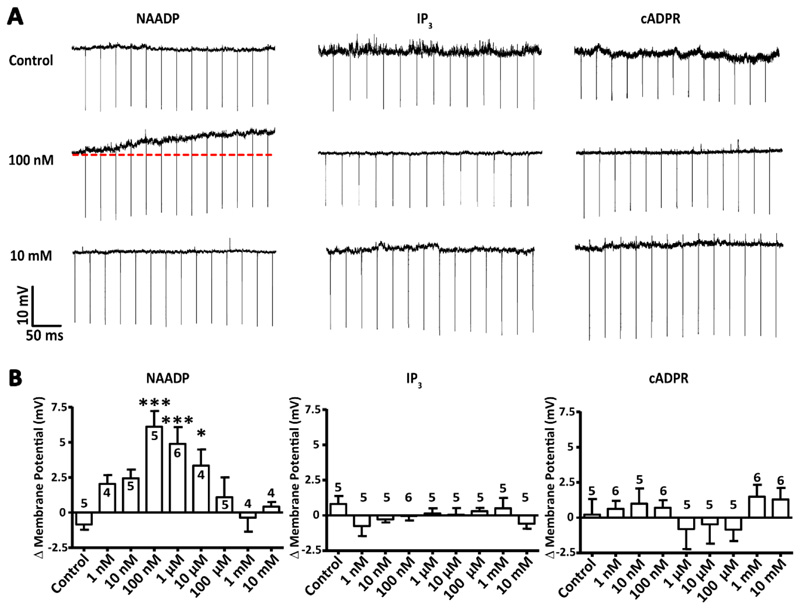
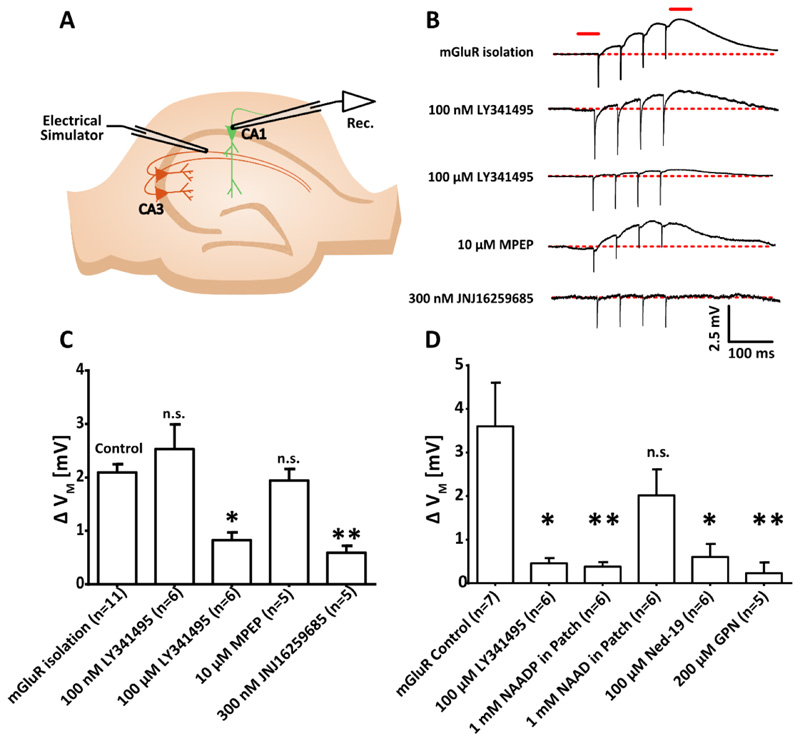
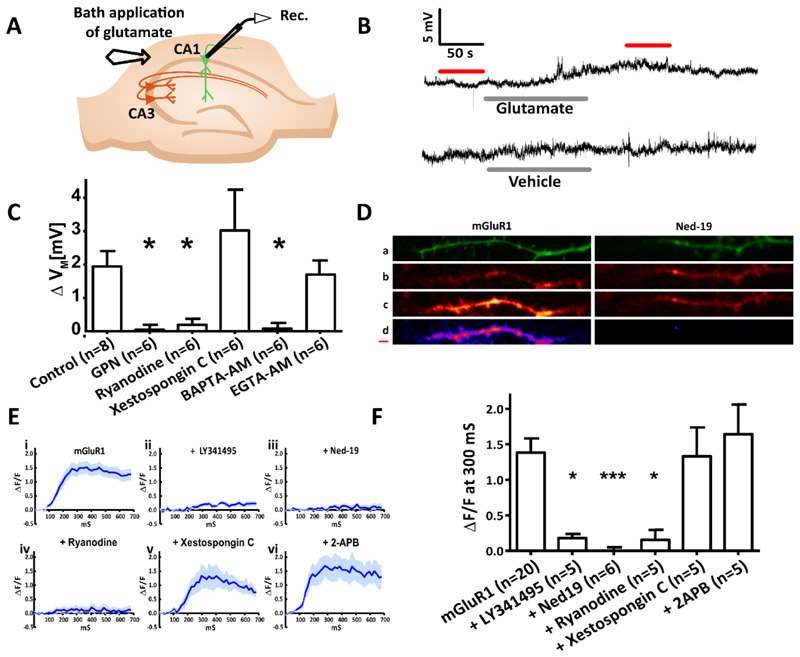
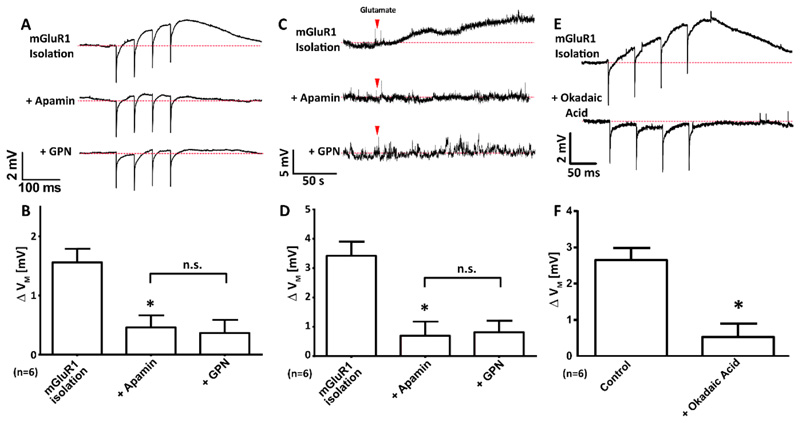
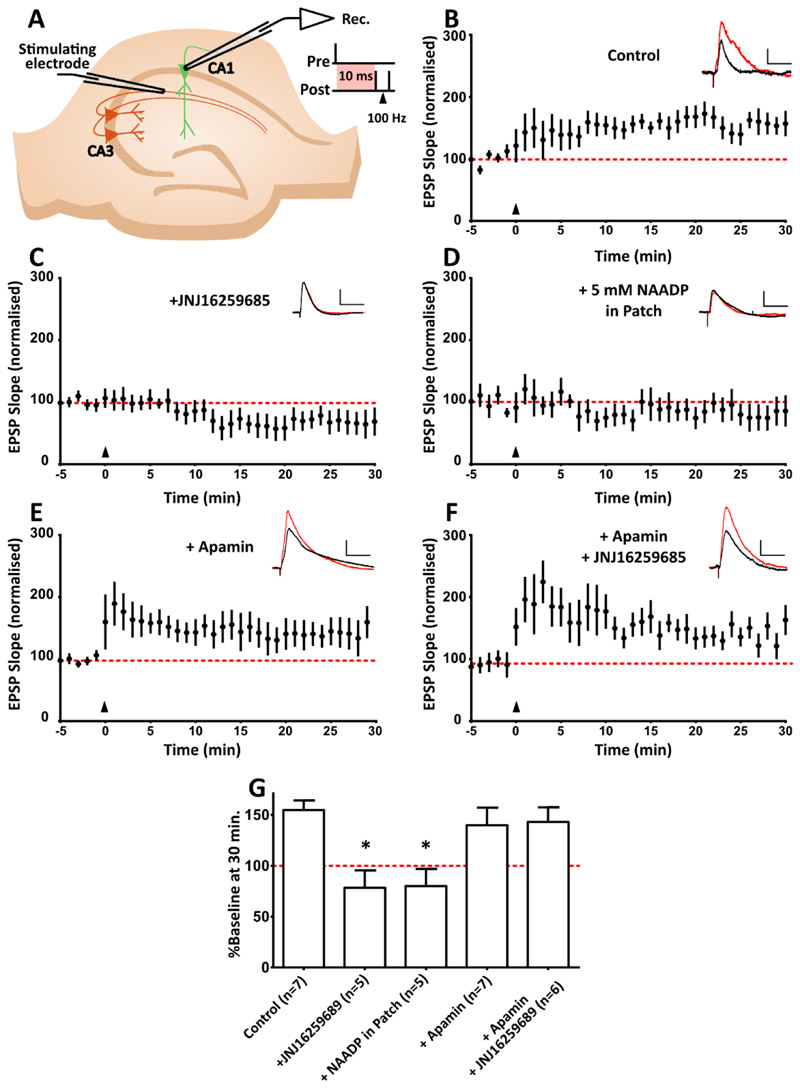
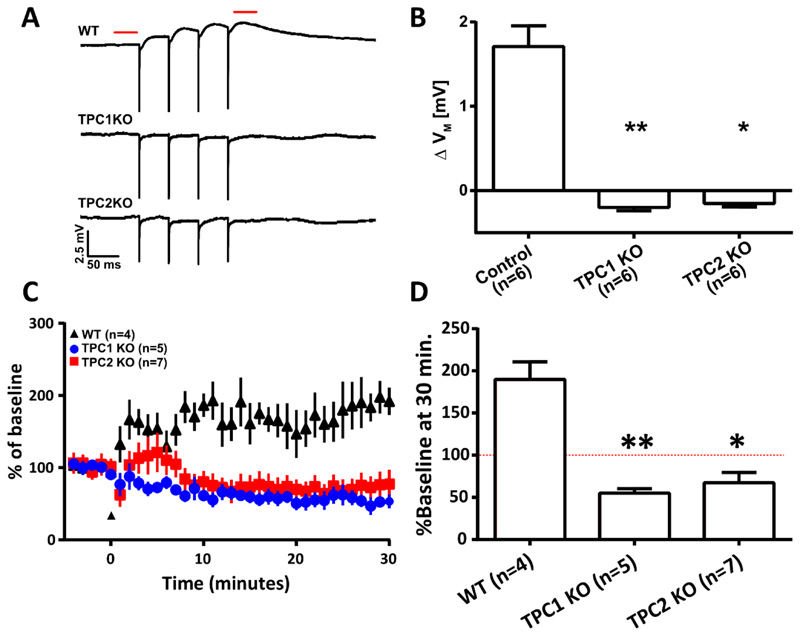
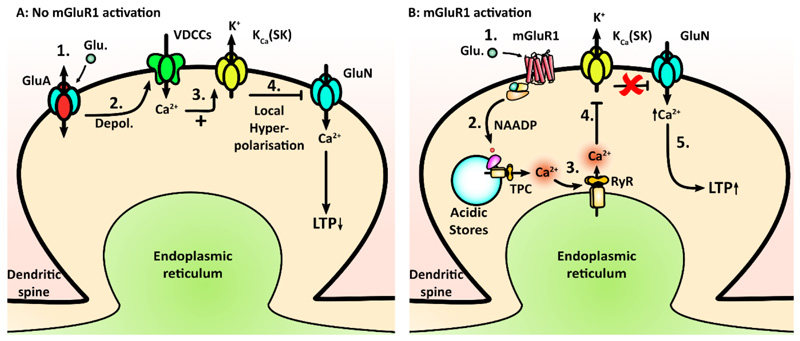
Acidic organelles, such as endosomes and lysosomes, store Ca2+ that is released in response to intracellular increases in the second messenger nicotinic acid adenine dinucleotide phosphate (NAADP). In neurons, NAADP and Ca2+ signaling contribute to synaptic plasticity, a process of activity-dependent long-term potentiation (LTP) [or, alternatively, long-term depression (LTD)] of synaptic strength and neuronal transmission that is critical for neuronal function and memory formation. We explored the function of and mechanisms regulating acidic Ca2+ store signaling in murine hippocampal neurons. We found that metabotropic glutamate receptor 1 (mGluR1) was coupled to NAADP signaling that elicited Ca2+ release from acidic stores. In turn, this released Ca2+-mediated mGluR1-dependent LTP by transiently inhibiting SK-type K+ channels, possibly through the activation of protein phosphatase 2A. Genetically removing two-pore channels (TPCs), which are endolysosomal-specific ion channels, switched the polarity of plasticity from LTP to LTD, indicating the importance of specific receptor store coupling and providing mechanistic insight into how mGluR1 can produce both synaptic potentiation and synaptic depression.


Conflict of interest statement

Competing interests: The authors declare the have no competing interests.

Figures

Figure 1
Figure 1. NAADP causes membrane depolarization in pyramidal neurons of the hippocampus in a manner dependent on acidic store signaling, intracellular Ca2+, and RyR.
(A) Diagram showing the experimental configuration to record membrane potential of CA1 or CA3 pyramidal neurons in hippocampal slices whilst NAADP-AM was applied locally. (B) Example voltage traces recorded whilst applying NAADP-AM, NAADP, or vehicle. Arrows indicate the start of delivery and grey bar indicates the total time of application. (C) Transient membrane depolarization (ΔVM) upon application of NAADP-AM (300 μM, n=12 cells), NAADP (300 μM, n=5), or vehicle (n=6). Data are mean ±SEM. (D) Mean ΔVM upon application of NAADP-AM (300 μM, n=11 cells) alone or (left to right) in combination with a desensitizing concentration of NAADP (1 mM) inside the internal solution of the patch pipette (n=6); preincubation with the NAADP antagonist Ned-19 (100 μM, 40 min, n=6); preincubation with the vacuolar H+ ATPase inhibitor bafilomycin (4 μM, 40 min, n=5); with BAPTA (15 mM) inside the internal solution of the patch pipette (n=5); or pre-incubation with ryanodine (30 μM, 40 min, n=4). Significance was assessed with; Data are mean ±SEM; n = single cells. *** P < 0.005 by Kruskal-Wallis and post hoc Dunn’s tests.
Figure 2
Figure 2. NAADP is unique among second messengers in its ability to depolarize hippocampal pyramidal neurons.
(A) Example voltage traces for dialysis of CA1 pyramidal neurons patched with internal solutions containing various concentrations of the Ca2+- mobilizing second messengers NAADP, IP3 and cADPR. Changes to membrane potential were recorded over time as the second messengers dialysed into the patched cell. (B) Transient membrane depolarization (ΔVM) of the cells described in (A) in response to increasing concentrations of the Ca2+-mobilizing second messengers. Data are mean ± SEM; n = single cells, indicated above each column; n > 4 for all concentrations of second messengers. *** P < 0.005 and * P <0.05 by Kruskal-Wallis and post hoc Dunn’s tests.
Figure 3
Figure 3. Activation of mGluR1 in CA1 pyramidal neurons causes a membrane depolarization that depends on NAADP signalling and acidic store Ca2+ signalling.
(A) Diagram showing the experimental configuration to record membrane potential of CA1 pyramidal neurons in hippocampal slices whilst mGluRs were pharmacologically isolated (50 μM AP5, 10 μM NBQX, 100 μM picrotoxin, and 2 μM CGP 55845) and electrical stimulation was applied to Schaffer collaterals (4 pulses, 20 Hz), (n=11 cells). (B) Typical voltage recordings from single cells upon electrical stimulation with pharmacological isolation of mGluRs or plus antagonism of group 2 and 3 mGluRs (LY341485 at 100 nM; n=6), panmGluRs (LY341485 at 100 μM; n=6), mGluR5 (MPEP, 10 μM; n=5) or mGluR1 (JNJ16259685, 300 nM; n=5) (top to bottom). The red lines indicate where membrane potentials were compared before and after stimulation. (C and D) Transient membrane depolarization (ΔVM) of CA1 pyramidal neurons after electrical stimulation alone (control; n=7 cells) or with the presence of (C) the mGluR antagonism described in (B), or (D) pan-mGluR antagonist [LY341485, 100 μM; n=6; cells and data set are independent from those in (C)], desensitizing concentration of NAADP inside the internal solution of the patch pipette (1 mM; n=6), NAAD inside the internal solution of the patch pipette (1 mM; n=6), preincubation with the NAADP antagonist Ned-19 (100 μM, 40 min; n=6), or acute administration of the lysosomal disrupting agent GPN (200 μM; n=5). Data are mean ± SEM; n = single cells. ** P < 0.01 and * P < 0.05 by Kruskal-Wallis and post hoc Dunn’s tests.
Figure 4
Figure 4. In CA1 pyramidal neurons, mGluR1-dependent membrane depolarization and Ca2+ release require acidic store signalling and Ca2+ release from the ER via ryanodine receptors but not IP3 receptors.
(A) Diagram showing the experimental configuration. The membrane potential of CA1 pyramidal neurons in hippocampal slices was recorded whilst mGluR1 was pharmacologically isolated and extracellular glutamate was applied. (B) Typical voltage recordings recorded upon bath application of glutamate (300 μM, 120 s) or the vehicle. (C) Columns show mean ΔVM of CA1 pyramidal neurons before and after extracellular glutamate application under control conditions (n=8) and in the presence of the lysosomal disrupting agent GPN (200 μM; n=6), ryanodine receptor antagonist ryanodine (40 μM, 15 min; n=6), IP3 receptor antagonist Xestospongin C (2 μM, 15 min; n=6), ‘fast’ Ca2+ chelator BAPTA (20 μM, 15 min; n=6), or the ‘slow’ Ca2+ chelator EGTA (20 μM, 15 min; n=6). (D) Time series images of CA1 neurons filled with Ca2+ indicator OGB-1 (1 mM) were recorded whilst mGluR1 was pharmacologically isolated (50 μM AP5, 10 μM NBQX, 100 μM picrotoxin, and 2 μM CGP 55845) and electrical stimulation was applied (4 pulses, 20 Hz). Images top to bottom: z-stack of the dendritic branch being imaged (green); Ca2+ signal at baseline, before stimulation; Ca2+ signal 300 ms after stimulation; subtraction of Ca2+ at 300 ms from baseline (purple). Scale bar, 0.5 μm. (E) ΔF/F over the imaging time course where mGluR1 was pharmacologically isolated (n=20 cells) in combination with acute application of LY341495 (100 μM, 10 min; n=5), pre-incubation with Ned-19 (100 μM, 1 hour; n=6), or acute application of ryanodine (20 μM, 10 min; n=5), xestospongin C (2 μM, 15 min; n=5), or 2-APB (50 μM, 15 min; n=5). (F) Columns show mean ΔF/F before and after electrical stimulation for each pharmacological manipulation undertaken. Significance was assessed with Kruskal-Wallis and post hoc Dunn’s tests; Error bars denote SEM, n = single cell. Significant differences indicated by asterisks where *** = P < 0.005 ** = P < 0.01 and * = P < 0.05.
Figure 5
Figure 5. In CA1 pyramidal neurons, mGluR1-dependent depolarization occurs through the inactivation of SK channels by possibly protein phosphatase 2A (PP2A).
(A and B) Representative voltage recordings (A) and mean Δ VM (B) upon electrical stimulation (4x, 20 Hz) of CA1 neurons whilst mGluR1 was pharmacologically isolated, then subsequent addition of apamin (200 nM, 15 min) and finally GPN (200 μM, 10 min); n=6 cells. (C and D) Representative voltage recordings (C) and mean Δ VM (D) upon bath application of glutamate (red arrowhead; 300 μM, 120 s) of CA1 neurons whilst mGluR1 was pharmacologically isolated, then subsequent addition of apamin (200 nM, 15 min) and finally GPN (200 μM, 10 min); n=6 cells. (E and F) Representative voltage recordings (E) and mean Δ VM (F) upon electrical stimulation (4x, 20 Hz) of CA1 neurons whilst mGluR1 was pharmacologically isolated in the absence or presence of okadaic acid (100 nM, 15 min); n=6 cells. Data are means + SEM, each from n = 6 single cells. ** P < 0.01 and * P < 0.05 (relative to mGluR1 isolation-alone condition), and n.s. = no significant difference; by Freidman’s test with post hoc Dunn’s tests (B and D) or a Wilcoxson pair matched signed ranks test (F).
Figure 6
Figure 6. In CA1 pyramidal neurons, mGluR1-dependent synaptic plasticity requires inhibition of SK channels via NAADP signalling.
(A) A causal spike-timing-dependent plasticity protocol was used to induce mGluR1-dependent LTP, in which one causal presynaptic stimulation is paired with two backpropagating action potentials (100 Hz), at a 10 ms interval. The induction protocol is delivered where t = 0, indicated by the black triangles. Example EPSP traces before (black) and after (red) STDP induction are shown at the top right of each graph. Scale bar, 5 mV x 50 ms. This STDP protocol produces LTP lasting at least 30 min (n=7 cells). (B) LTP in the STDP protocol described in (A) with mGluR1-specific antagonism with JNJ16259685 (300 nM; n=5 cells). (C) LTP as described in (A) upon prevention of NAADP/acidic store Ca2+ signalling with a desensitizing concentration of NAADP (5 mM; n=5 cells). (D) Magnitude of LTP upon induction of STDP in the presence of SK channel antagonist apamin (200 nM; n=7 cells). (E) LTP as described in (A) in the presence of apamin and JNJ16259685 (300 nM; n=6 cells). (F) Mean change in synaptic strength at 25-30 min, expressed as a % of the baseline. Data are means ± SEM, n = single cell. * P < 0.05 by Kruskal-Wallis and post hoc Dunn’s tests.
Figure 7
Figure 7. In CA1 pyramidal neurons, Two-pore channels are required for mGluR1-mediated membrane depolarization and mGluR1-dependent LTP.
(A) Representative average (5 traces) voltage recordings from CA1 neurons in hippocampal slice preparations from wild-type (WT), Tpc1-/-, and Tpc2-/- mice (n=6 mice each). Recordings were obtained upon pharmacological isolation of mGluR1 (50 μM AP5, 10 μM NBQX, 100 nM LY341495, 10 μM MPEP, 100 μM picrotoxin, and 2 μM CGP 55845) and electrical stimulation (4x, 20 Hz) of afferent fibres in stratum radiatum. Dashed red line indicates where membrane potentials were compared before and after stimulation. (B) Columns show mean ΔVM of CA1 pyramidal neurons before and after electrical stimulation described in (A). (C) A causal spike-time-dependent plasticity protocol was used to induce mGluR1-dependent LTP after a baseline of EPSPs were recorded for 5 min (indicated by marker at 0 min) in WT (n=4), Tpc1-/- (n=5) and Tpc2-/- (n=7) animals. One casual presynaptic stimulation is paired with two backpropagating action potentials (100 Hz) at a 10 ms interval. (D) Mean change in synaptic strength at 25-30 min shown/described in (C), expressed as a % of the baseline (red dashed line). Data are means ± SEM, n = single cell. ** P < 0.01 and * P < 0.05 by Kruskal-Wallis and post hoc Dunn’s tests.
Figure 8
Figure 8. Proposed model for mGluR1-dependent plasticity.
(A) Model of SK channel activation, wherein (i) synaptic glutamate activates GluA receptors to produce (ii) membrane depolarization and (iii) Ca2+ entry via VDCCs. This causes (iv) activation of SK channels and local hyperpolarisation, resulting in inhibition of GluNs by reinstating Mg2+ block, thereby reducing Ca2+ entry through the GluNs and reducing the probability of LTP induction. Where synaptic activity is sufficiently strong, the mGluR1 receptors are recruited. (B) The proposed model for SK channel inhibition mediated by mGluR1 signaling; GluA/VDCC regulation of SK channels is also present but not shown. (i) Glutamate activates mGluR1 receptors and causes (ii) NAADP synthesis, which results in (iii) acidic store Ca2+ release, which is amplified through activation of ryanodine receptors (RyR) in the ER. This somehow inactivates SK channels (iv), which in turn prevents local hyperpolarization and (v) allows greater Ca2+ entry through the GluN receptors, which facilitates the induction of LTP.

Comment in

Similar articles

Cited by

References

    1. Brailoiu E, Churamani D, Cai X, Schrlau MG, Brailoiu GC, Gao X, Hooper R, Boulware MJ, Dun NJ, Marchant JS, et al. Essential requirement for two-pore channel 1 in NAADP-mediated calcium signaling. J Cell Biol. 2009;186:201–209. - PMC - PubMed
    1. Calcraft PJ, Ruas M, Pan Z, Cheng X, Arredouani A, Hao X, Tang J, Rietdorf K, Teboul L, Chuang KT, et al. NAADP mobilizes calcium from acidic organelles through two-pore channels. Nature. 2009;459:596–600. - PMC - PubMed
    1. Zong X, Schieder M, Cuny H, Fenske S, Gruner C, Rotzer K, Griesbeck O, Harz H, Biel M, Wahl-Schott C. The two-pore channel TPCN2 mediates NAADP-dependent Ca(2+)-release from lysosomal stores. Pflugers Arch. 2009;458:891–899. - PMC - PubMed
    1. Galione A. NAADP receptors. Cold Spring Harb Perspect Biol. 2011;3 a004036. - PMC - PubMed
    1. Morgan AJ, Platt FM, Lloyd-Evans E, Galione A. Molecular mechanisms of endolysosomal Ca2+ signalling in health and disease. Biochem J. 2011;439:349–374. - PubMed

Publication types

LinkOut - more resources