. 2018 Dec 26;115(52):E12353-E12362.
doi: 10.1073/pnas.1809700115. Epub 2018 Nov 27.

Integrating host response and unbiased microbe detection for lower respiratory tract infection diagnosis in critically ill adults

Affiliations

Integrating host response and unbiased microbe detection for lower respiratory tract infection diagnosis in critically ill adults

Charles Langelier et al. Proc Natl Acad Sci U S A. .

Abstract

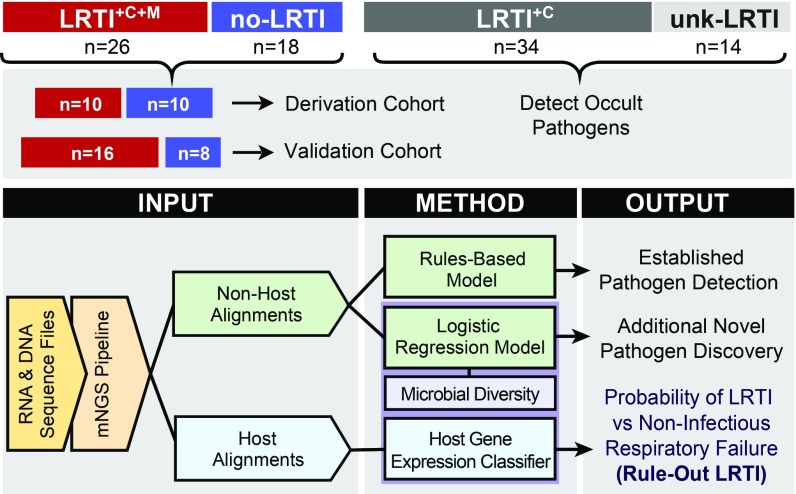
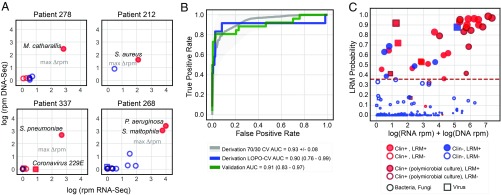
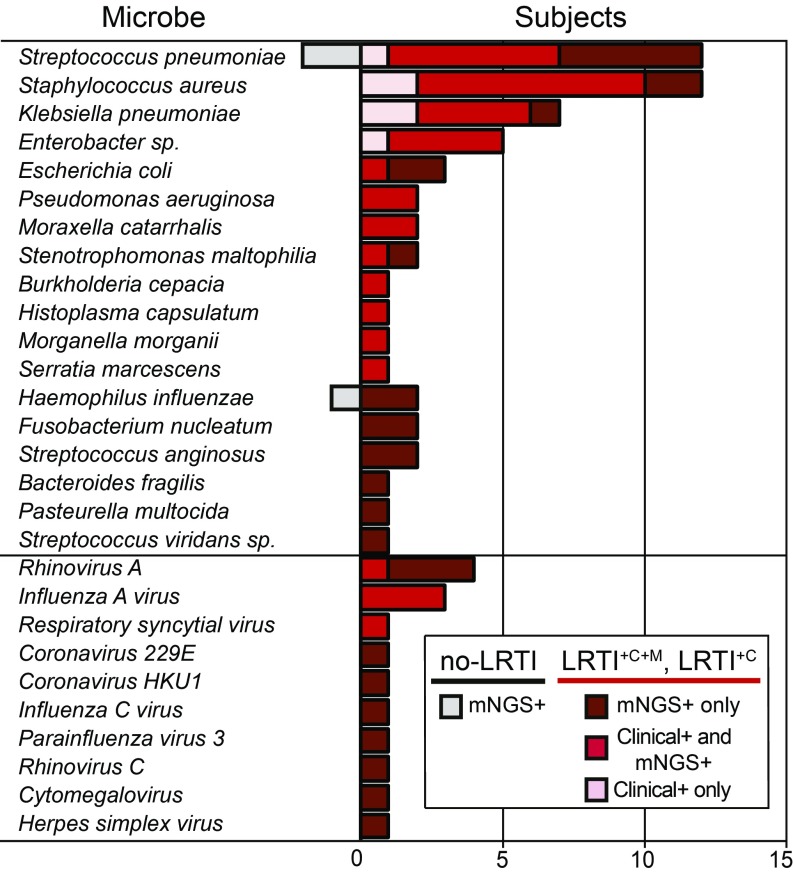
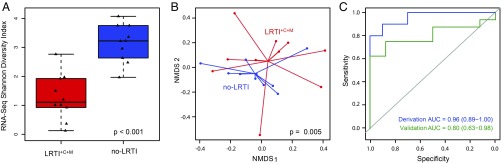
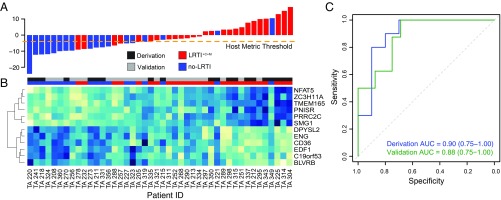
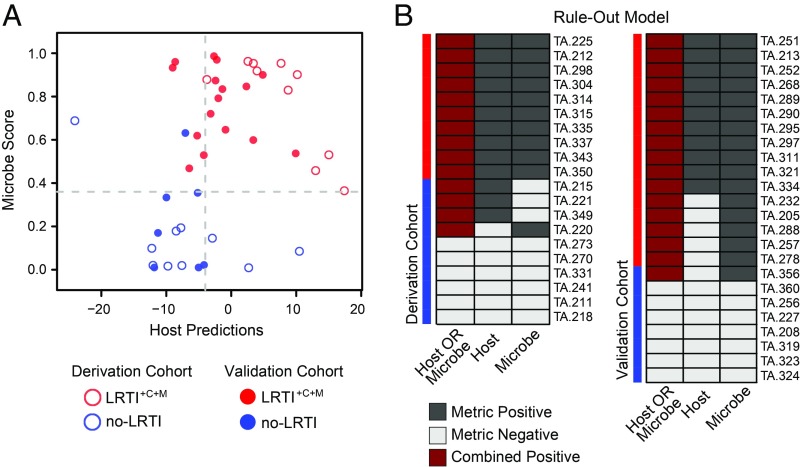
Lower respiratory tract infections (LRTIs) lead to more deaths each year than any other infectious disease category. Despite this, etiologic LRTI pathogens are infrequently identified due to limitations of existing microbiologic tests. In critically ill patients, noninfectious inflammatory syndromes resembling LRTIs further complicate diagnosis. To address the need for improved LRTI diagnostics, we performed metagenomic next-generation sequencing (mNGS) on tracheal aspirates from 92 adults with acute respiratory failure and simultaneously assessed pathogens, the airway microbiome, and the host transcriptome. To differentiate pathogens from respiratory commensals, we developed a rules-based model (RBM) and logistic regression model (LRM) in a derivation cohort of 20 patients with LRTIs or noninfectious acute respiratory illnesses. When tested in an independent validation cohort of 24 patients, both models achieved accuracies of 95.5%. We next developed pathogen, microbiome diversity, and host gene expression metrics to identify LRTI-positive patients and differentiate them from critically ill controls with noninfectious acute respiratory illnesses. When tested in the validation cohort, the pathogen metric performed with an area under the receiver-operating curve (AUC) of 0.96 (95% CI, 0.86-1.00), the diversity metric with an AUC of 0.80 (95% CI, 0.63-0.98), and the host transcriptional classifier with an AUC of 0.88 (95% CI, 0.75-1.00). Combining these achieved a negative predictive value of 100%. This study suggests that a single streamlined protocol offering an integrated genomic portrait of pathogen, microbiome, and host transcriptome may hold promise as a tool for LRTI diagnosis.

Keywords: lower respiratory tract infection; mechanical ventilation; next-generation sequencing; pneumonia; transcriptome.


Conflict of interest statement

The authors declare no conflict of interest.

Figures

Fig. 1.
Fig. 1.
Study overview and analysis workflow. Patients with acute respiratory failure were enrolled within 72 h of ICU admission, and TA samples were collected and underwent both RNA sequencing (RNA-seq) and shotgun DNA sequencing (DNA-seq). Post hoc clinical adjudication blinded to mNGS results identified patients with LRTI defined by clinical and microbiologic criteria (LRTI+C+M); LRTI defined by clinical criteria only (LRTI+C); patients with noninfectious reasons for acute respiratory failure (no-LRTI); and respiratory failure due to unknown cause (unk-LRTI). The LRTI+C+M and no-LRTI groups were divided into derivation and validation cohorts. To detect pathogens and differentiate them from a background of commensal microbiota, we developed two models: a rules-based model (RBM) and a logistic regression model (LRM). LRTI probability was next evaluated with (i) a pathogen metric, (ii) a lung microbiome diversity metric, and (iii) a 12-gene host transcriptional classifier. Models were then combined and optimized for LRTI rule out.
Fig. 2.
Fig. 2.
Workflow for distinguishing LRTI pathogens from commensal respiratory microbiota using an algorithmic approach. (A) Projection of microbial relative abundance in log reads per million reads sequenced (rpm) by RNA sequencing (RNA-seq) (x axis) versus DNA sequencing (DNA-seq) (y axis) for representative cases. In the LRTI+C+M group, pathogens identified by standard clinical microbiology (filled shapes) had higher overall relative abundance compared with other taxa detected by sequencing (open shapes). The largest score differential between ranked microbes (max Δrpm) was used as a threshold to identify high-scoring taxa, distinct from the other microbes based on abundance (line with arrows). Red indicates taxa represented in the reference list of established LRTI pathogens. (B) Receiver operating characteristic (ROC) curve demonstrating logistic regression model (LRM) performance for detecting pathogens versus commensal microbiota in both the derivation and validation cohorts. The gray ROC curve and shaded region indicate results from 1,000 rounds of training and testing on randomized sets the derivation cohort. The blue and green lines indicate predictions using leave-one-patient-out cross-validation (LOPO-CV) on the derivation and validation on the validation cohort, respectively. (C) Microbes predicted by the LRM to represent putative pathogens. The x axis represents combined RNA-seq and DNA-seq relative abundance, and the y axis indicates pathogen probability. The dashed line reflects the optimized probability threshold for pathogen assignment. Red filled circles: microbes predicted by LRM to represent putative LRTI pathogens that were also identified by conventional microbiologic tests. Blue filled circles: microbes predicted to represent putative LRTI pathogens by LRM only. Blue open circles: microbes identified by NGS but not predicted by the LRM to represent putative pathogens. Red open circles: microbes identified using NGS and by standard microbiologic testing but not predicted to be putative pathogens. Dark red outlined circles: microbes detected as part of a polymicrobial culture.
Fig. 3.
Fig. 3.
Distribution of respiratory pathogens identified in patients using clinician-ordered diagnostics versus mNGS. Number of subjects in whom each respiratory microbe was detected. All microbes detected by clinician-ordered diagnostics were detected by mNGS; however, pink bars indicate microbes misclassified as negative by either the RBM or LRM. Notably, all microbes identified by clinician-ordered diagnostics and misclassified by either the RBM or LRM (pink bars) were found in polymicrobial cultures, highlighting the presence of dominant pathogens by NGS that are not captured in the polymicrobial culture results. Red bars indicate microbes detected by clinician-ordered diagnostics and also predicted as pathogens by either the RBM or LRM. More detail on which model identified each microbe can be found in SI Appendix, Fig. S2. Dark red bars (LRTI+C+M and LRTI+C subjects) and gray bars (no-LRTI subjects) indicate number of cases with microbes detected only by mNGS.
Fig. 4.
Fig. 4.
Diversity of the transcriptionally active lung microbiome in patients with LRTI (LRTI+C+M) versus noninfectious respiratory illnesses (no-LRTI). (A) Box plots of Shannon diversity index (SDI) of the lung microbiome assessed by RNA-seq at the genus level (in the derivation cohort) differed between LRTI+C+M from no-LRTI groups. (B) The β diversity assessed by PERMANOVA on Bray–Curtis dissimilarity values in the derivation cohort differed between LRTI+C+M and no-LRTI groups. (C) ROC curve demonstrating performance of SDI to distinguish LRTI+C+M from no-LRTI groups.
Fig. 5.
Fig. 5.
Host transcriptional profiling distinguishes patients with acute LRTI (LRTI+C+M) from those with noninfectious acute respiratory illness (no-LRTI). (A) Host classifier scores for all patients in the derivation and validation cohorts; each bar indicates a patient score and is colored as follows: LRTI+C+M, red; no-LRTI, blue. Orange dotted line indicates the host classifier threshold (score, −4) that achieved 100% sensitivity in the training set and was used to classify the test set samples. (B) Normalized expression levels, arranged by unsupervised hierarchical clustering, reflect overexpression (blue) or underexpression (turquoise) of classifier genes (rows) for each patient (columns). Twelve genes were identified as predictive in the derivation cohort and subsequently applied to predict LRTI status in the validation cohort. Column colors above the heatmap indicate whether a patient belonged to the derivation cohort (dark gray) or validation cohort (light gray) and whether they were adjudicated to have LRTI+C+M (red) or no-LRTI (blue). (C) ROC curves demonstrating host classifier performance for derivation (blue) and validation (green) cohorts.
Fig. 6.
Fig. 6.
Combined LRTI prediction metric integrating pathogen detection and host gene expression. (A) Scores per patient for each of the two components of this LRTI rule-out model are projected into a scatterplot (x axis represents the host metric; y axis represents the microbe score). The thresholds optimized for sensitivity in the derivation cohort are indicated in gray dashed line. Each point represents one patient—those that were in the derivation cohort have no fill, and those that were in the validation cohort are filled. Red indicates LRTI+C+M, and blue indicates no-LRTI subjects. (B) LRTI rule-out model results for each patient are shown for both the derivation and validation cohorts, with study subjects shown in rows and metrics in columns. Dark gray indicates a metric exceeded the optimized LRTI threshold; light gray indicates it did not. Dark red indicates the subject was positive for both pathogen-plus-host metrics, and thus was classified as having LRTI. White indicates missing data.

Comment in

References

    1. World Health Organization 2017 The top 10 causes of death. Available at www.who.int/en/news-room/fact-sheets/detail/the-top-10-causes-of-death. Accessed October, 1, 2018.
    1. US Centers for Disease Control and Prevention 2018 Deaths: Leading Causes for 2016. Available at https://www.cdc.gov/nchs/fastats/leading-causes-of-death.htm. Accessed October 1, 2018.
    1. El Bcheraoui C, et al. Trends and patterns of differences in infectious disease mortality among US counties, 1980–2014. JAMA. 2018;319:1248–1260. - PMC - PubMed
    1. Jain S, et al. CDC EPIC Study Team Community-acquired pneumonia requiring hospitalization among U.S. Adults. N Engl J Med. 2015;373:415–427. - PMC - PubMed
    1. Zaas AK, et al. The current epidemiology and clinical decisions surrounding acute respiratory infections. Trends Mol Med. 2014;20:579–588. - PubMed

Publication types

LinkOut - more resources