

β-RA reduces DMQ/CoQ ratio and rescues the encephalopathic phenotype in Coq9R239X mice
- PMID: 30482867
- PMCID: PMC6328940
- DOI: 10.15252/emmm.201809466
β-RA reduces DMQ/CoQ ratio and rescues the encephalopathic phenotype in Coq9R239X mice
Abstract
Coenzyme Q (CoQ) deficiency has been associated with primary defects in the CoQ biosynthetic pathway or to secondary events. In some cases, the exogenous CoQ supplementation has limited efficacy. In the Coq9R239X mouse model with fatal mitochondrial encephalopathy due to CoQ deficiency, we have tested the therapeutic potential of β-resorcylic acid (β-RA), a structural analog of the CoQ precursor 4-hydroxybenzoic acid and the anti-inflammatory salicylic acid. β-RA noticeably rescued the phenotypic, morphological, and histopathological signs of the encephalopathy, leading to a significant increase in the survival. Those effects were due to the decrease of the levels of demethoxyubiquinone-9 (DMQ9) and the increase of mitochondrial bioenergetics in peripheral tissues. However, neither CoQ biosynthesis nor mitochondrial function changed in the brain after the therapy, suggesting that some endocrine interactions may induce the reduction of the astrogliosis, spongiosis, and the secondary down-regulation of astrocytes-related neuroinflammatory genes. Because the therapeutic outcomes of β-RA administration were superior to those after CoQ10 supplementation, its use in the clinic should be considered in CoQ deficiencies.
Keywords: 2,4‐dihydroxybenzoic acid; Q synthome; astrogliosis; mitochondrial encephalopathy; spongiosis.
© 2018 The Authors. Published under the terms of the CC BY 4.0 license.
Figures
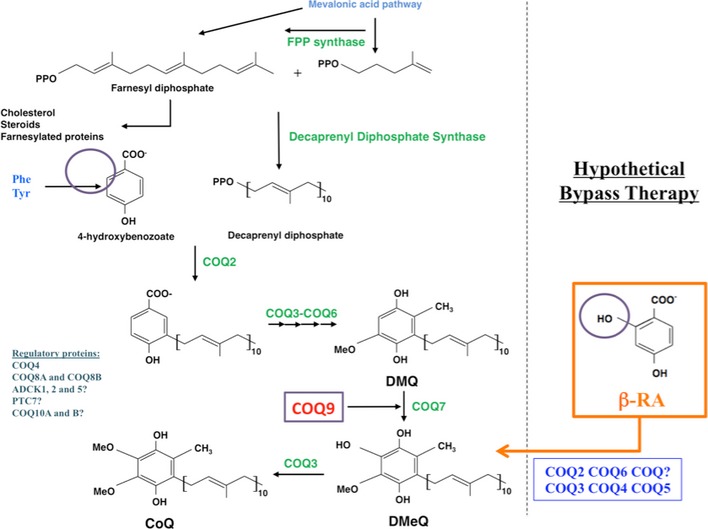
- A
Survival curve of the Coq9 +/+ mice, Coq9 R239X mice, and Coq9 R239X mice after β‐RA treatment and Coq9 R239X after ubiquinol‐10 treatment. The treatments started at 1 month of age [Log‐rank (Mantel‐Cox) test or Gehan–Breslow–Wilcoxon test; Coq9 +/+, n = 9; Coq9 R239X, Coq9 R239X after β‐RA treatment, and Coq9 R239X after ubiquinol‐10 treatment, n = 15 for each group].
- B
Survival curve of the Coq9 R239X mice and Coq9 R239X mice after β‐RA treatment started at 3 months of age (Coq9 R239X, n = 15; Coq9 R239X after β‐RA treatment, n = 10).
- C, D
Body weight of males (C) and females (D) Coq9 +/+ mice, Coq9 R239X mice, and Coq9 R239X mice after β‐RA treatment [(C): Coq9 +/+, n = from 31 to 4; Coq9 R239X, n = from 13 to 13; Coq9 R239X after β‐RA treatment, n = from 31 to 7. (D): Coq9 +/+, n = from 22 to 3; Coq9 R239X, n = from 13 to 12; Coq9 R239X after β‐RA treatment, n = from 24 to 3].
- E, F
Rotarod test of male (E) and female (F) Coq9 +/+ mice, Coq9 R239X mice, and Coq9 R239X mice after β‐RA treatment [(E): Coq9 +/+, n = from 11 to 8; Coq9 R239X, n = from 10 to 10; Coq9 R239X after β‐RA treatment, n = from 11 to 9. (F): Coq9 +/+, n = from 5 to 5; Coq9 R239X, n = from 4 to 4; Coq9 R239X after β‐RA treatment, n = from 11 to 6].
- G
Blood pressure of Coq9 +/+ mice, Coq9 R239X mice, and Coq9 R239X mice after β‐RA treatment. Data from male and female mice are represented together (Coq9 +/+, n = 6; Coq9 R239X, n = 6; Coq9 R239X after β‐RA treatment, n = 7). The whiskers down and up of the boxes indicate the minimum and maximum value, respectively. Horizontal lines inside the boxes mark the median.
- H
Comparative image of a Coq9 R239X mouse and a Coq9 R239X mouse after β‐RA treatment at 4 months of age.
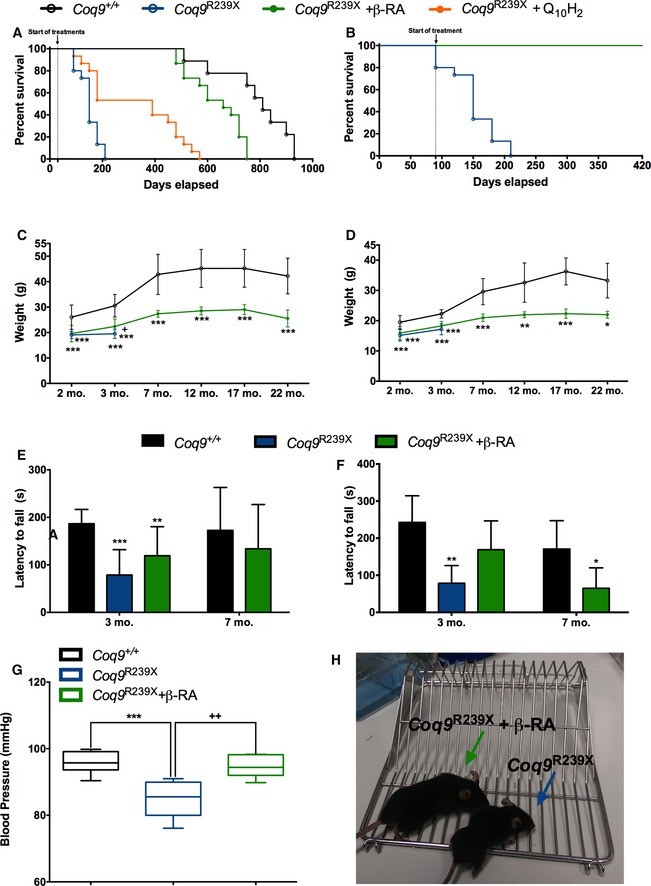
- A–U
(A1–F1) H&E stain in the diencephalon of Coq9 +/+ mice (A1 and D1), Coq9 R239X mice (B1 and E1), and Coq9 R239X mice after β‐RA treatment (C1 and F1). (G1–L1) Anti‐GFAP stain in the diencephalon of Coq9 +/+ mice (G1 and J1), Coq9 R239X mice (H1 and K1), and Coq9 R239X mice after β‐RA treatment (I1 and L1). (M1–R1) Anti‐Iba1 stain in the diencephalon of Coq9 +/+ mice (M1 and P1), Coq9 R239X mice (N1 and Q1), and Coq9 R239X mice after β‐RA treatment (O1 and R1). (S1–U1) Protein oxidation in the diencephalon of Coq9 +/+ mice (S1), Coq9 R239X mice (T1), and Coq9 R239X mice after β‐RA treatment (U1). (A2–C2) Magnetic Resonance Images of the diencephalon of Coq9 +/+ mice (A2), Coq9 R239X mice (B2), and Coq9 R239X mice after β‐RA treatment (C2). (D2–F2) Magnetic Resonance Images of the pons of Coq9 +/+ mice (D2), Coq9 R239X mice (E2), and Coq9 R239X mice after β‐RA treatment (F2). (G2–I2) Lactate peak in the brain of Coq9 +/+ mice (G2), Coq9 R239X mice (H2), and Coq9 R239X mice after β‐RA treatment (I2). Scale bars: 1 mm (A1–C1); 100 μm (D1–F1); 200 μm (G1–I1); 100 μm (J1–L1); 200 μm (M1–O1); 100 μm (P1–R1); 100 μm (S1–U1). The yellow arrows indicated the areas of increased T2 signal, which is characteristic of lesions in specific brain areas.
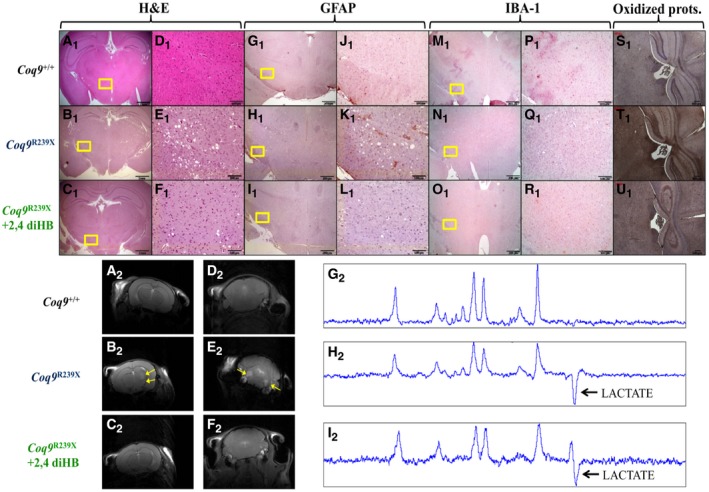
- A–C
COX stains in gastrocnemius of Coq9 +/+ mice (A), Coq9 R239X mice (B), and Coq9 R239X mice after β‐RA treatment (C).
- D–F
SDH stain in gastrocnemius of Coq9 +/+ mice (D), Coq9 R239X mice (E), and Coq9 R239X mice after β‐RA treatment (F).
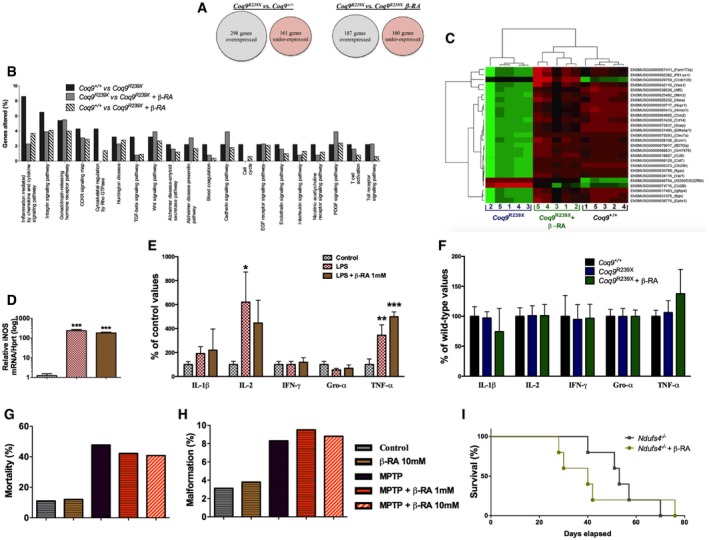
- A
Global differences in the levels of gene expression between experimental groups.
- B
Only pathways with more than one gene significantly altered in Coq9 R239X compared to Coq9 +/+ mice are considered for this figure. The y‐axis represents the percentage of genes corresponding to a pathway in the sample of genes whose expression level is significantly altered in a comparison between mice samples.
- C
Heatmap showing the comparative landscape of the expression level per sample of the 27 genes whose expression was altered by the mutation and normalized by the β‐RA treatment. The column numbers correspond to the different samples and the row names are gene codes composed of the ENSEMBL gene ID and the gene symbol (between parentheses). The green means comparatively higher, red means comparatively lower, and black means no difference in expression level (n = 5 for each group).
- D
iNOS expression levels in RAW cells after stimulation with LPS (n = 3 for each group).
- E
Cytokine levels in the culture supernatant of RAW cells after stimulation with LPS (n = 3 for each group).
- F
Cytokine levels in the brainstem of Coq9 +/+ mice, Coq9 R239X mice, and Coq9 R239X mice treated with β‐RA (n = 7 for each group).
- G, H
Mortality rate (G) and (H) percentage of malformations in zebrafish embryos treated with MPT and the effect of β‐RA treatment.
- I
Survival curve of Ndufs4 knockout mice and Ndufs4 knockout mice treated with β‐RA [Log‐rank (Mantel‐Cox) test; n = 5 for each group; see Appendix Table S3 for exact P‐values].
- A–O
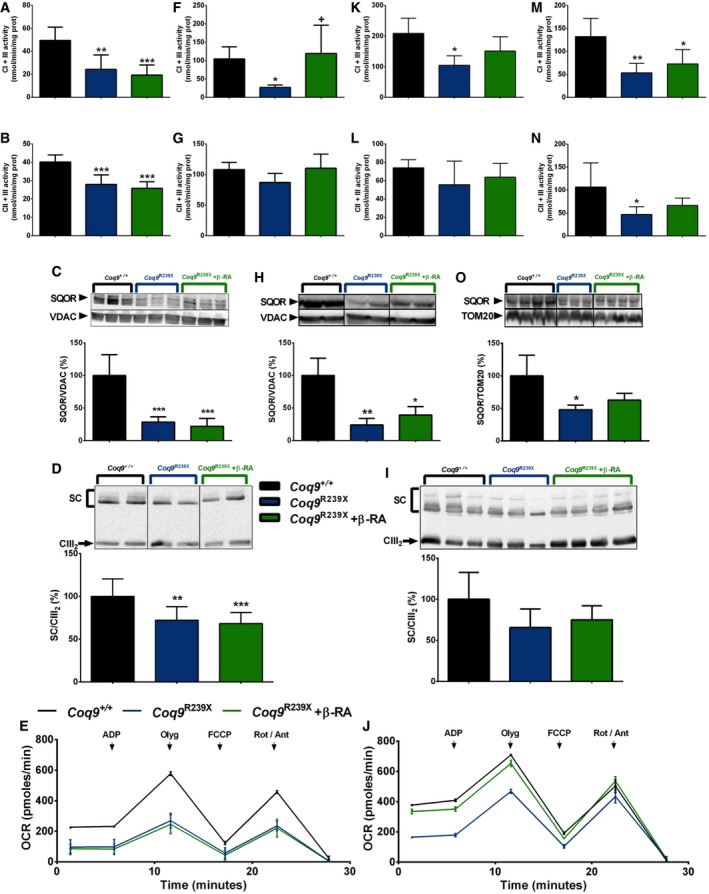
(A, F, K, M) CoQ‐dependent Complex I+III activities in brain (A) and kidneys (F), skeletal muscle (K), and heart (M). (A): Coq9 +/+, n = 5; Coq9 R239X, n = 6; Coq9 R239X after β‐RA treatment, n = 7. (F): Coq9 +/+, n = 4; Coq9 R239X, n = 6; Coq9 R239X after β‐RA treatment, n = 4. (K): Coq9 +/+, n = 3; Coq9 R239X, n = 6; Coq9 R239X after β‐RA treatment, n = 3. (M): Coq9 +/+, n = 5; Coq9 R239X, n = 6; Coq9 R239X after β‐RA treatment, n = 6). (B, G, L, N) CoQ‐dependent Complex II+III activities in brain (B) and kidneys (G), skeletal muscle (L) and heart (N). (B): Coq9 +/+, n = 5; Coq9 R239X, n = 6; Coq9 R239X after β‐RA treatment, n = 7. (G): Coq9 +/+, n = 5; Coq9 R239X, n = 6; Coq9 R239X after β‐RA treatment, n = 6. (L): Coq9 +/+, n = 5; Coq9 R239X, n = 6; Coq9 R239X after β‐RA treatment, n = 7. (N): Coq9 +/+, n = 6; Coq9 R239X, n = 6; Coq9 R239X after β‐RA treatment, n = 6. (C, H, O) Representative Western blot and quantitation of Western blot bands of SQOR in mitochondrial fractions of brain (C) and homogenates extracts from kidneys (H) and heart (O). (C): Coq9 +/+, n = 6; Coq9 R239X, n = 6; Coq9 R239X after β‐RA treatment, n = 6. (H): Coq9 +/+, n = 4; Coq9 R239X, n = 3; Coq9 R239X after β‐RA treatment, n = 3. (O): Coq9 +/+, n = 4; Coq9 R239X, n = 3; Coq9 R239X after β‐RA treatment, n = 4. (D, I) Blue‐native gel electrophoresis (BNGE) followed by C‐III immunoblotting analysis of mitochondrial supercomplexes in brain (D) and kidneys (I). (D): Coq9 +/+, n = 9; Coq9 R239X, n = 10; Coq9 R239X after β‐RA treatment, n = 11. (I): Coq9 +/+, n = 5; Coq9 R239X, n = 6; Coq9 R239X after β‐RA treatment, n = 7. (E, J) Mitochondrial oxygen consumption rate (represented as State 3o, in the presence of ADP and substrates) in brain (E) and kidneys (J). The data represent three technical replicates and the figures are representative of three biological replicates. Coq9 +/+ mice, Coq9 R239X mice, and Coq9 R239X mice after β‐RA treatment were included in all graphs. Data are expressed as mean ± SD. *P < 0.05; **P < 0.01; ***P < 0.001; Coq9 R239X or Coq9 R239X after β‐RA treatment versus Coq9 +/+. + P < 0.05; Coq9 R239X versus and Coq9 R239X after β‐RA treatment (one‐way ANOVA with a Tukey's post hoc test; see Appendix Table S4 for exact P‐values).
- A–T
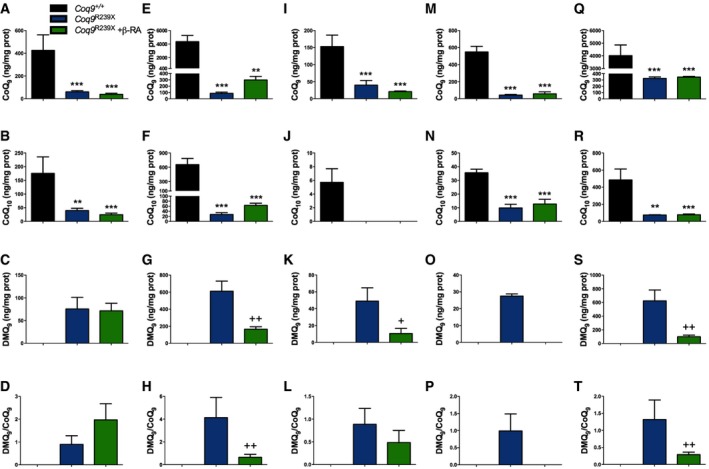
Levels of CoQ9 (A, E, I, M, Q), CoQ10 (B, F, J, N, R), and DMQ9 (C, G, K, O, S), as well as and DMQ9/CoQ9 ratio (D, H, L, P, T) in brain (A–D), kidney (E–H), liver (I–L), skeletal muscle (M–P), and heart (Q–T) of Coq9 +/+ mice, Coq9 R239X mice, and Coq9 R239X mice after β‐RA treatment. Data are expressed as mean ± SD. **P < 0.01; ***P < 0.001; Coq9 R239X or Coq9 R239X after β‐RA treatment versus Coq9 +/+. + P < 0.05; ++ P < 0.01; Coq9 R239X versus Coq9 R239X after β‐RA treatment (one‐way ANOVA with a Tukey's post hoc test or t‐test; n = 6 for each group; see Appendix Table S5 for exact P‐values). Note that DMQ9 was undetectable in tissues from Coq9 +/+ mice as well as in muscle of Coq9 R239X mice treated with β‐RA.
- A–O
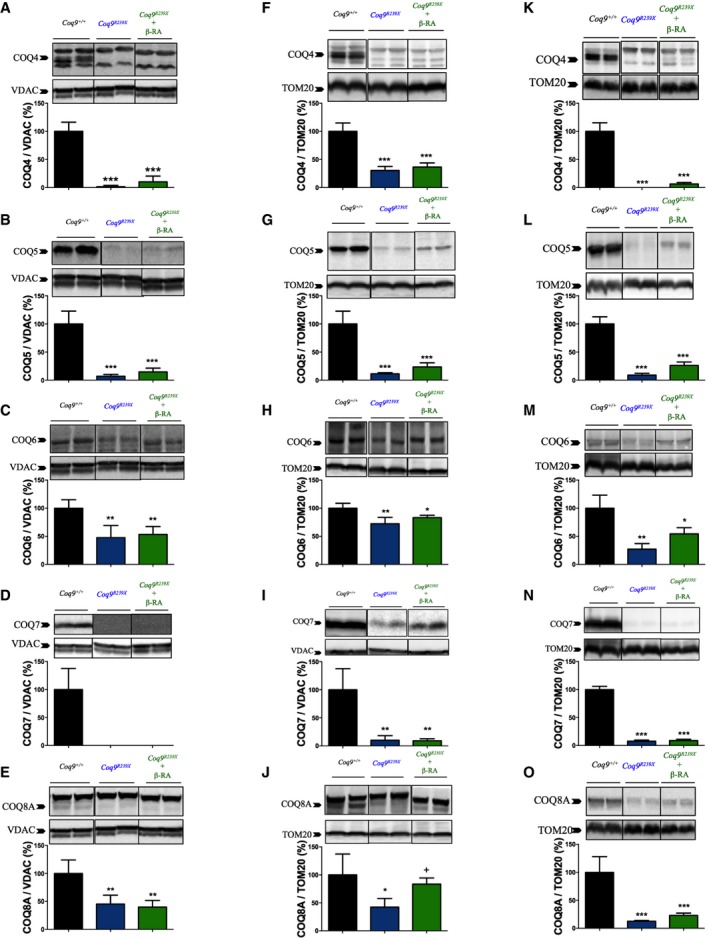
Representative images of Western blots of the CoQ biosynthetic proteins COQ4, COQ5, COQ6, COQ7, and COQ8A and the quantitation of the protein bands in the brain (A–E), kidneys (F–J), and heart (K–O) of Coq9 +/+, Coq9 R239X, and Coq9 R239X mice treated with β‐RA. Coq9 +/+ mice, Coq9 R239X mice, and Coq9 R239X mice after β‐RA treatment were included in all graphs. Data are expressed as mean ± SD. *P < 0.05; **P < 0.01; ***P < 0.001; Coq9 R239X or Coq9 R239X after β‐RA treatment versus Coq9 +/+. + P < 0.05; Coq9 R239X versus and Coq9 R239X after β‐RA treatment (one‐way ANOVA with a Tukey's post hoc test; n = 5 for each group; see Appendix Table S6 for exact P‐values).
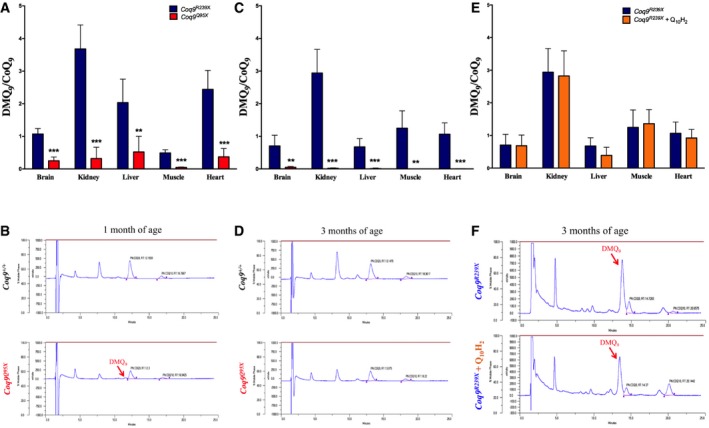
- A–F
(A) DMQ9/CoQ9 ratio in tissues from Coq9 R239X and Coq9 Q95X mice at 1 month of age. (C) DMQ9/CoQ9 ratio in tissues from Coq9 R239X and Coq9 Q95X mice at 3 months of age. (E) DMQ9/CoQ9 ratio in tissues from Coq9 R239X mice and Coq9 R239X mice treated with ubiquinol‐10 during 2 months. (B, D, F) Representative chromatographs showing the different quinones in the kidneys. Data in panels (A, C, E) are expressed as mean ± SD. **P < 0.01; ***P < 0.001; Coq9 Q95X versus Coq9 R239X (t‐test; n = 5 for each group; see Appendix Table S7 for exact P‐values).
Similar articles
-
The clinical heterogeneity of coenzyme Q10 deficiency results from genotypic differences in the Coq9 gene.EMBO Mol Med. 2015 May;7(5):670-87. doi: 10.15252/emmm.201404632. EMBO Mol Med. 2015. PMID: 25802402 Free PMC article.
-
Detection of 6-demethoxyubiquinone in CoQ10 deficiency disorders: Insights into enzyme interactions and identification of potential therapeutics.Mol Genet Metab. 2017 Jul;121(3):216-223. doi: 10.1016/j.ymgme.2017.05.012. Epub 2017 May 20. Mol Genet Metab. 2017. PMID: 28552678
-
Dysfunctional Coq9 protein causes predominant encephalomyopathy associated with CoQ deficiency.Hum Mol Genet. 2013 Mar 15;22(6):1233-48. doi: 10.1093/hmg/dds530. Epub 2012 Dec 18. Hum Mol Genet. 2013. PMID: 23255162
-
Genetic bases and clinical manifestations of coenzyme Q10 (CoQ 10) deficiency.J Inherit Metab Dis. 2015 Jan;38(1):145-56. doi: 10.1007/s10545-014-9749-9. Epub 2014 Aug 5. J Inherit Metab Dis. 2015. PMID: 25091424 Review.
-
Coenzyme Q10 deficiencies: pathways in yeast and humans.Essays Biochem. 2018 Jul 20;62(3):361-376. doi: 10.1042/EBC20170106. Print 2018 Jul 20. Essays Biochem. 2018. PMID: 29980630 Free PMC article. Review.
Cited by
-
Coenzyme Q10 modulates sulfide metabolism and links the mitochondrial respiratory chain to pathways associated to one carbon metabolism.Hum Mol Genet. 2020 Nov 25;29(19):3296-3311. doi: 10.1093/hmg/ddaa214. Hum Mol Genet. 2020. PMID: 32975579 Free PMC article.
-
The CoQ biosynthetic di-iron carboxylate hydroxylase COQ7 is inhibited by in vivo metalation with manganese but remains functional by metalation with cobalt.MicroPubl Biol. 2022 Sep 12;2022:10.17912/micropub.biology.000635. doi: 10.17912/micropub.biology.000635. eCollection 2022. MicroPubl Biol. 2022. PMID: 36176269 Free PMC article.
-
Primary Coenzyme Q10 Deficiency-7 and Pathogenic COQ4 Variants: Clinical Presentation, Biochemical Analyses, and Treatment.Front Genet. 2022 Jan 26;12:776807. doi: 10.3389/fgene.2021.776807. eCollection 2021. Front Genet. 2022. PMID: 35154243 Free PMC article. Review.
-
The Paradox of Coenzyme Q10 in Aging.Nutrients. 2019 Sep 14;11(9):2221. doi: 10.3390/nu11092221. Nutrients. 2019. PMID: 31540029 Free PMC article. Review.
-
β-RA Targets Mitochondrial Metabolism and Adipogenesis, Leading to Therapeutic Benefits against CoQ Deficiency and Age-Related Overweight.Biomedicines. 2021 Oct 13;9(10):1457. doi: 10.3390/biomedicines9101457. Biomedicines. 2021. PMID: 34680574 Free PMC article.
References
-
- Adams TB, Cohen SM, Doull J, Feron VJ, Goodman JI, Marnett LJ, Munro IC, Portoghese PS, Smith RL, Waddell WJ et al (2005) The FEMA GRAS assessment of hydroxy‐ and alkoxy‐substituted benzyl derivatives used as flavor ingredients. Food Chem Toxicol 43: 1241–1271 - PubMed
-
- Arroyo A, Santos‐Ocana C, Ruiz‐Ferrer M, Padilla S, Gavilan A, Rodriguez‐Aguilera JC, Navas P (2006) Coenzyme Q is irreplaceable by demethoxy‐coenzyme Q in plasma membrane of Caenorhabditis elegans . FEBS Lett 580: 1740–1746 - PubMed
-
- Bentinger M, Dallner G, Chojnacki T, Swiezewska E (2003) Distribution and breakdown of labeled coenzyme Q10 in rat. Free Radic Biol Med 34: 563–575 - PubMed
-
- Bhagavan HN, Chopra RK (2007) Plasma coenzyme Q10 response to oral ingestion of coenzyme Q10 formulations. Mitochondrion 7(Suppl): S78–S88 - PubMed
-
- Brzywczy J, Sienko M, Kucharska A, Paszewski A (2002) Sulphur amino acid synthesis in Schizosaccharomyces pombe represents a specific variant of sulphur metabolism in fungi. Yeast 19: 29–35 - PubMed
