

CSF progranulin increases in the course of Alzheimer's disease and is associated with sTREM2, neurodegeneration and cognitive decline
- PMID: 30482868
- PMCID: PMC6284390
- DOI: 10.15252/emmm.201809712
CSF progranulin increases in the course of Alzheimer's disease and is associated with sTREM2, neurodegeneration and cognitive decline
Abstract
Progranulin (PGRN) is predominantly expressed by microglia in the brain, and genetic and experimental evidence suggests a critical role in Alzheimer's disease (AD). We asked whether PGRN expression is changed in a disease severity-specific manner in AD We measured PGRN in cerebrospinal fluid (CSF) in two of the best-characterized AD patient cohorts, namely the Dominant Inherited Alzheimer's Disease Network (DIAN) and the Alzheimer's Disease Neuroimaging Initiative (ADNI). In carriers of AD causing dominant mutations, cross-sectionally assessed CSF PGRN increased over the course of the disease and significantly differed from non-carriers 10 years before the expected symptom onset. In late-onset AD, higher CSF PGRN was associated with more advanced disease stages and cognitive impairment. Higher CSF PGRN was associated with higher CSF soluble TREM2 (triggering receptor expressed on myeloid cells 2) only when there was underlying pathology, but not in controls. In conclusion, we demonstrate that, although CSF PGRN is not a diagnostic biomarker for AD, it may together with sTREM2 reflect microglial activation during the disease.
Keywords: Alzheimer's disease; TREM2; biomarker; microglia; progranulin.
© 2018 The Authors. Published under the terms of the CC BY 4.0 license.
Figures
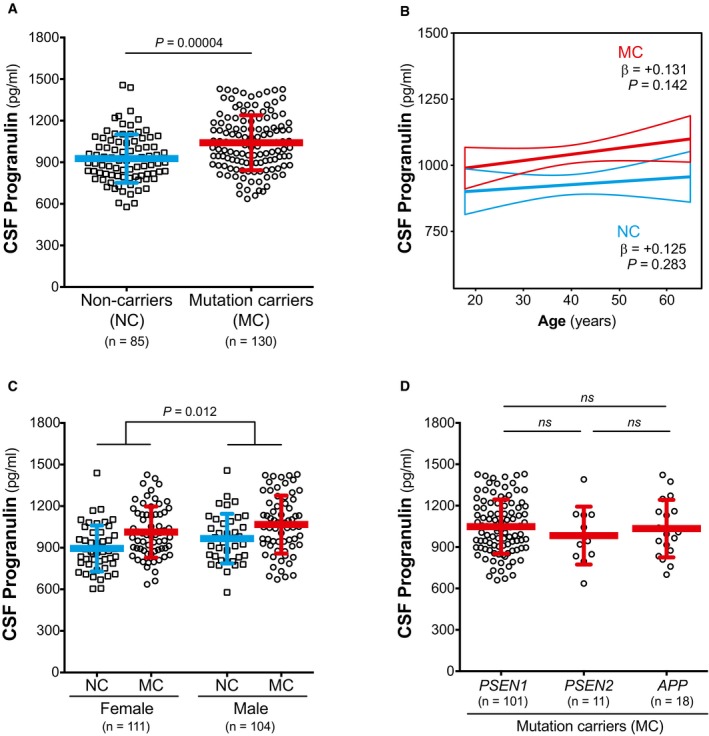
CSF PGRN is increased in mutation carriers (MC) compared to non‐carriers (NC).
CSF PGRN is not associated with age in either NC or MC.
CSF PGRN is increased in males compared to females.
CSF PGRN levels do not differ among MC participants carrying a PSEN1, PSEN2 or APP mutation.

CSF PGRN as a function of EYO in mutation carriers (MC, red) and non‐carriers (NC, blue). The solid lines indicate the regression line for each of the groups and the 95% confidence interval (CI) calculated by a linear model adjusting by gender. The interaction term of mutation status and EYO is significant (P = 0.041), also when including PGRN outliers and participants with EYO > +20 (P = 0.030). Individual data points are not displayed to prevent disclosure of mutation status.
The graph depicts the standardized differences in CSF PGRN between MCs and NCs as a function of EYO, in the context of other biomarker and cognitive changes. The curves were generated by the linear model that best fit each marker (see Statistical analysis section and Appendix Table S2). CSF PGRN is significantly increased in MC compared to NC 10 years before the expected symptom onset (shadowed area) after brain amyloidosis and brain injury (as measured by CSF T‐tau) have started, and shortly before CSF sTREM2 starts to increase.


- A, B
Scatter plots representing the association of CSF PGRN with temporo‐parietal FDG‐PET uptake (A) and total hippocampal volume (B) within the subjects of the Alzheimer's continuum group (n = 474). Each point depicts the value of CSF PGRN and the corresponding neuroimaging biomarker of a participant. The solid lines indicate the regression line and the 95% confidence interval (CI). The regression coefficients (β) and the P‐values calculated by a linear model adjusted for age, gender, APOE ε4 and education. FDG‐PET: fludeoxyglucose positron emission tomography; SUVR: standardized uptake value ratio.

Scatter plot representing the levels of CSF PGRN for each of the four biomarker profiles within each clinical staging, as defined by CDR. CDR = 1 stage comprises some biomarker profiles that do not contain enough participants to perform statistical analysis but are nevertheless shown in the figure for completeness. Each biomarker category is represented in a different colour. Healthy controls are depicted in blue, Alzheimer's continuum category in red and SNAP category in green. Purple depicts biomarker profiles not assigned in any category in the present study.
Scatter plot grouping the three biomarker categories: healthy controls, all the participants belonging to the Alzheimer's continuum category and the suspected non‐Alzheimer's pathophysiology (SNAP) category.
Solid bars represent the mean and the standard deviation (SD). P‐values were assessed by a one‐way analysis of covariance adjusted for age, gender and APOE ε4, followed by Bonferroni corrected pair‐wise post hoc comparisons. The analysis and graphs were performed excluding PGRN outliers (1 “healthy control”, 1 “Preclinical AD A+/TN−”, 4 “AD CDR = 0.5”, 3 “CDR = 0.5 A−TN−”, 1 “CDR = 0.5 A+TN−”, 1 “AD CDR = 1”). Including them yielded a similar result.


- A–H
Scatter plots representing the associations of CSF PGRN with CSF sTREM2 and each of the AD CSF core biomarkers (T‐tau, P‐tau181P and Aβ1−42) in non‐carriers (NC, blue; A, C, E and G) and in mutation carriers (MC, red; B, D, F and H). Each point depicts the value of CSF PGRN and the corresponding biomarker of a subject and the solid lines indicate the regression line and the 95% confidence interval (CI) for each of the groups. The standardized regression coefficients (β) and the P‐values are shown and were computed using a linear model adjusting for age, gender and APOE ε4. The sample contained some outliers (defined as 3 SDs below or above the group mean) of the CSF core markers of AD. The results shown in the figure are excluding these outliers. We also performed the analysis including these outliers which yielded similar results (Appendix Table S8). Aβ1–42: amyloid‐β 42; T‐tau: total tau; P‐tau: tau phosphorylated at threonine 181.

- A–L
Scatter plots representing the associations of CSF PGRN with CSF sTREM2 and each of the AD CSF core biomarkers (T‐tau, P‐tau181P and Aβ1–42) in healthy controls (blue; A, D, G and J), Alzheimer's continuum (red; B, E, H and K) and “suspected non‐Alzheimer's pathophysiology (SNAP)” groups (green; C, F, I and L). Each point depicts the value of CSF PGRN and the corresponding biomarker of a subject, and the solid lines indicate the regression line and the 95% confidence interval (CI) for each of the groups. The standardized regression coefficients (β) and the P‐values are shown and were computed using a linear model adjusting for age, gender and APOE ε4. The sample contained some outliers (defined as 3 SDs below or above the group mean) of the CSF core markers of AD, and the analysis including these outliers yielded similar results (Appendix Table S8). The Aβ1–42 values used for the association test are those based on an extrapolation curve since the upper technical limit is 1,700 pg/ml. We also tested the associations with Aβ1–42 values truncated at the upper technical limit and the result was similar. Aβ1–42: amyloid‐β 42; T‐tau: total tau; P‐tau: tau phosphorylated at threonine 181; SNAP: suspected non‐Alzheimer's pathophysiology.
Similar articles
-
Relationships of PGRN with sTREM2 in AD continuum and non-AD pathophysiology and their reciprocal roles in modulating amyloid pathology: two population-based study.Transl Psychiatry. 2025 Jul 8;15(1):233. doi: 10.1038/s41398-025-03457-6. Transl Psychiatry. 2025. PMID: 40628712 Free PMC article.
-
Microglial Reactivity Correlates with Presynaptic Loss Independent of β-Amyloid and Tau.Ann Neurol. 2024 May;95(5):917-928. doi: 10.1002/ana.26885. Epub 2024 Feb 14. Ann Neurol. 2024. PMID: 38356322 Free PMC article.
-
Early increase of CSF sTREM2 in Alzheimer's disease is associated with tau related-neurodegeneration but not with amyloid-β pathology.Mol Neurodegener. 2019 Jan 10;14(1):1. doi: 10.1186/s13024-018-0301-5. Mol Neurodegener. 2019. PMID: 30630532 Free PMC article.
-
Microglial Progranulin: Involvement in Alzheimer's Disease and Neurodegenerative Diseases.Cells. 2019 Mar 11;8(3):230. doi: 10.3390/cells8030230. Cells. 2019. PMID: 30862089 Free PMC article. Review.
-
TREM2 ectodomain and its soluble form in Alzheimer's disease.J Neuroinflammation. 2020 Jul 7;17(1):204. doi: 10.1186/s12974-020-01878-2. J Neuroinflammation. 2020. PMID: 32635934 Free PMC article. Review.
Cited by
-
Plasma cell-free RNA profiling of Vietnamese Alzheimer's patients reveals a linkage with chronic inflammation and apoptosis: a pilot study.Front Mol Neurosci. 2023 Dec 21;16:1308610. doi: 10.3389/fnmol.2023.1308610. eCollection 2023. Front Mol Neurosci. 2023. PMID: 38178908 Free PMC article.
-
The role of microglia in Alzheimer's disease and progress of treatment.Ibrain. 2022 Feb 22;8(1):37-47. doi: 10.1002/ibra.12023. eCollection 2022 Spring. Ibrain. 2022. PMID: 37786418 Free PMC article. Review.
-
Advances in Genetic and Molecular Understanding of Alzheimer's Disease.Genes (Basel). 2021 Aug 15;12(8):1247. doi: 10.3390/genes12081247. Genes (Basel). 2021. PMID: 34440421 Free PMC article. Review.
-
Cerebrospinal fluid β2-microglobulin promotes the tau pathology through microglia-astrocyte communication in Alzheimer's disease.Alzheimers Res Ther. 2025 Jan 2;17(1):2. doi: 10.1186/s13195-024-01665-8. Alzheimers Res Ther. 2025. PMID: 39748415 Free PMC article.
-
PGRN as an emerging regulator of lipid metabolism in neurodegenerative diseases.Commun Biol. 2025 Jun 2;8(1):844. doi: 10.1038/s42003-025-08272-9. Commun Biol. 2025. PMID: 40456955 Free PMC article. Review.
References
-
- Albert MS, DeKosky ST, Dickson D, Dubois B, Feldman HH, Fox NC, Gamst A, Holtzman DM, Jagust WJ, Petersen RC et al (2011) The diagnosis of mild cognitive impairment due to Alzheimer's disease: recommendations from the National Institute on Aging‐Alzheimer's Association workgroups on diagnostic guidelines for Alzheimer's disease. Alzheimers Dement 7: 270–279 - PMC - PubMed
-
- Baker M, Mackenzie IR, Pickering‐Brown SM, Gass J, Rademakers R, Lindholm C, Snowden J, Adamson J, Sadovnick AD, Rollinson S et al (2006) Mutations in progranulin cause tau‐negative frontotemporal dementia linked to chromosome 17. Nature 442: 916–919 - PubMed
-
- Bateman A, Belcourt D, Bennett H, Lazure C, Solomon S (1990) Granulins, a novel class of peptide from leukocytes. Biochem Biophys Res Commun 173: 1161–1168 - PubMed
