. 2018 Nov 27;10(11):3574-3589.
doi: 10.18632/aging.101686.

Suppression of mTORC1 activity in senescent Ras-transformed cells neither restores autophagy nor abrogates apoptotic death caused by inhibition of MEK/ERK kinases

Affiliations

Suppression of mTORC1 activity in senescent Ras-transformed cells neither restores autophagy nor abrogates apoptotic death caused by inhibition of MEK/ERK kinases

Elena Y Kochetkova et al. Aging (Albany NY). .

Abstract

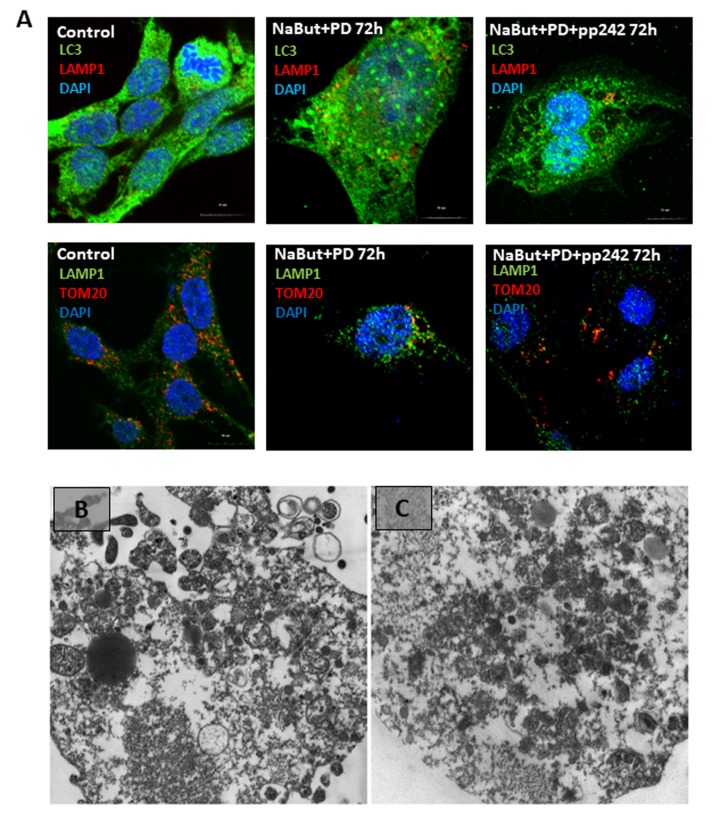
Autophagy is conservative catabolic process that degrades organelles, in particular, mitochondria, and misfolded proteins within the lysosomes, thus maintaining cellular viability. Despite the close relationship between mitochondrial dysfunction and cellular senescence, it is unclear how mitochondria damage can induce autophagy in senescent cells. We show that MEK/ERK suppression induces mitochondria damage followed by apoptosis of senescent Ras-expressing cells. To understand the role of persistent mTORC1 signaling in breaking the cAMPK-induced autophagy caused by mitochondrial damage, we inhibited mTORС1 with low concentrations of pp242. mTORC1 suppression neither restores the AMPK-induced autophagy nor decreases the level of apoptosis upon MEK/ERK inhibition. We discovered the existence of an alternative autophagy-like way that partially increases the viability of senescent cells under suppressed mTORC1. The pp242-treated cells survive due to formation of the non-autophagous LC3-negative vacuoles, which contain the damaged mitochondria and lysosomes with the following excretion the content from the cell. MEK/ERK activity is required to implement this process in senescent cells. Senescent cells exhibit distinctive spatial distribution of organelles and proteins that provides uncoupling of final participants of autophagy. We show that this feature stops the process of cytoprotective autophagy in response to MEK/ERK suppression, thus allowing selective elimination of senescent Ras-expressing cells.

Keywords: MEK/ERK; autophagy; kinase inhibitors; lysosomes; mTOR; mitochondria damage; senescence.


Conflict of interest statement

CONFLICTS OF INTEREST: Authors declare no conflicts of interests.

Figures

Figure 1
Figure 1
mTORC1 suppression does not rescue viability of senescent ERas cells exposed to the MEK/ERK inhibitor. (A)Viability of control and senescent ERas cells exposed to mTOR inhibitor pp242 (200 nM, 500 nM, 750 nM, 1500 nM), as assayed by MTT test. (B) Suppression of 4E-BP1 phosphorylation by pp242 in senescent ERas cells monitored by Western-blotting. Numbers below represent densitometry of the bands. (C) Viability of senescent ERas cells exposed to pp242 (200 nM) and MEK/ERK inhibitor PD0325901 (PD, 1 µM) assayed by MTT test. (D) Senescent cells are unable to restore proliferation after MEK/ERK suppression. Cells were exposed to NaBut, PD0325901 and pp242 for 72h then supplemented with a medium without inhibitors for 48 h. Cells were stained with Crystal Violet. (E) Senescent ERas cells undergo apoptosis upon mTORC1 and MEK/ERK suppression. DNA fragmentation analysis in 1,5% agarose gel electrophoresis. Serum- starved ERas (LS) were used as positive control for apoptotic DNA fragmentation.
Figure 2
Figure 2
mTORC1 suppression induces mitochondria damage and an increase of lysosome levels in senescent ERas cells. Mitochondria are stained with Mitotracker Orange, lysosomes are stained with Lysotracker Green and visualized at proper wavelengths. Nuclei were stained with Hoechst33342. Magnification 40x obj + zoom. Graphs below represent intensities of Mitotracker Orange and Lysotracker Green in control and treated cells, measured using ImageJ software.
Figure 3
Figure 3
mTORC1 inhibition induces an autophagy flux, which then terminates 24 h thereafter. (A) Western-blot analysis of autophagy markers and its modulators: LC3 I and II forms, phospho-Ulk1 (Ser757, Ser555), phospho-AMPK (Thr172) as well as ERK1,2 phosphorylation. (B) Expression of GFP-mRFP-pft-LC3 vector in senescent cells exposed to pp242 for 4, 24, 72 h visualizing formation of autophagosomes and fusion of autophagosomes with lysosomes. The nuclei stained with DAPI. Histogram presents the average number mRFP foci (autophagosomes fused with lysosomes) per cell after 4, 24, 72 h of mTORC1 inhibition.
Figure 4
Figure 4
Senescent cells segregate damaged mitochondria into LC3-negative vacuoles after mTORC1 suppression. (A) IF images showing segregation of damaged mitochondria in the specific LC3-negative vacuoles in senescent cells exposed to mTOR inhibitor for 72 h. Upper panel: in vivo staining with Mitotracker Green and Mitotracker Orange visualized with the Leica TSC Microscope, 40x obj + zoom. Nuclei stained with Hoechst 33342. White arrow points the damaged mitochondria (Mitotracker Green only) inside of the vacuoles. Bottom panel: IF pictures after staining with antibodies against TOM20 and LAMP1 taken on the Olympus Fluoview 3000, 60x obj. Nuclei stained with DAPI. Arrow points the mitochondria colocalized with the lysosomes. (B) TEM image of senescent ERas cell with active mTORC1 (72 h) exhibiting the non-damaged mitochondria (m) and the enriched Golgi complex (G). (C) TEM image of senescent ERas cell treated with mTOR inhibitor pp242 for 72 h exhibiting the damaged mitochondria (m). Inset presents normal non-damaged mitochondria of untreated, non-senescent ERas cell. (D) Accumulation of membranous structures (mitochondria remnants, m) in the vacuole of senescent cell upon mTORC1 suppression. (E) Accumulation of lysosomes (Lys) in the vacuole of senescent cell upon mTOR suppression. (F) The vacuole containing lysosomes and membrane structure close to the plasma membrane of senescent ERas cell treated with mTOR inhibitor. (G) Membrane and electron-dense structures excreted from the cell. Scale bars in TEM images: 1 µm; inset (B) – 0,5 µm. (H) The level of reactive oxygen species (ROS) in senescent cells after 72 h of mTOR suppression measured using DCF-DA at proper wavelength.
Figure 5
Figure 5
Senescent pp242-treated cells with disrupted autophagy form the LC3-negative cavities where lysosomes and p62/SQSTM1 accumulate. (A) IF analysis of LC3 and lysosome (LAMP1) localization in senescent cells and mTORC1- suppressed senescent cells. Arrows show LAMP1 clamps in the LC3-negative vacuole (left image) and outside of the cell (right image). Nuclei stained with DAPI. (B) Morphology of senescent cells after 72 h of mTORC1 inhibition. Arrow shows acidic clamps secreted from the cells. (C) P62/SQSTM1 accumulates in vacuoles of senescent cells exposed to pp242. Nuclei stained with DAPI.
Figure 6
Figure 6
Senescent cells exposed to high concentration of mTOR inhibitor pp242 (1500 nM) fail to rescue themselves by forming the LC3-negative vacuoles and undergo cell death. (A) IF pictures after staining with antibodies against TOM20 and LAMP1. The mitochondria and lysosomes are segregated in the vacuoles of cells exposed to 200 nM pp242, but not to 1500 nM pp242. Nuclei stained with DAPI. (B) IF with antibodies against LAMP1 and LC3. (C) Viability of senescent ERas cells treated with 1500 nM pp242 and assayed by MTT test. (D) IF with antibodies against LAMP1 and LC3 showing the absence of the mitochondria and lysosomes-containing vacuoles after mTORC1 suppression with 200 nM of rapamycin.
Figure 7
Figure 7
mTOR inhibition with pp242 uncouples mTOR from the lysosomes. (A) IF images showing pTSC2 (upper panel), mTOR (bottom panel) and lysosome (LAMP1) localization in senescent cells treated with pp242. Arrows show segregation of mTOR and pTSC2 (upper) and mTOR together with lysosomes (lower) in vacuoles and outside of cells. Nuclei stained with DAPI. (B) Western-blot analysis of mTOR levels in senescent cells after 72 h of pp242 treatment. The numbers represent densitometry of the bands.
Figure 8
Figure 8
Senescent cells require active MEK/ERK pathway to implement degradation of the damaged mitochondria through their segregation into the LC3-negative vacuoles. (A) Cells exposed to MEK/ERK inhibitor do not segregate of lysosomes in the LC3-negative vacuoles (upper panel). IF images after staining with antibodies against LC3 and LAMP1) or mitochondria (bottom panel), IF images after staining with antibodies against TOM20 and LAMP1) of the LC3-negative vacuoles. (B) TEM of a senescent cell after MEK/ERK suppression undergoing complete destruction of the cytoplasm without segregation and elimination of the damaged mitochondria. (C) TEM image of senescent cells exposed to pp242 + PD0325901 showing destruction of the cytoplasm and dispersed damaged mitochondria. Scale bars: 1 µm.

References

    1. López-Otín C, Blasco MA, Partridge L, Serrano M, Kroemer G. The hallmarks of aging. Cell. 2013; 153:1194–217. 10.1016/j.cell.2013.05.039 - DOI - PMC - PubMed
    1. Laplante M, Sabatini DM. mTOR signaling in growth control and disease. Cell. 2012; 149:274–93. 10.1016/j.cell.2012.03.017 - DOI - PMC - PubMed
    1. Kim J, Kundu M, Viollet B, Guan KL. AMPK and mTOR regulate autophagy through direct phosphorylation of Ulk1. Nat Cell Biol. 2011; 13:132–41. 10.1038/ncb2152 - DOI - PMC - PubMed
    1. Hosokawa N, Hara T, Kaizuka T, Kishi C, Takamura A, Miura Y, Iemura S, Natsume T, Takehana K, Yamada N, Guan JL, Oshiro N, Mizushima N. Nutrient-dependent mTORC1 association with the ULK1-Atg13-FIP200 complex required for autophagy. Nat Cell Biol. 2009; 20:1981–91. 10.1091/mbc.E08-12-1248 - DOI - PMC - PubMed
    1. Lee JW, Park S, Takahashi Y, Wang HG. The association of AMPK with ULK1 regulates autophagy. PLoS One. 2010; 5:e15394. 10.1371/journal.pone.0015394 - DOI - PMC - PubMed

Publication types

MeSH terms