. 2018 Dec;21(12):1742-1752.
doi: 10.1038/s41593-018-0278-y. Epub 2018 Nov 26.

Loss of neuronal network resilience precedes seizures and determines the ictogenic nature of interictal synaptic perturbations

Affiliations

Loss of neuronal network resilience precedes seizures and determines the ictogenic nature of interictal synaptic perturbations

Wei-Chih Chang et al. Nat Neurosci. 2018 Dec.

Abstract

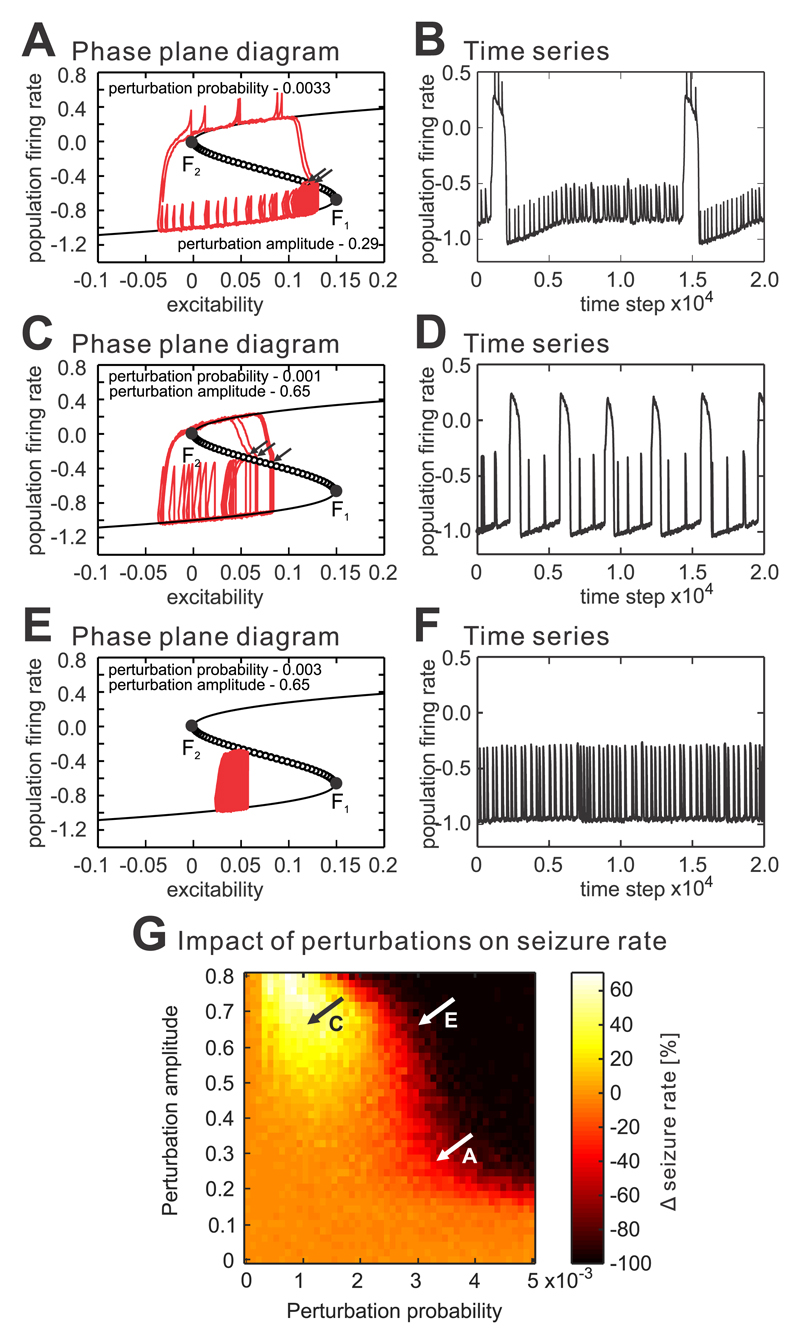
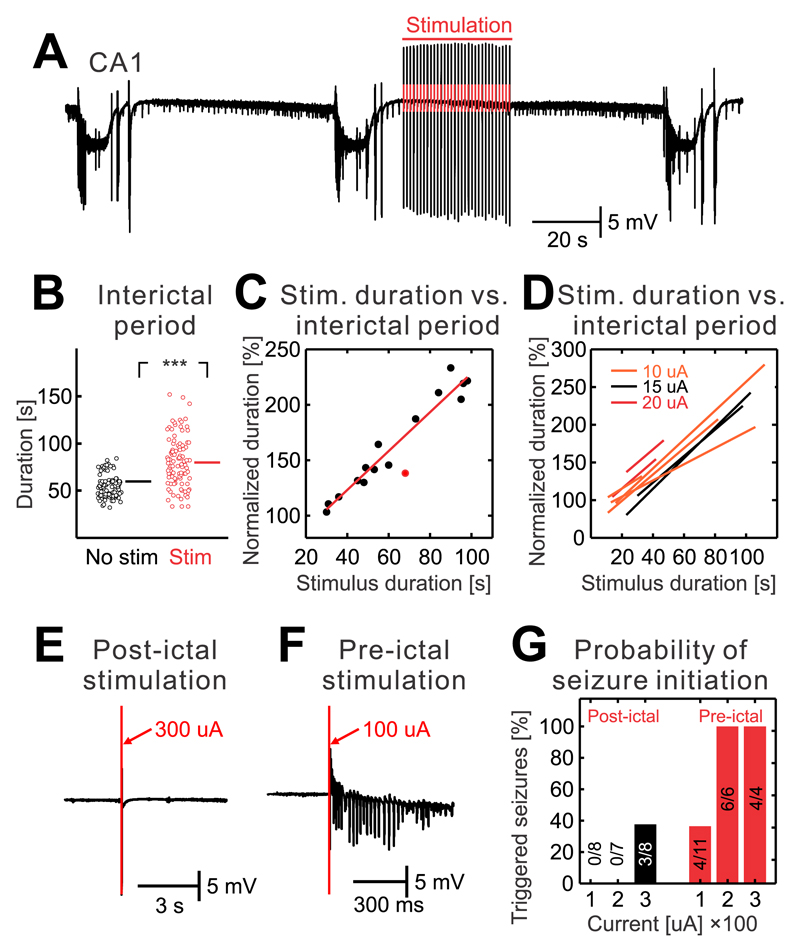
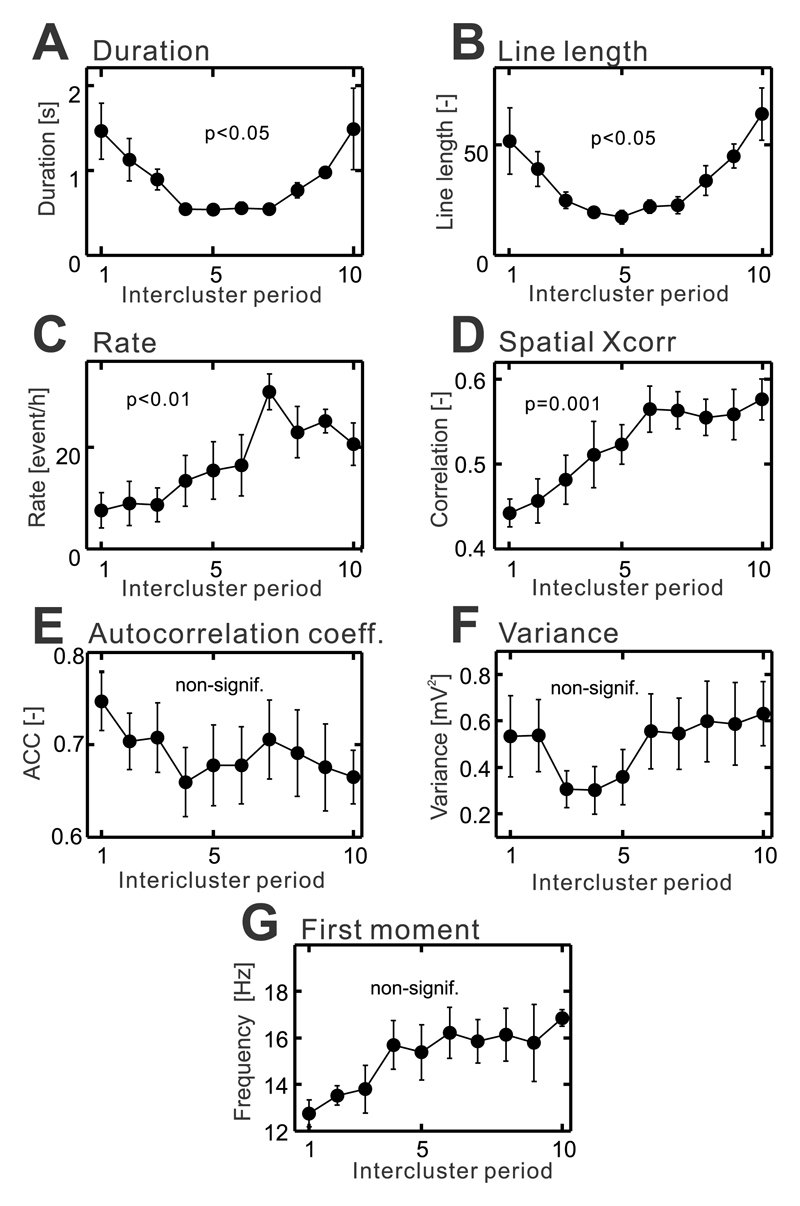
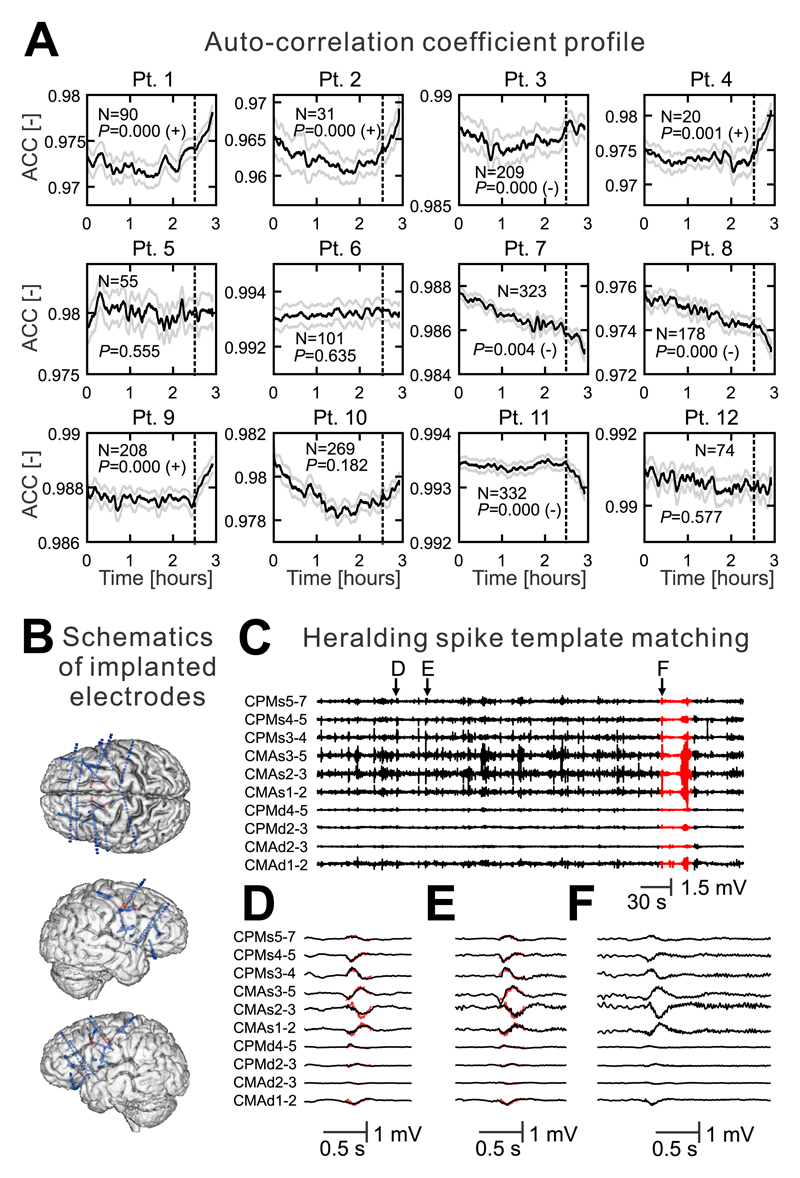
The mechanism of seizure emergence and the role of brief interictal epileptiform discharges (IEDs) in seizure generation are two of the most important unresolved issues in modern epilepsy research. We found that the transition to seizure is not a sudden phenomenon, but is instead a slow process that is characterized by the progressive loss of neuronal network resilience. From a dynamical perspective, the slow transition is governed by the principles of critical slowing, a robust natural phenomenon that is observable in systems characterized by transitions between dynamical regimes. In epilepsy, this process is modulated by synchronous synaptic input from IEDs. IEDs are external perturbations that produce phasic changes in the slow transition process and exert opposing effects on the dynamics of a seizure-generating network, causing either anti-seizure or pro-seizure effects. We found that the multifaceted nature of IEDs is defined by the dynamical state of the network at the moment of the discharge occurrence.


Conflict of interest statement

Competing Financial Interests Statement

The authors declare no competing interests.

Figures

Figure 1
Figure 1. Seizures and interictal activity in the high-potassium model.
(a) In the isolated CA1, perfusion of ACSF with a potassium concentration of 8-10 mM leads to the development of spontaneous and repeated seizure-like episodes (n=114/17 seizures/slices). (b,c) Periods between seizures are characterized by the presence of HFA ~190 Hz with superimposed unit activity. These electrographic phenomena are accompanied by decreasing DC shift (n=27/9 interictal periods/slices). (d) Time-frequency map demonstrates the progressive increase in power in a high-frequency band with approaching seizure (n=114/17 seizures/slices). (e) Detail of interictal HFA. (f) In intact hippocampal slices, seizures are also generated within the CA1 region (n=83/15 seizures/slices). (g-i) Interictal periods in the intact hippocampus are characterized by the increase in amplitude and power of HFA (n=83/15 interictal periods/slices), the negative shift in DC potential (n=24/8 interictal periods/slices) and also by the presence of interictal discharges. (j) Example of interictal HFA in intact hippocampal preparation.
Figure 2
Figure 2. Cellular properties during cycles that comprise interictal HFA.
(a) In the isolated CA1, the HFA cycle lasts around 5 ms (Supplementary Fig. 1). The cycle is characterized by an increased firing probability of principal cells during HFA troughs (n=47/4 cells/slices, Kolmogorov-Smirnov test, P<0.05). (b) An average phase histogram of interneuronal activity in the isolated CA1 (n=9/4 cells/slices, Kolmogorov-Smirnov test, P<0.05). (c) Z-value for individual neuron types and the timing of peak firing probability of individual cell. (d) The firing probability of principal cells (n=72/13 cells/slices, Kolmogorov-Smirnov test, P<0.05) and interneurons (e) (n=35/13 cells/slices, Kolmogorov-Smirnov test, P<0.05) is significantly modulated with the maximum probability around the trough of a HFA cycle. (f) Z-values of phase histogram distribution for each cell. Circles and error bars represent mean and s.e.m.
Figure 3
Figure 3. Interictal changes in HFA properties display features of early-warning signals of the critical transition to seizure.
(a) In both slice preparations, seizures are preceded by a significant increase in HFA amplitude variance (isolated CA1: n=76/17 interictal periods/slices, one-way ANOVA, F(1,7500)=154, P=0.000 for isolated CA1; intact hippocampus: n = 57/15 interictal periods/slices, one-way ANOVA, F(1,5600)=307, P=0.000). The duration of interictal periods was normalized from 0 to 1. (b) Seizures are preceded by frequency slowing, which manifests as a progressive decrease of the first moment of power spectra (isolated CA1: n=76/17 interictal periods/slices, one-way ANOVA, F(1,7500)=336, P=0.000 for isolated CA1; intact hippocampus: n=57/15 interictal periods/slices, one-way ANOVA, F(1,5600)=1830, P=0.000). (c) Autocorrelation (lag=5 ms; isolated CA1: n=76/17 interictal periods/slices, one-way ANOVA, F(1,7500)=1821, P=0.000; intact hippocampus: n=57/15 interictal periods/slices, one-way ANOVA, F(1,5600)=1726, P=0.000) and spatial correlation (d) (isolated CA1: n=8/2 interictal periods/slices, one-way ANOVA, F(1,700)=206, P=0.000; intact hippocampus: n=40/11 interictal periods/slices, one-way ANOVA, F(1,3900)=127, P=0.000) increase in advance of seizures. (e) At the single cell level, the seizures are predominantly preceded by an increase in cell firing (isolated CA1: n=56/4 cells/slices, one-way ANOVA, F(1,3900)=51, P=0.000; intact hippocampus: n=107/13 cells/slices, one-way ANOVA, F(1,4100)=9, P=0.012). (f) In both preparations, the early-warning signals are accompanied by a negative DC shift (isolated CA1: n=27/9 interictal periods/slices, one-way ANOVA, F(1,2699)=13, P=0.000; intact hippocampus: n=24/8 interictal periods/slices, one-way ANOVA, F(1,2399)=35, P=0.000). (g) In the isolated CA1, seizures are preceded by progressively increasing amplitude and duration of the response evoked by stimulations of Schaffer’s collaterals (n=24/8 interictal periods/slices, one-way ANOVA, F(1,2399)=2, P=0.000). The responses were quantified using line length measurement. Lines and shaded lines represent mean and s.e.m respectively.
Figure 4
Figure 4. Impact of IEDs on the transition to seizure.
(a) IEDs interfere with the slow process of transition to seizure and HFA. Raw data and the corresponding time-frequency plot demonstrate the suppression of HFA after each discharge. (b) Details of IEDs generated in the CA3 and propagating to the CA1. (c) The average phase histogram demonstrates that the probability of HFA occurrence substantially increases during the peak of the discharge. It is then followed by transient HFA suppression and then its gradual increase until the next IED (n=15 slices). (d) Post-discharge suppression of HFA persists throughout the course of entire period between seizures. (e) Periods between seizures in intact hippocampi (n=83/15 interictal periods/slice) have longer duration than in isolated CA1 preparations, where the IEDs are absent (n=114/17 interictal periods/slice; two-sided Mann-Whitney-Wilcoxon U test, U=1577, P=0.000). (f) Block of IEDs by NBQX and APV also shortens the interictal period (baseline recording: n=27/5 interictal periods/slices; post-NBQX+APV: 42/5 interictal periods/slices, two-sided Mann-Whitney-Wilcoxon U test, U=188, P=0.000). (g) IEDs modify the seizure initiation pattern. In isolated CA1 preparations, seizures are characterized by focal initiation and slow spread of seizure activity to the rest of the CA1. (h) In intact slices, seizures initiate instantaneously across large areas or the entire CA1 due to incoming IEDs from the CA3. (i) Cumulative histogram of the seizure spread velocity in the intact hippocampus and isolated CA1 slices demonstrates that the seizure spreads by nearly two orders faster than in the intact slice. P<0.001 (***). Line and error bars represent mean and s.e.m respectively; ***P ≤ 0.001.
Figure 5
Figure 5. The complex effect of interictal perturbations on the transition to seizure.
(a) Approximately periodic perturbations interfere with the slow-fast process, and frequent low-amplitude perturbations have an ambiguous effect on the transition to seizure. If the perturbation occurs at the moment when the system is far from the unstable fixed point (tipping point), it will lead to a transient increase in firing followed by a shift in the system’s dynamics back towards the more stable state (less excitable state). Such a perturbation has an anti-seizure property and prolongs the interictal period. In contrast, if the system is approaching the tipping point, then even small perturbations, which increase the excitability or firing rate can shift the system over the unstable fixed point and prematurely initiate the seizure (arrow). (b) The corresponding time series. (c,d) Rare high amplitude perturbations have the capacity to cross the unstable fixed (tipping) point (arrows) far in advance of catastrophic bifurcation F1 and substantially increase the seizure rate. The pro-seizure effect of the perturbation out-performs the anti-seizure effect and is also dependent on the instantaneous dynamical state of the system. (e,f) Frequent high-amplitude perturbations can completely abolish the seizure by locking the system dynamics far from the tipping point and preventing the system from crossing the unstable region into seizure. (g) The probability of occurrence and amplitude of perturbations were systematically varied. The results demonstrate that all of the currently known effects on the transition to seizure, i.e. no change, increase, decrease in seizure frequency or the complete abolishment of seizures can be reliably replicated. Animations of the selected transitions can be found as Supplementary Videos.
Figure 6
Figure 6. State-dependent effect of interictal perturbations.
(a) Seizures and interictal period without stimulation was followed by the interictal period when the train of Schaffer collateral stimulations (1 Hz) was delivered during early stages of the interictal period. The stimulation extended the duration of the interictal period. (b) The duration of interictal periods with and without early stimulations (n=213/8 stimulations/slices; two-sided Mann-Whitney-Wilcoxon U test, U=2180, P=0.000). (c) Example of an individual slice that was stimulated with an intensity of 15 μA. The results demonstrate that the duration of the interictal period increases with the duration of stimulation. Data were fitted with a regression curve. The red dot marks a stimulation, which was associated with a seizure. (d) Regression curves for individual slices and current intensities of the stimulation demonstrate the seizure-delaying effect of interictal perturbations. (e) A single stimulus of stronger intensity (300 μA) delivered during early stage of interictal period fails to induce seizures. (f) A stimulus of lower intensity (100 μA) delivered during the late phase of the interictal period has the capacity to initiate a seizure. (g) The probability of a seizure initiating effect of the stimulations delivered during the early and late stages of the interictal period (n=3 slices). During the early stages (black bars) only strong stimulations are capable of initiating seizures. During the later stage of the interictal period (red bars) both weak and strong stimulations have a higher probability to initiate seizure. Lines and error bars represent mean and s.e.m respectively; ***P ≤ 0.001.
Figure 7
Figure 7. Changes in the properties of epileptic bursts between clusters of seizures.
(a) With the approaching cluster the duration of the bursts increase (n=6/6 intercluster periods/animals, one-way ANOVA, F(1,53)=, P=0.012), as well as, the line length parameter (b) (n=6/6 intercluster periods/animals, one-way ANOVA, F(1,53)=, P=0.016). (c) The proximity to critical transition is also marked by the increasing rate of epileptic bursts (n=6/6 intercluster periods/animals, one-way ANOVA, F(1,59)=, P=0.005). (d) Increase in spatial correlation reflects enhanced propagation of bursts to the hippocampus and motor cortex increased (n=6/6 intercluster periods/animals, one-way ANOVA, F(1,53)=, P=0.001). (e) The autocorrelation (n=6/6 intercluster periods/animals, one-way ANOVA, F(1,53)=, P=0.928), signal variance (f) (n=6/6 intercluster periods/animals, one-way ANOVA, F(1,53)=, P =0.814) and the first spectral moment (g) (n=6/6 intercluster periods/animals, one-way ANOVA, F(1,53)=, P =0.128) did not show significant changes with approaching cluster. The significance of changes in temporal profiles was analyzed using one-way ANOVA. Circles and error bars represent mean and s.e.m. respectively.
Figure 8
Figure 8. The loss of resilience and state-dependent effect of IEDs in humans.
(a) Temporal profile of the autocorrelation coefficient (ACC) derived from intracranial recordings in 12 patients. The temporal profile three hours before a seizure is shown. The dashed line marks 30 minutes before the seizure during which the ACC profile was analyzed. In four patients, the ACC increases before the seizure. In four patients, ACC significantly decreases. N denotes the number of recorded seizures in each patient. P marks the value of Wilcoxon sign-rank test. The sign after the p-value indicates whether right-tailed (+) or left-tailed (–) Wilcoxon sign-rank test was significant. Lines and shaded lines represent mean and s.e.m. respectively. (b) Schematics of depth electrode implantation in a patient with refractory epilepsy. The signals from red contacts are shown. (c) An example of spontaneous activity recorded five minutes before and during the seizure (red) (d, e) Examples of the IEDs. Their waveforms and patterns of spatial distribution display a >98% match with the superimposed template of the heralding spike (red). (f) Heralding spike at the onset of a habitual seizure.

Comment in

References

    1. Fisher RS, et al. ILAE official report: a practical clinical definition of epilepsy. Epilepsia. 2014;55:475–482. - PubMed
    1. Jiruska P, et al. Synchronization and desynchronization in epilepsy: controversies and hypotheses. J Physiol. 2013;591:787–797. doi: 10.1113/jphysiol.2012.239590. - DOI - PMC - PubMed
    1. Jirsa VK, Stacey WC, Quilichini PP, Ivanov AI, Bernard C. On the nature of seizure dynamics. Brain. 2014;137:2210–2230. doi: 10.1093/brain/awu133. - DOI - PMC - PubMed
    1. Lopes da Silva F. In: Seizure Prediction in Epilepsy: From Basic Mechanisms to Clinical Applications. Schelter B, Timmer J, Schulze-Bonhage A, editors. WILEY-VCH Verlag GmbH & Co.; 2008. Epilepsy as a Disease of the Dynamics of Neuronal Networks - Models and Predictions; pp. 97–107.
    1. Beghi E, et al. Recommendation for a definition of acute symptomatic seizure. Epilepsia. 2010;51:671–675. - PubMed

Publication types

LinkOut - more resources