. 2018 Dec;21(12):1680-1688.
doi: 10.1038/s41593-018-0281-3. Epub 2018 Nov 26.

Large-scale associations between the leukocyte transcriptome and BOLD responses to speech differ in autism early language outcome subtypes

Affiliations

Large-scale associations between the leukocyte transcriptome and BOLD responses to speech differ in autism early language outcome subtypes

Michael V Lombardo et al. Nat Neurosci. 2018 Dec.

Abstract

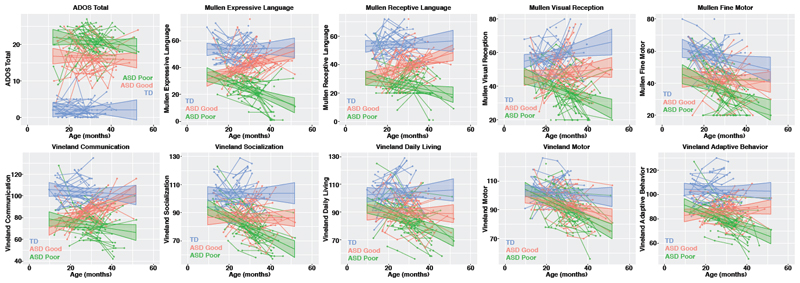
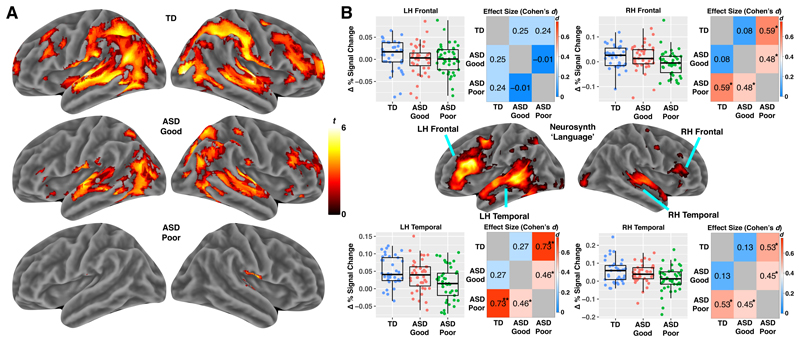
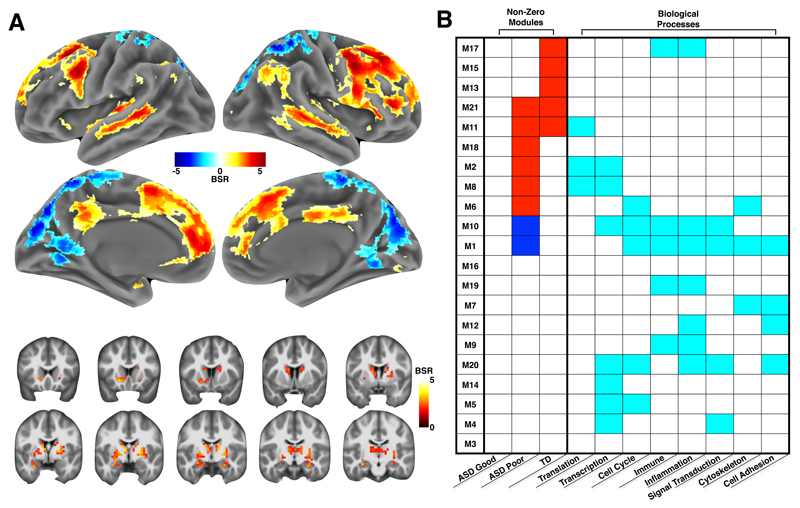
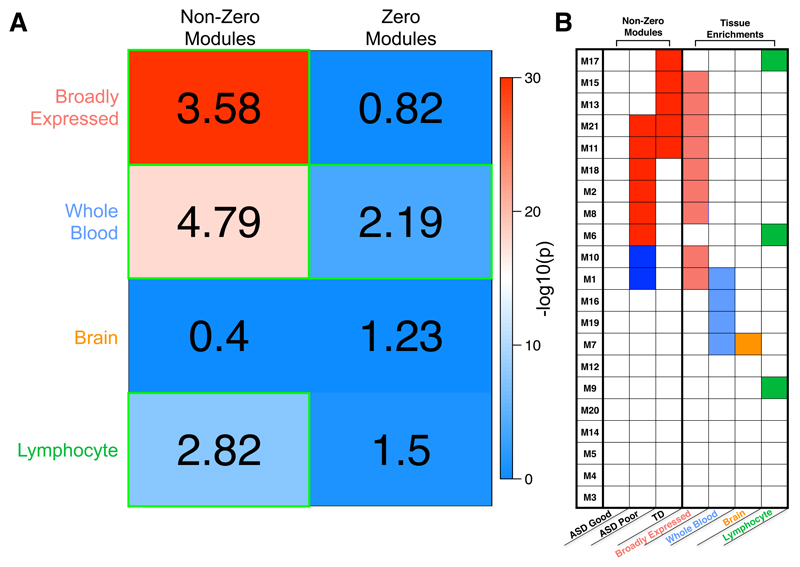
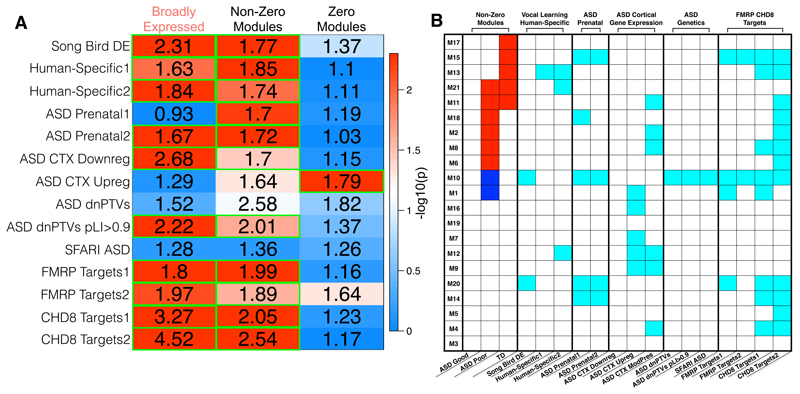
Heterogeneity in early language development in autism spectrum disorder (ASD) is clinically important and may reflect neurobiologically distinct subtypes. Here, we identified a large-scale association between multiple coordinated blood leukocyte gene coexpression modules and the multivariate functional neuroimaging (fMRI) response to speech. Gene coexpression modules associated with the multivariate fMRI response to speech were different for all pairwise comparisons between typically developing toddlers and toddlers with ASD and poor versus good early language outcome. Associated coexpression modules were enriched in genes that are broadly expressed in the brain and many other tissues. These coexpression modules were also enriched in ASD-associated, prenatal, human-specific, and language-relevant genes. This work highlights distinctive neurobiology in ASD subtypes with different early language outcomes that is present well before such outcomes are known. Associations between neuroimaging measures and gene expression levels in blood leukocytes may offer a unique in vivo window into identifying brain-relevant molecular mechanisms in ASD.


Conflict of interest statement

Competing Interests

The authors declare no competing interests.

Figures

Figure 1
Figure 1. Clinical behavioral trajectories over the first 4 years of life in typically-developing (TD) toddlers and toddlers with ASD and good or poor early language outcome.
This figure shows developmental trajectories over the first 4 years of life for typically-developing (TD) toddlers, toddlers with ASD and good early language outcome (ASD Good) and toddlers with ASD and poor early language outcome (ASD Poor) on clinical behavioral assessment measures such as ADOS total scores, Mullen Scales of Early Learning subscales (Expressive and Receptive Language, Visual Reception, and Fine Motor) and Vineland Adaptive Behavioral Scales (Communication, Socialization, Daily Living Skills, Motor, and Adaptive Behavior). The TD (n=35) group is shown in blue, ASD Good (n=40) in pink, and ASD Poor (n=41) in green. Individual level trajectories are plotted including the group-level trajectory and 95% confidence band.
Figure 2
Figure 2. Reduced fMRI response to speech in ASD toddlers with poor early language outcome.
Panel A shows results of whole-brain analyses (one-tailed t-test) on each group separately (results shown at FDR q<0.05) (TD n = 37; ASD Good n = 40; ASD Poor n = 41). Panel B shows the results of region-of-interest (ROI) analyses testing for subtype differences. ROIs are defined by 4 regions within the Neurosynth ‘Language’ meta-analysis map in left (LH) or right hemisphere (RH) frontal and temporal cortex. ROI data are shown for each individual in the scatter-boxplots (TD, blue, n = 37; ASD Good, pink, n = 40; ASD Poor, green, n = 41). The box in the boxplots indicates the interquartile range (IQR; Q1 indicates the 25th, while Q3 indicates the 75th percentile) and the whiskers indicate Q1-(1.5*IQR) or Q3+(1.5*IQR). The line within the box represents the median. Matrices next to the scatter-boxplots show standardized effect sizes (Cohen’s d) for each pairwise group comparison. Cohen’s d is shown in each cell and also indicated by the color of the cell. Within each cell one star (*) indicates p<0.05, while two stars (**) indicates p<0.005.
Figure 3
Figure 3. Multivariate gene co-expression-fMRI association in ASD with good or poor early language outcome and typically-developing control toddlers.
Panel A shows the brain regions with the strongest contributions to the multivariate gene co-expression–fMRI association present in the LV1 PLS result. The coloring in each region indicates the bootstrap ratio (BSR) and reflects how important each voxel is to the LV1 PLS result. Areas are shown in panel A if the BSR ≥ 1.96 or BSR ≤ -1.96. Hot colored regions in panel A are interpreted as showing a positive gene co-expression–fMRI correlation — that is, as a module’s eigengene increases, functional activation in response to speech also increases. In contrast, cool colored areas in panel A indicate a negative correlation between a module’s eigengene and functional activation response to speech. The table in panel B describes which modules were the strongest contributors to the LV1 PLS result. Each row indicates one of the 21 co-expression modules used in the PLS analysis. The columns labeled with the heading ‘Non-Zero Modules’ are broken down to indicate gene co-expression–fMRI correlations by group. Cells in these columns are colored red or blue if the gene co-expression–fMRI correlation was non-zero and had 95% confidence intervals (estimated from bootstrapping) that did not include a correlation of 0. These modules are called ‘non-zero’ modules, as they are the strongest contributors or modules of importance to the LV1 PLS result. All other modules with white colored cells are labeled ‘zero’ modules, as the 95% confidence intervals for the gene co-expression–fMRI correlation include 0. Non-zero modules have cells colored in red to indicate a positive gene co-expression–fMRI correlation (i.e. congruent with the interpretation already stated for the hot and cool colored regions in panel A). However, in the case of non-zero modules with cells colored in blue, the previously stated way to interpret the hot and cool colored regions in panel A should reverse (e.g., cool colored regions in panel A reflect positive correlations with a module’s eigengene, while hot colored regions in panel A reflect negative correlations with a module’s eigengene). The remaining columns in panel B with the heading ‘Biological Processes’ annotate each module for enrichments in biological process terms from Metacore GeneGO software. Cyan colored cells indicate modules with enrichments passing FDR q<0.05 for multiple comparison correction. For a complete description of these biological process enrichments, please see Supplementary Table 5.
Figure 4
Figure 4. Tissue class enrichments with sets of non-zero or zero association modules.
Enrichments with different classes of genes taken from the Boyle et al., (2017) analysis of tissue-specific or broadly expressed genes from GTEx data. Within panel A, the numbers in each cell represent the enrichment odds ratio, while the coloring represents the –log10 p-value for each hypergeometric test for enrichment. Cells outlined in green pass multiple comparison correction at FDR q<0.05. In panel B, we show all gene co-expression modules (rows) and whether they are enriched for each tissue class (columns). Modules with enrichments passing FDR q<0.05 for multiple comparison correction are indicated as colored cells. The first 3 columns show which modules are those with non-zero associations (colored cells), as shown in Fig. 3b.
Figure 5
Figure 5. Vocal learning, human-specific, and ASD-associated enrichments with sets of broadly expressed genes and non-zero or zero association modules.
Panel A shows the results of hyperogeometric tests for enrichment between broadly expressed genes, non-zero, and zero modules (columns) and a variety of different gene lists (rows) relevant to vocal learning, human-specific genes, or genes of relevance to ASD. The numbers in each cell represent the enrichment odds ratio, while the coloring represents the –log10 p-value for each hypergeometric test for enrichment. For details about the gene lists specified in each row, see the Methods section. Cells outlined in green pass multiple comparison correction at FDR q<0.05. Panel B shows a table to indicate which gene co-expression modules (rows) are enriched for a variety of different gene lists (columns). Modules with enrichments passing FDR q<0.05 for multiple comparison correction are indicated as cyan colored cells. The first 3 columns show which modules are those with non-zero associations (colored cells), as shown in Fig. 3b.

References

    1. Geschwind DH, Levitt P. Autism spectrum disorders: developmental disconnection syndromes. Curr Opin Neurobiol. 2007;17:103–111. - PubMed
    1. Happe F, Ronald A, Plomin R. Time to give up on a single explanation for autism. Nat Neurosci. 2006;9:1218–1220. - PubMed
    1. Lai MC, Lombardo MV, Chakrabarti B, Baron-Cohen S. Subgrouping the autism "spectrum": reflections on DSM-5. PLoS Biol. 2013;11:e1001544. - PMC - PubMed
    1. Kapur S, Phillips AG, Insel TR. Why has it taken so long for biological psychiatry to develop clinical tests and what to do about it? Mol Psychiatry. 2012;17:1174–1179. - PubMed
    1. Lombardo MV, Lai MC, Baron-Cohen S. Big data approaches to decomposing heterogeneity across the autism spectrum. bioRxiv. 2018 doi: 10.1101/278788. - DOI - PMC - PubMed

Publication types