. 2018 Nov 13:11:416.
doi: 10.3389/fnmol.2018.00416. eCollection 2018.

Developmental Changes in the Inhibition of Glycinergic Synaptic Currents by Niflumic Acid in Hypoglossal Motoneurons

Affiliations

Developmental Changes in the Inhibition of Glycinergic Synaptic Currents by Niflumic Acid in Hypoglossal Motoneurons

Elena Petukhova et al. Front Mol Neurosci. .

Abstract

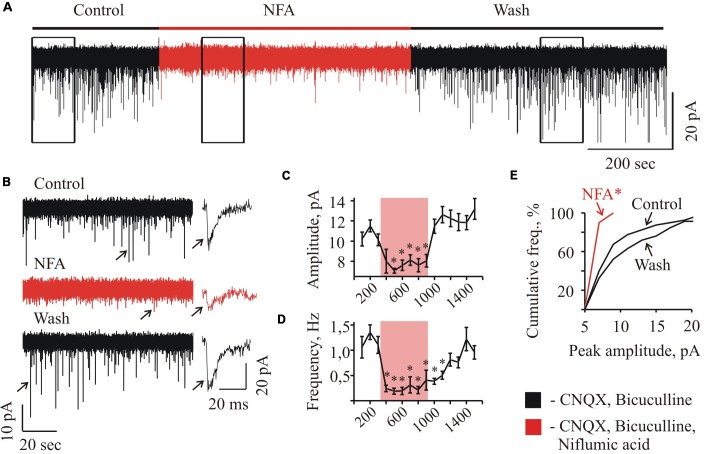
Mammalian brainstem hypoglossal motoneurones (HMs) receive powerful synaptic glycinergic inputs and are involved in a variety of motor functions, including respiration, chewing, sucking, swallowing, and phonation. During the early postnatal development, subunit composition of chloride-permeable glycine receptors (GlyRs) changes leading to a decrease of "fetal" alpha2 and elevation of "adult" alpha1 GlyR subunits. It has been recently demonstrated that niflumic acid (NFA), a member of the fenamate class of non-steroidal anti-inflammatory drugs, is an efficient subunits-specific blocker of GlyRs. At a heterologous expression of different GlyR subunits it has been shown that blocking potency of NFA is more than one order higher for alpha2 GlyRs than for receptors formed by alpha1 subunit. To reveal the action of NFA on the synaptic activity we analyzed here the effects of NFA on the glycinergic inhibitory post-synaptic currents in the HMs from mouse brainstem slices. In the whole-cell patch clamp configuration, the amplitude and the frequency of glycinergic synaptic currents from two age groups have been analyzed: "neonate" (P2-P4) and "juvenile" (P7-P12). Addition of NFA in the presence of antagonists of glutamate and GABA receptors caused a decrease in the mean amplitude and frequency of synaptic events. The degree of the inhibition induced by NFA decreased with the postnatal development, being higher on the motoneurons from "neonate" brainstem slices in comparison with the "juvenile" age group. Analysis of the pair-pulse facilitation suggests the post-synaptic origin of NFA action. These observations provide evidence on the developmental changes in the inhibition by NFA of glycinergic synaptic transmission, which reflects increase in the alpha1 and decrease in the alpha2 GlyR subunits expression in synapses to hypoglossal motoneurons during the early stages of postnatal life.

Keywords: anion-selective channels; brainstem slices; glycine receptors; hypoglossal motoneurons; niflumic acid; patch-clamp recordings.


Figures

FIGURE 1
FIGURE 1
Whole-cell recordings of glycinergic synaptic currents from HMs in brainstem slices from mice of different ages. (A) Photo of brainstem slice showing the area of hypoglossal nucleus (HN) and the location of recording (Rec.) and stimulating (Stim.) electrodes. Age P3. (B) Microphotograph of HN ar higher amplification showing the recording electrode on the motoneuron. Age P8. (C) Traces of whole-cell recordings illustrating spontaneous glycinergic IPSCs, recorded from neonatal (P3, top trace) and juvenile (P10, bottom trace) mice. On the right single events are shown at higher resolution. Here and in the other figs all recordings are in the presence of CNQX 20 μM and bicuculline 20 μM. Vhold = –70 mV. (D) Examples of glycinergic eIPSCs recorded from motoneurons in neonatal (P3) and juvenile (P10) mice brainstem slices. Averaged traces of 10 individual eIPSCs induced by presynaptic stimulation are presented. Notice faster decay kinetics of IPSCs in the juvenile motoneuron. Vhold = –70 mV. (E) Summary of the average decay time constants of glycinergic eIPSCs in neonatal (n = 8) and juvenile (n = 10) groups. Values are mean ± SEM. (F,G) Summary of the mean amplitude and frequency of spontaneous glycinergic IPSCs in neonatal and juvenile groups (n = 6). Values are mean ± SEM. Significant difference (P < 0.05) (one-way ANOVA test with Bonferroni correction). (H) Trace illustrating complete inhibition of spontaneous IPSCs, at addition of strychnine to aCSF containing CNQX and bicuculline. Vhold = –70 mV. Age P12.
FIGURE 2
FIGURE 2
Effect of NFA on sIPSCs recorded from “neonatal” HMs. (A) Trace of continuous whole-cell recording of sIPSCs, illustrating the effect of 100 μM NFA at HM from P3 mice. The duration of NFA application is highlighted by red. Vhold = –70 mV. (B) Examples of segments from the trace (A) indicated by rectangular frames at 10-fold faster time scale; recording was performed in the control conditions (a), in the presence of NFA (b), and during wash (c). On the right single events are shown (marked on traces by arrows) at1000-fold higher time resolution. Graphs showing the time course of the development of NFA effect on the amplitude (C) and frequency (D) of spontaneous glycinergic IPSCs. Each point represents the mean ± SEM of values during 100 s. Duration of NFA action is highlighted by transparent red. Significant difference from “Control” with P < 0.05 (one-way ANOVA test with Bonferroni correction). (E) Cumulative frequency distribution of peaks amplitudes. Note drastically decreased number of sIPSCs with amplitude more than 10 pA in the presence of NFA. Significant difference from “Control” and “Wash” with P < 0.05 (two sample Kolmogorov–Smirnov test).
FIGURE 3
FIGURE 3
Effect of NFA on sIPSCs in “juvenile” HMs. (A) Representative traces of sIPSCs whole-cell recordings in control (top), 1.7 min after addition of 100 μM NFA (middle) and 10 min of wash with aCSF (bottom). P9 HM. Vhold = –70 mV. (B) Mean percent ± SEM of sIPSCs amplitude (left) and frequency (right) inhibition by 100 μM NFA. Significant difference with P < 0.05 (one-way ANOVA test with Bonferroni correction). (C) Cumulative frequency distribution of peaks amplitudes in control (a) during NFA application (b) and wash (c). Significant difference from “Control” and “Wash” with P < 0.05 (two sample Kolmogorov–Smirnov test).
FIGURE 4
FIGURE 4
Summary of inhibitory effect of NFA on spontaneous glycinergic IPSCs in HM from “neonatal” and “juvenile” age groups. Average percentage of sIPSCs amplitude (A) and frequency (B) decrease during application of 100 μM NFA. Recordings in the presence of 20 μM bicuculline and 10 μM CNQX at Vhold = –70 mV. Data from nine “neonatal” and from seven “juvenile” MNs. Significant difference from “Control” (P < 0.05). One-way ANOVA test with Bonferroni correction.
FIGURE 5
FIGURE 5
Effect of NFA on evoked glycinergic IPSCs in neonatal and juvenile HMs at different membrane potentials. (A,B) Examples of eIPSCs at pair-pulse stimulation in control condition, under 100 μM NFA action and after washing (as indicated by arrows) in the neonatal (A) and juvenile (B) MNs. Whole-cell recordings at holding potentials +30 mV (top traces) and –70 mV (bottom traces). Recording made after 3 min of incubation in NFA are shown in red. For each age traces at positive and negative potentials are shown from the same motoneuron. Notice stronger inhibition for neonatal motoneuron currents at positive potential and weaker effect of NFA on juvenile cell. To ensure that eIPSCs were glycinergic, at the end of each experiment eIPSCs were induced in the presence of strychnine. (C) Summary of the percentage of decrease of the amplitudes of eIPSCs under NFA application in the neonatal (n = 4) and juvenile (n = 5) groups, at two different holding potentials: –70 mV and +30 mV. Values are presented as percentages from initial levels. Significant difference (P < 0.05).
FIGURE 6
FIGURE 6
Niflumic acid did not change the ratio of IPSCs at pair-pulse stimulation. (A,B) Traces of glycinergic IPSCs evoked by a paired stimulation (50 ms interval) before (Control) and during NFA application (NFA) to “neonatal” (A) and “juvenile” brainstem slices. Left: examples of superimposed traces, Right: same traces, scaled to control amplitude of the first stimulation. Notice absence of changes in the amplitude of the second pulse during the action of NFA. Recording from P3 and P10 HMs. (C) Summary of relative I2/I1 ratio during NFA action in percentages from initial levels for the “neonatal” (n = 4) and “juvenile” (n = 7) MNs, as indicated. Mean ± SEM.

Similar articles

Cited by

References

    1. Akagi H., Miledi R. (1988). Heterogeneity of glycine receptors and their messenger RNAs in rat brain and spinal cord. Science 242 270–273. 10.1126/science.2845580 - DOI - PubMed
    1. Balderas E., Ateaga-Tlecuitl R., Rivera M., Gomora J. C., Darszon A. (2012). Niflumic acid blocks native and recombinant T-type channels. J. Cell. Physiol. 227 2542–2555. 10.1002/jcp.22992 - DOI - PMC - PubMed
    1. Becker C. M., Hoch W., Betz H. (1988). Glycine receptor heterogeneity in rat spinal cord during postnatal development. EMBO J. 7 3717–3726. 10.1002/j.1460-2075.1988.tb03255.x - DOI - PMC - PubMed
    1. Betz H. (1991). Glycine receptors: heterogeneous and widespread in the mammalian brain. Trends Neurosci. 14 458–461. 10.1016/0166-2236(91)90045-V - DOI - PubMed
    1. Betz H., Laube B. (2006). Glycine receptors: recent insights into their structural organization and functional diversity. J. Neurochem. 97 1600–1610. 10.1111/j.1471-4159.2006.03908.x - DOI - PubMed

LinkOut - more resources