

Large Volume Electron Microscopy and Neural Microcircuit Analysis
- PMID: 30483066
- PMCID: PMC6240581
- DOI: 10.3389/fncir.2018.00098
Large Volume Electron Microscopy and Neural Microcircuit Analysis
Abstract
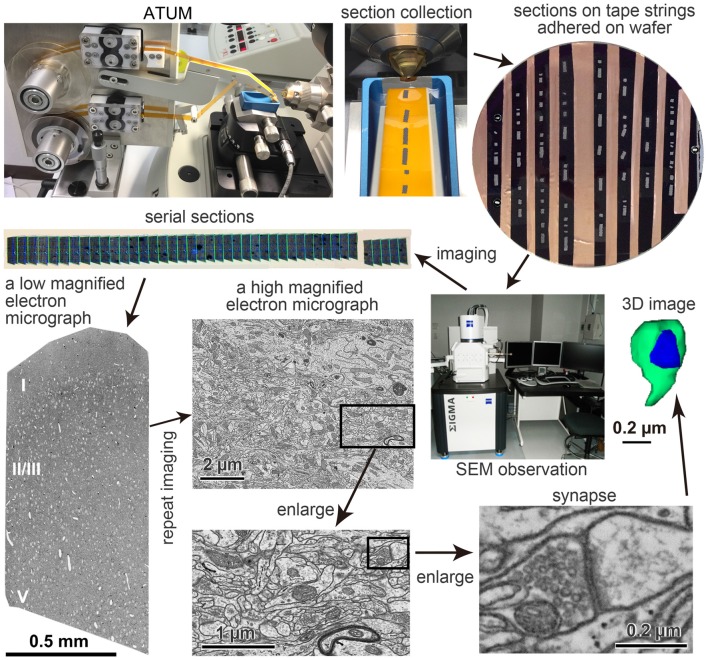
One recent technical innovation in neuroscience is microcircuit analysis using three-dimensional reconstructions of neural elements with a large volume Electron microscopy (EM) data set. Large-scale data sets are acquired with newly-developed electron microscope systems such as automated tape-collecting ultramicrotomy (ATUM) with scanning EM (SEM), serial block-face EM (SBEM) and focused ion beam-SEM (FIB-SEM). Currently, projects are also underway to develop computer applications for the registration and segmentation of the serially-captured electron micrographs that are suitable for analyzing large volume EM data sets thoroughly and efficiently. The analysis of large volume data sets can bring innovative research results. These recently available techniques promote our understanding of the functional architecture of the brain.
Keywords: ATUM; FIB-SEM; SBEM; carbon nanotube; connectome; segmentation; synapse; volume electron microscopy.
Figures
Similar articles
-
Volume scanning electron microscopy for imaging biological ultrastructure.Biol Cell. 2016 Nov;108(11):307-323. doi: 10.1111/boc.201600024. Epub 2016 Aug 12. Biol Cell. 2016. PMID: 27432264 Review.
-
New developments in electron microscopy for serial image acquisition of neuronal profiles.Microscopy (Oxf). 2015 Feb;64(1):27-36. doi: 10.1093/jmicro/dfu111. Epub 2015 Jan 5. Microscopy (Oxf). 2015. PMID: 25564566 Review.
-
Challenges of microtome-based serial block-face scanning electron microscopy in neuroscience.J Microsc. 2015 Aug;259(2):137-142. doi: 10.1111/jmi.12244. Epub 2015 Apr 23. J Microsc. 2015. PMID: 25907464 Free PMC article. Review.
-
Serial-section electron microscopy using automated tape-collecting ultramicrotome (ATUM).Methods Cell Biol. 2019;152:41-67. doi: 10.1016/bs.mcb.2019.04.004. Epub 2019 Jun 8. Methods Cell Biol. 2019. PMID: 31326026 Free PMC article.
-
Neurons on tape: Automated Tape Collecting Ultramicrotomy-mediated volume EM for targeting neuropathology.Methods Cell Biol. 2023;177:125-170. doi: 10.1016/bs.mcb.2023.01.012. Epub 2023 Feb 24. Methods Cell Biol. 2023. PMID: 37451765 Review.
Cited by
-
Finding Needles in a Haystack with Light: Resolving the Microcircuitry of the Brain with Fluorescence Microscopy.Mol Cells. 2022 Feb 28;45(2):84-92. doi: 10.14348/molcells.2022.2021. Mol Cells. 2022. PMID: 35236783 Free PMC article. Review.
-
Application of the Mirror Technique for Three-Dimensional Electron Microscopy of Neurochemically Identified GABA-ergic Dendrites.Front Neuroanat. 2021 Apr 20;15:652422. doi: 10.3389/fnana.2021.652422. eCollection 2021. Front Neuroanat. 2021. PMID: 33958990 Free PMC article.
-
Cytoskeletal organization of axons in vertebrates and invertebrates.J Cell Biol. 2020 Jul 6;219(7):e201912081. doi: 10.1083/jcb.201912081. J Cell Biol. 2020. PMID: 32369543 Free PMC article.
-
Multi-scale light microscopy/electron microscopy neuronal imaging from brain to synapse with a tissue clearing method, ScaleSF.iScience. 2021 Dec 27;25(1):103601. doi: 10.1016/j.isci.2021.103601. eCollection 2022 Jan 21. iScience. 2021. PMID: 35106459 Free PMC article.
-
Mechanisms Underlying Target Selectivity for Cell Types and Subcellular Domains in Developing Neocortical Circuits.Front Neural Circuits. 2021 Sep 24;15:728832. doi: 10.3389/fncir.2021.728832. eCollection 2021. Front Neural Circuits. 2021. PMID: 34630048 Free PMC article. Review.
References
Publication types
MeSH terms
LinkOut - more resources
Full Text Sources