. 2018 Nov 13:12:96.
doi: 10.3389/fnana.2018.00096. eCollection 2018.

Neurophilic Descending Migration of Dorsal Midbrain Neurons Into the Hindbrain

Affiliations

Neurophilic Descending Migration of Dorsal Midbrain Neurons Into the Hindbrain

Claudia M García-Peña et al. Front Neuroanat. .

Abstract

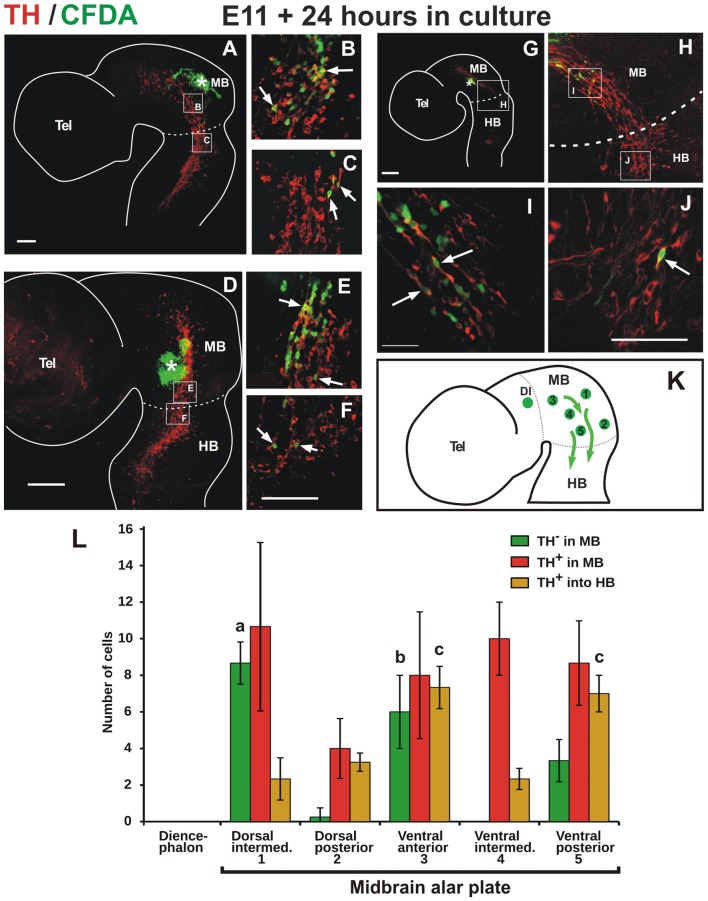
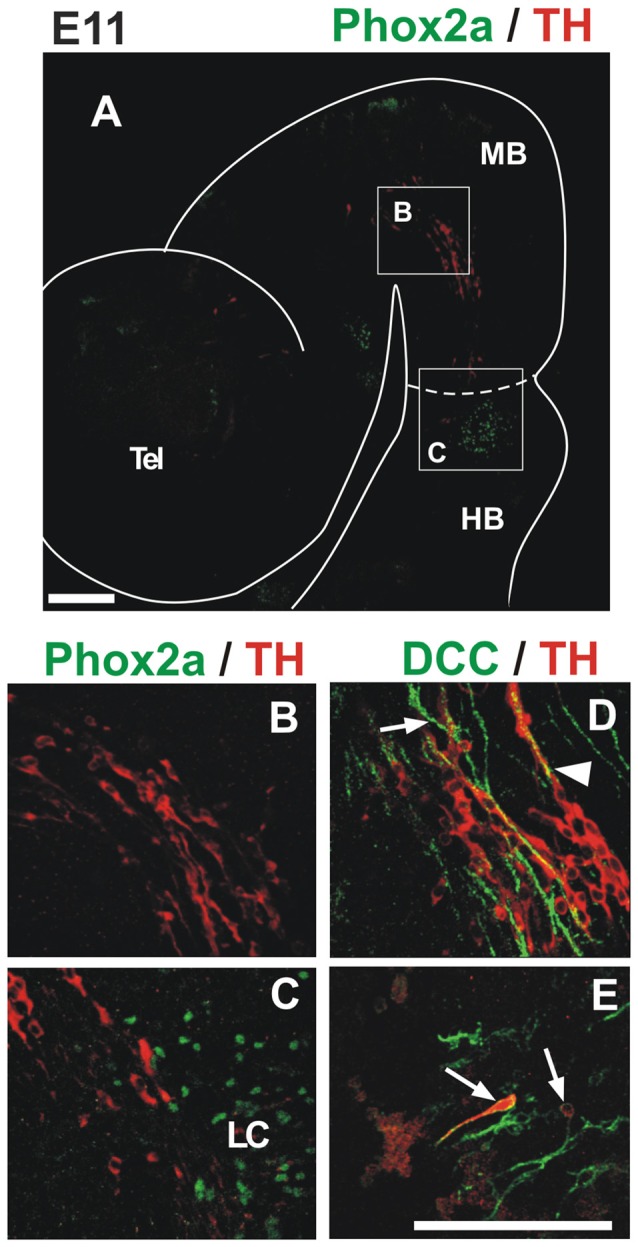
Stereotypic cell migrations in the developing brain are fundamental for the proper patterning of brain regions and formation of neural networks. In this work, we uncovered in the developing rat, a population of neurons expressing tyrosine hydroxylase (TH) that migrates posteriorly from the alar plate of the midbrain, in neurophilic interaction with axons of the mesencephalic nucleus of the trigeminal nerve. A fraction of this population was also shown to traverse the mid-hindbrain boundary, reaching the vicinity of the locus coeruleus (LC) in rhombomere 1 (r1). This migratory population, however, does not have a noradrenergic (NA) phenotype and, in keeping with its midbrain origin, expresses Otx2 which is down regulated upon migration into the hindbrain. The interaction with the trigeminal mesencephalic axons is necessary for the arrangement and distribution of migratory cells as these aspects are dramatically altered in whole embryo cultures upon disruption of trigeminal axon projection by interfering with DCC function. Moreover, in mouse embryos in an equivalent developmental stage, we detected a cell population that also migrates caudally within the midbrain apposed to mesencephalic trigeminal axons but that does not express TH; a fraction of this population expresses calbindin instead. Overall, our work identified TH-expressing neurons from the rat midbrain alar plate that migrate tangentially over long distances within the midbrain and into the hindbrain by means of a close interaction with trigeminal mesencephalic axons. A different migratory population in this region and also in mouse embryos revealed diversity among the cells that follow this descending migratory pathway.

Keywords: calbindin; embryo; midbrain; migration; mouse; neurophilic; rat; tyrosine hydroxylase.


Figures

Figure 1
Figure 1
A novel population of tyrosine hydroxylase (TH)-expressing cells in the midbrain alar plate. Immunofluorescent staining for TH in flat-mounted E10.5–11.5 hemi-brains is shown in (A–F). In all panels, rostral is to the left and dashed lines indicate the approximate location of the mid-hindbrain boundary region (MHB). Arrows in (A,C,D) indicate the location of the TH-expressing cell population that is present in the hindbrain from E10.5 to E11.5. (B,E,F) Magnified views of the areas indicated by frames in (A,D,F), respectively. (D) TH chromogenic immunostaining (not flat-mounted) revealing the location of the midbrain TH+ cell population that is continuous into the hindbrain. (E) Volume reconstruction (3D) of a Z confocal series of a magnified region of the TH+ cell cluster showing a few stained cells (red) and cell nuclei stained with DAPI in blue. This image was obtained from a parasaggittal cryosection of approximate location as indicated in (E,F). Single TH+ cell showing its leading process (arrow) toward the hindbrain as observed in most individually identified neurons revealing a precise pattern in this cell group; its cell body containing the nucleus is indicated by the arrowhead. MB, midbrain; HB, hindbrain; Tel, telencephalic vesicle. Scale bars: 100 μm.
Figure 2
Figure 2
TH cells from the alar plate of the midbrain migrate descendingly and some reach the anterior end of the hindbrain. Flat-mounted hemibrains of embryos injected with carboxyl-fluorescein di-acetate (CFDA, green) at various positions of the midbrain (indicated with asterisks) and cultured for 24 h, followed by TH immunostaining (red). In all panels, rostral is to the left and dashed lines indicate the approximate location of the MHB. (A–C) Labeling from the dorsal aspect of the midbrain reveals CFDA+/TH+ cells that migrate ventrally into the TH+ cell cluster and in a posterior direction along the cluster. Labeling from the posterior end of the midbrain (D,E) and from an intermediate position along its antero-posterior extent (G–J), reveal CFDA+/TH+ cells that migrate in a posterior direction along the ventral region of the alar plate. From all labeled positions shown, cells were observed to reach the anterior region of the hindbrain (arrows in C,F,J). (B,C,E,F,I,J) Magnifications of the regions indicated by frames in (A,D,G,H). Location of (H) is indicated in (G). (K) Summary diagram of various labeling points in the midbrain (green circles) and the direction of migration (arrows). Numbers in the diagram correspond to labeling regions in the midbrain alar plate indicated in (L). The green circle in the diencephalon in (K) indicates labeling at the pretectum from which no migratory cells were observed (not shown). Panel (L) shows the quantitation of CFDA-labeled cells from various regions in the midbrain alar plate. Total migratory cells include all labeled cells that could be identified away from the labeling points; these include cells that were observed in the midbrain that do not express TH (TH in MB), cells in the midbrain that express TH (TH+ in MB), and cells that express TH that reached the anterior region of r1 in the hindbrain (TH in HB). Standard deviation is indicated in each of the bars. Value (a) indicates significant difference (p < 0.01) from 2, 4 and 5; (b) difference from 2 and 4 and (c) difference from 1, 2 and 4. Number of injections indicated in “Materials and Methods” section. Scale bars: 100 μm. Bar in (F) also applies to (B,C,E); bar in (J) also applies to (I).
Figure 3
Figure 3
TH migratory cells from the midbrain do not express the noradrenergic (NA) marker dopamine β-hydroxylase (DBH). Double immunostaining for TH (red) and DBH (green) was performed in hemibrains. In all panels, rostral is to the left and dashed lines indicate the approximate location of the MHB. Migratory cells from the midbrain (TH-only) appear to merge with TH+/DBH+ cells (arrows) in the hindbrain at E11 and E11.5 (A–D). (C,D) Magnified views of frames indicated in (A,B), respectively; (E,F) by E12 and E13 two distinct populations (TH-only and TH/DBH double labeled cells) are detected at the rostral end of the hindbrain. Scale bars: 100 μm.
Figure 4
Figure 4
TH migratory cells from the midbrain do not express the markers Phox2a and DCC present in LC cells. Double immunostaining for TH (red) and either Phox2a (A–C) or DCC (D,E) reveals that TH+ migratory cells from the midbrain do not express these markers found in NA neurons at this stage. In all panels, rostral is to the left and dashed lines indicate the MHB. Note that although expression of DCC was absent from TH migratory cells (D), it stained TH+ cells of the prospective LC (arrows in (E)) and longitudinal axons in the midbrain (arrow in (D)). Arrowhead in (D) indicates apposition of DCC axons and TH cells. Location of (B,C) is indicated in (A). Panels (D,E) correspond to locations similar to (B,C), respectively. LC, locus coeruleus. Scale bars: 100 μm. Bar in (E) also applies to (B–D).
Figure 5
Figure 5
Migratory TH+ cells from the midbrain down-regulate Otx2 expression along their pathway into the hindbrain. In all panels, rostral is to the left and dashed lines indicate the MHB. (A,B) Double immunostaining of Otx2 (red) and TH (green) reveals co-expression in the midbrain; a mosaic reconstruction of individual micrographs of the whole extent of the TH cell cluster is shown in (B), its location is indicated in (A). (C–E). Magnified views of the regions indicated in (B) showing Otx2 and TH co-expression (arrows). Panels (C,D) correspond to regions within the midbrain and (E) corresponds to the MHB region and shows lack of expression of Otx2 in TH cells in the hindbrain territory (arrowheads). Panel (F) corresponds to a location similar to (D) of an E11 rat embryo cultured for 24 h; it shows Otx2 and TH co-expression (arrows). (G,H) CFDA labeling (green) followed by culture and Otx2 immunostaining (red). (H) Magnified view of the region indicated in (G) showing CFDA labeled cells expressing Otx2 in the midbrain territory (arrows) and lack of expression in the hindbrain territory (arrowheads). Insets in (H) represent magnified views of the cells in the dashed white frame showing green and red channels; arrow indicates CFDA-labeled cell (green) that expresses Otx2 (red). Panel (H′) shows digital orthogonal projection of plane indicated by green horizontal line showing CFDA-labeled cell that expresses Otx2 (arrow). Scale bars: 100 μm. Bar in (D) also applies to (C).
Figure 6
Figure 6
Midbrain TH+ neurons migrate in close apposition to axons of the mesencephalic trigeminal nucleus (TmesV). Double immunostaining for TH (green) and β-III tubulin (red) confirms the neuronal identity of TH-expressing cells in the midbrain alar plate and reveals their close apposition to TmesV axons along their migratory route at E11 (A,B,E,F,H) and E11.5 (C,D). (B,D) Magnifications of the regions indicated by frames in (A,C), respectively. Panel (E) is a higher magnification image of the region indicated in (B) and shows TH cells apposed to axons (arrows). (F) Single frame of a confocal Z-series from the image shown in (E), indicating with the green horizontal line and the red vertical line the position of the digital sections on the orthogonal projection of the Z-series shown on (F′,F″), respectively, and confirming the close apposition of TH neurons to TmesV axons. (H) Transverse section of the midbrain at E11 (its approximate location is indicated by frame in (G) and by the green line in (A)), showing double immunostaining for TH and β-III tubulin indicating that TH neurons are surrounded by axon bundles of the TmesV (arrow). (I–K) TmesV neurons were labeled from the trigeminal ganglion in rat embryos (E12.5 + 6 h) do not express TH. Embryos of E12.5 + 6 h were labeled from the trigeminal ganglion with Dextran Alexa Fluor 488 (green) followed by TH immunostaining (red). Panel (I) shows a panoramic view of a transverse section at the anterior end of r1 and the location of (J) and (K). Arrow in (J) indicates the developing LC and arrowhead indicates labeled TmesV cells. Arrow in (K) indicates a lateral cluster of cells that is continuous with the TH expressing territory in the ventral rim of the alar plate in the midbrain and arrowheads indicate labeled TmesV cells. Dotted lines indicate the exterior boundary of the developing brainstem. Scale bars: (A–H) 100 μm. Bar in (D) also applies to (B). (J,K) 50 μm.
Figure 7
Figure 7
Blocking DCC signaling in rat embryos impairs TmesV axon projection and TH cell migration, and TmesV axons misproject in DCC mutant mouse embryos. Embryos cultured in presence of Ig-Fc as control (A,D) or with the DCC-Fc chimera to alter TmesV axon projection (B,E) followed by double immunostaining for TH and β-III tubulin; their approximate location is indicated in diagram in (C). Overall organization of TmesV neurons and their axon projection was dramatically altered by DCC-Fc (B,E) along with a drastic disorganization of TH neurons and their impaired caudal migration into the hindbrain. White arrows in (D,E) indicate TH+ cells apposed to β-III tubulin axons in single optical sections and orthogonal digital projections (D′,D″ and E′,E″ respectively); in (B) green arrows indicate TH+ cells that do not interact with β-III tubulin axons, white arrowhead indicates interruption of the longitudinal tract of the TmesV, and white arrow indicates lack of projection of the TmesV into the hindbrain. Panel (F) is a flat-mounted hemibrain of a wild-type mouse embryo stained for β-III tubulin and (G) is from a DCC−/− embryo. Arrow in (G) indicates misprojecting axons and arrowheads indicate dorsal displacement of the TmesV axon bundle. (H) The treatment with DCC-Fc reduced the density of TmesV axon bundles. The area covered by β-III tubulin axon bundles in projections of confocal Z-stacks was measured. Asterisk indicates statistical difference between controls and DCC-Fc treated embryos (Wilcoxon-Mann-Whitney test, p = 0.0143). (I) The TmesV axon bundle was dorsally displaced in DCC−/− embryos. The distance of the center of the axon bundle from the dorsal edge of the brain was measured at the isthmic region for wild-type and mutant embryos. Dorsal displacement is revealed by a significantly shorter distance of the bundle in mutant embryos. Asterisk indicates statistical difference between controls and DCC−/− embryos (Wilcoxon-Mann-Whitney test, p = 0.008). Scale bar: 100 μm. Bars in (A,D,F) also apply to (B,E,G), respectively.
Figure 8
Figure 8
Descending migratory population of calbindin-expressing cells in mouse embryos. (A) E9.5 mouse embryonic midbrain immunostained for TH showing a low-expressing population in the dorsal-most aspect of the midbrain near its boundary with the pretectum. (B–D) E9.5 mouse midbrain showing calbindin cells apposed to TmesV axons (β-III tubulin). Panels (C,D) are red and merged red/green channels, respectively, of the same magnified region indicated in (B). (E,F) CFDA labeling was performed in the midbrain of E9.5 embryos followed by 24 h in culture revealing caudally-migrating cells. Panel (F) is a magnification of the frame indicated in (E). (G) Following CFDA labeling (asterisk) and culture, the midbrain was immunostained for calbindin showing that some migratory cells express this marker (arrows). (H) E10.5 rat embryonic midbrain immunostained for TH and calbindin in a location similar to (C–D). (I) CFDA labeling in the midbrain of E11.5 rat embryos followed by 24 h in culture and immunostaining showing caudally-migrating cells that do not express calbindin. Scale bars: 100 μm.

Similar articles

Cited by

References

    1. Alcántara S., Ruiz M., De Castro F., Soriano E., Sotelo C. (2000). Netrin 1 acts as an attractive or as a repulsive cue for distinct migrating neurons during the development of the cerebellar system. Development 127, 1359–1372. - PubMed
    1. Aroca P., Lorente-Cánovas B., Mateos F. R., Puelles L. (2006). Locus coeruleus neurons originate in alar rhombomere 1 and migrate into the basal plate: studies in chick and mouse embryos. J. Comp. Neurol. 496, 802–818. 10.1002/cne.20957 - DOI - PubMed
    1. Auclair F., Marchand R., Glover J. C. (1999). Regional patterning of reticulospinal and vestibulospinal neurons in the hindbrain of mouse and rat embryos. J. Comp. Neurol. 411, 288–300. 10.1002/(sici)1096-9861(19990823)411:2<288::aid-cne9>3.0.co;2-u - DOI - PubMed
    1. Bertram I., Bernstein H.-G., Lendeckel U., Bukowska A., Doborwolny H., Keilhoff G., et al. . (2007). Immunohistochemical evidence for impaired neuregulin-1 signaling in the prefrontal cortex in schizophrenia and in unipolar depression. Ann. N Y Acad. Sci. 1096, 147–156. 10.1196/annals.1397.080 - DOI - PubMed
    1. Bodea G. O., Spille J.-H., Abe P., Andersson A. S., Acker-Palmer A., Stumm R., et al. . (2014). Reelin and CXCL12 regulate distinct migratory behaviors during the development of the dopaminergic system. Development 141, 661–673. 10.1242/dev.099937 - DOI - PubMed

LinkOut - more resources