. 2018 Nov 13:9:1234.
doi: 10.3389/fphar.2018.01234. eCollection 2018.

TRPM8 Activation via 3-Iodothyronamine Blunts VEGF-Induced Transactivation of TRPV1 in Human Uveal Melanoma Cells

Affiliations

TRPM8 Activation via 3-Iodothyronamine Blunts VEGF-Induced Transactivation of TRPV1 in Human Uveal Melanoma Cells

Lia Walcher et al. Front Pharmacol. .

Abstract

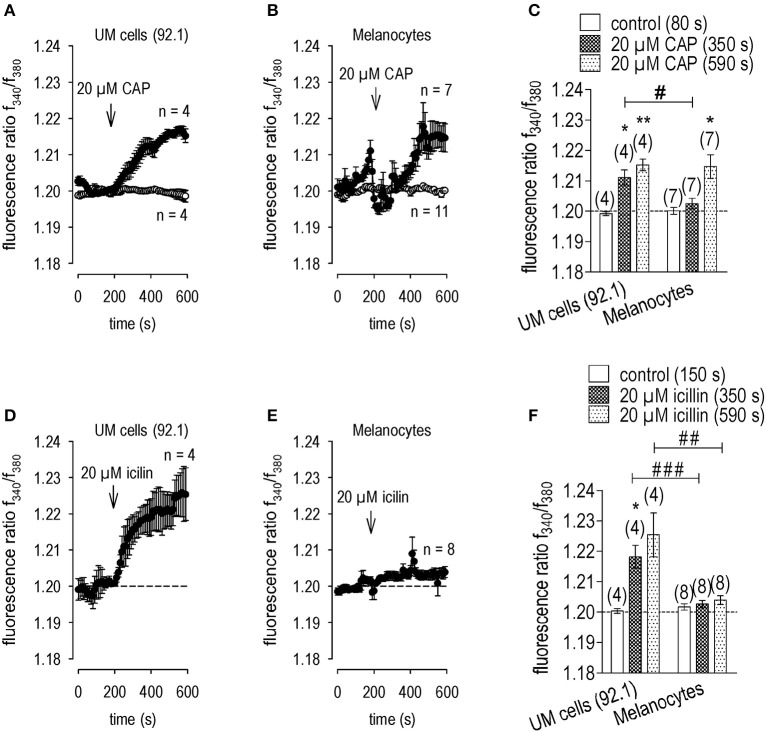
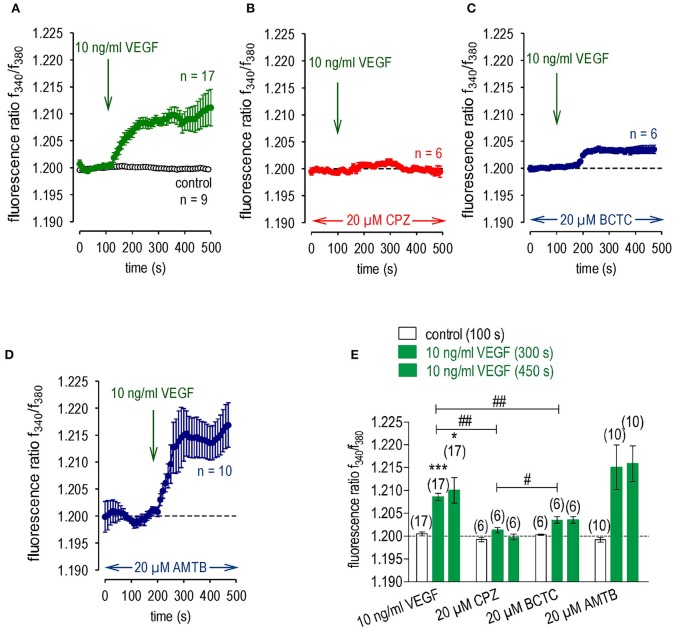
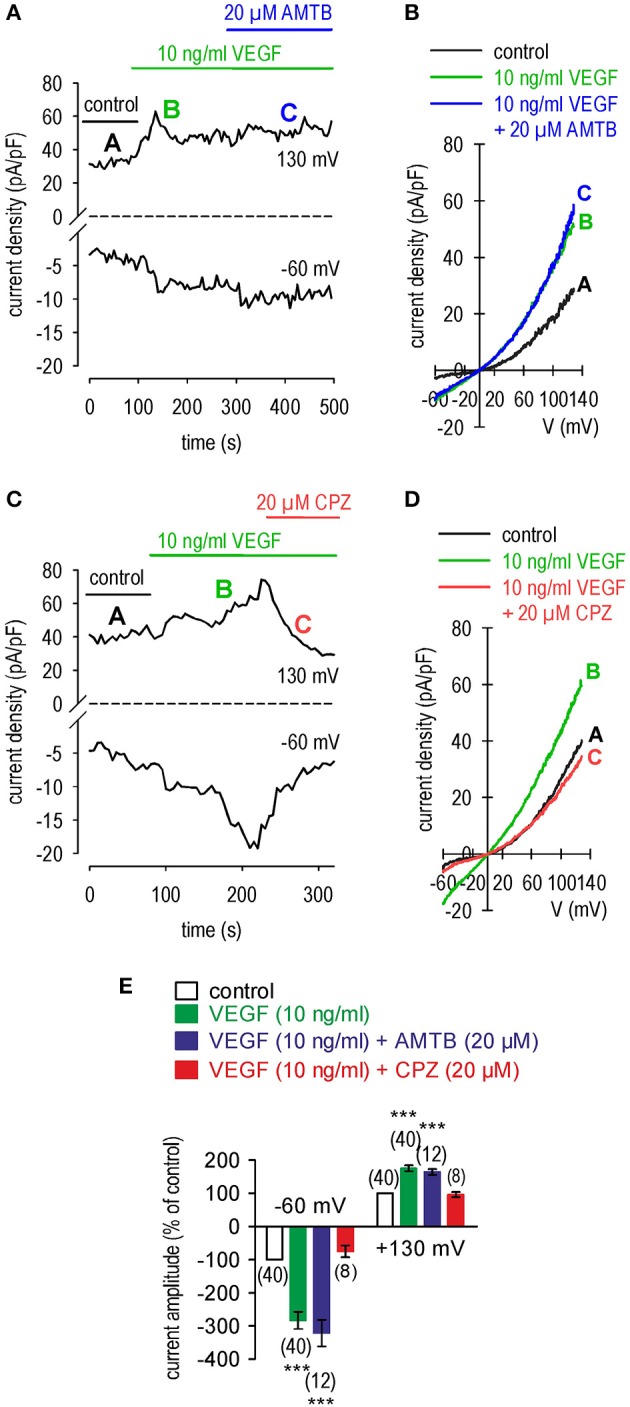
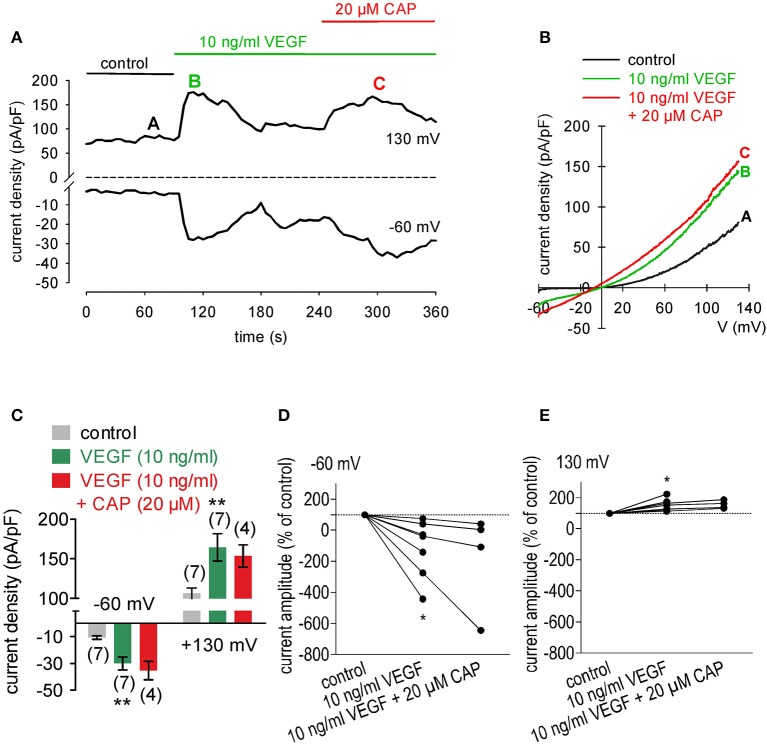
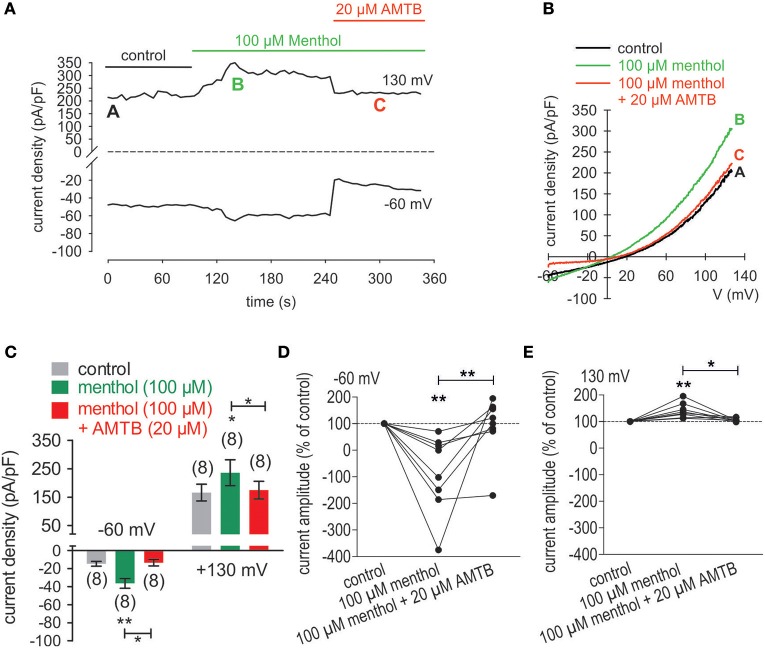
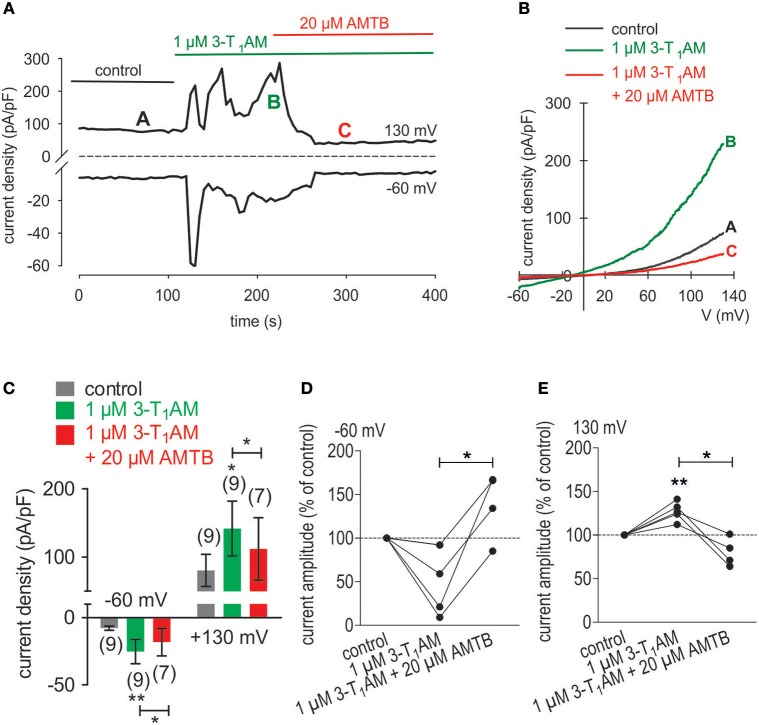
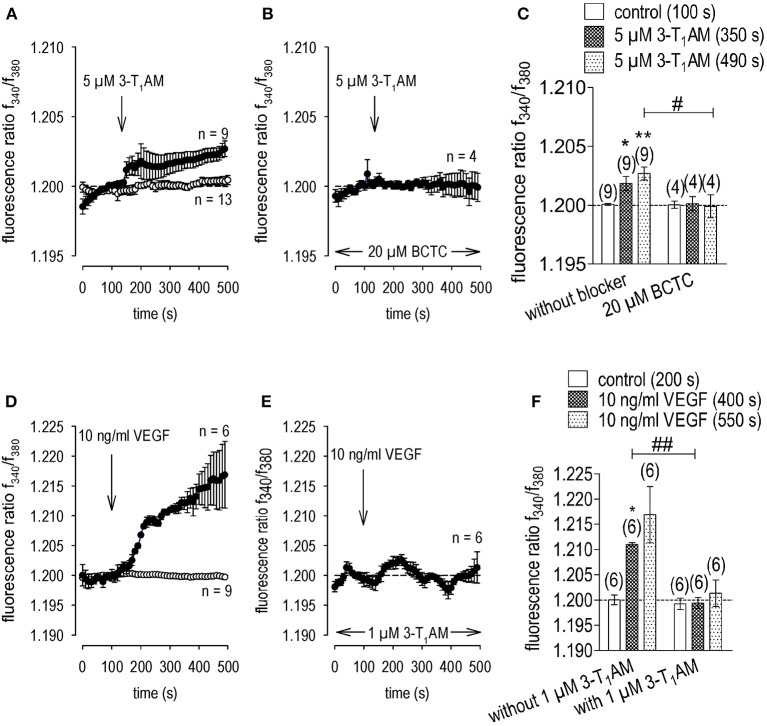
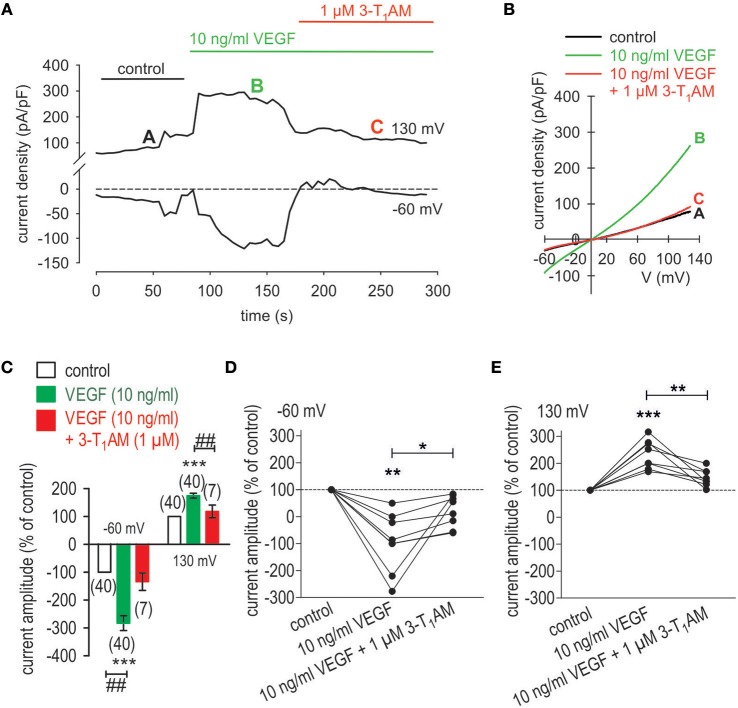
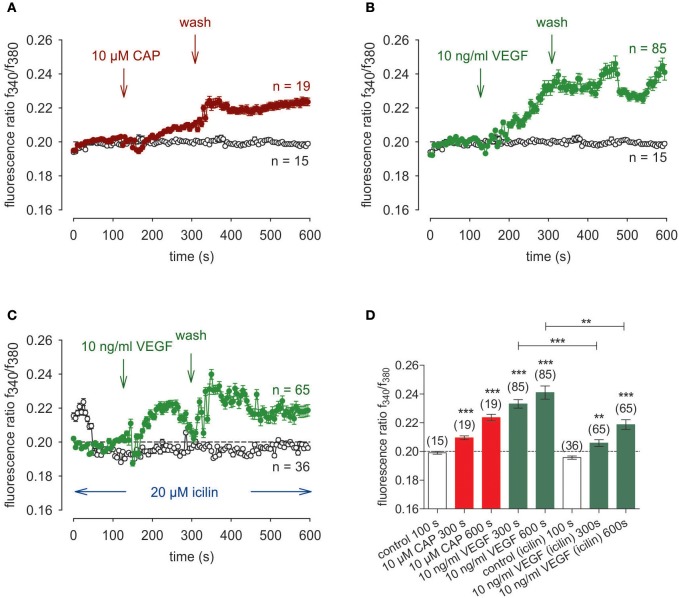
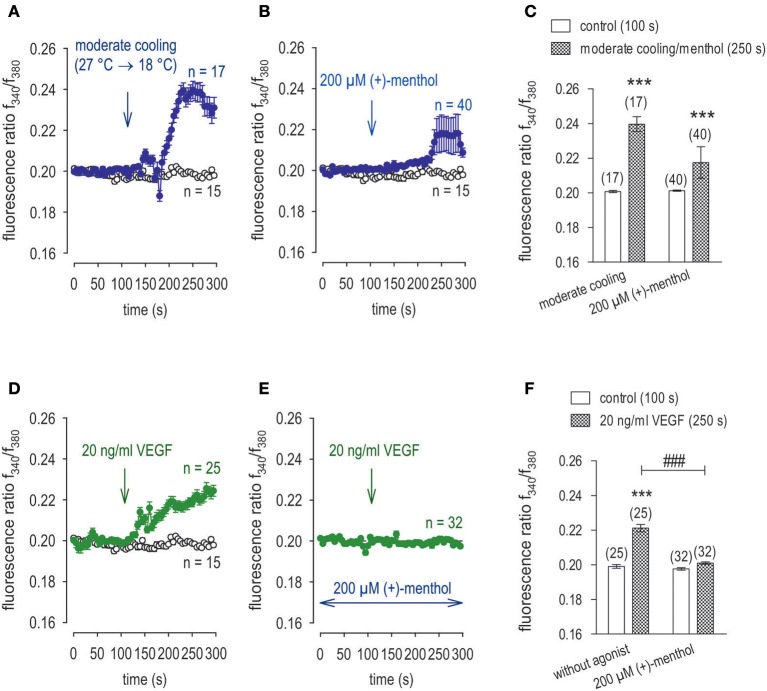
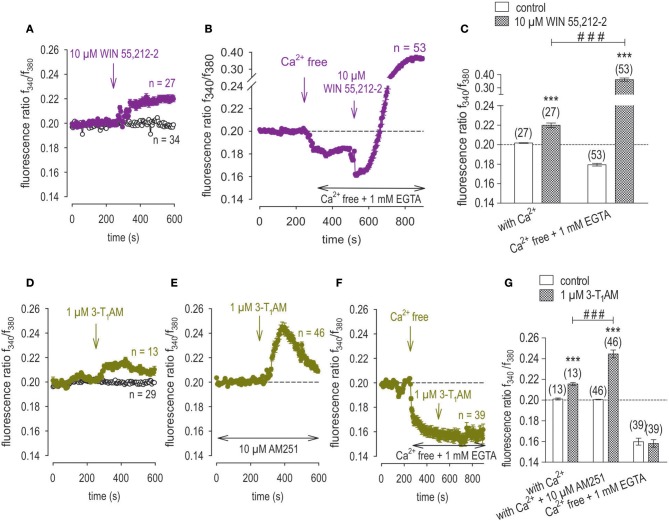
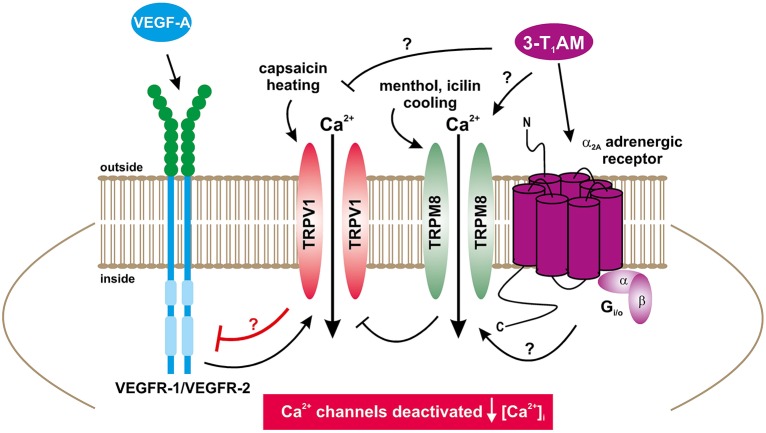
In human uveal melanoma (UM), tumor enlargement is associated with increases in aqueous humor vascular endothelial growth factor-A (VEGF-A) content that induce neovascularization. 3-Iodothyronamine (3-T1AM), an endogenous thyroid hormone metabolite, activates TRP melastatin 8 (TRPM8), which blunts TRP vanilloid 1 (TRPV1) activation by capsaicin (CAP) in human corneal, conjunctival epithelial cells, and stromal cells. We compare here the effects of TRPM8 activation on VEGF-induced transactivation of TRPV1 in an UM cell line (92.1) with those in normal primary porcine melanocytes (PM) since TRPM8 is upregulated in melanoma. Fluorescence Ca2+-imaging and planar patch-clamping characterized functional channel activities. CAP (20 μM) induced Ca2+ transients and increased whole-cell currents in both the UM cell line and PM whereas TRPM8 agonists, 100 μM menthol and 20 μM icilin, blunted such responses in the UM cells. VEGF (10 ng/ml) elicited Ca2+ transients and augmented whole-cell currents, which were blocked by capsazepine (CPZ; 20 μM) but not by a highly selective TRPM8 blocker, AMTB (20 μM). The VEGF-induced current increases were not augmented by CAP. Both 3-T1AM (1 μM) and menthol (100 μM) increased the whole-cell currents, whereas 20 μM AMTB blocked them. 3-T1AM exposure suppressed both VEGF-induced Ca2+ transients and increases in underlying whole-cell currents. Taken together, functional TRPM8 upregulation in UM 92.1 cells suggests that TRPM8 is a potential drug target for suppressing VEGF induced increases in neovascularization and UM tumor growth since TRPM8 activation blocked VEGF transactivation of TRPV1.

Keywords: 3-iodothyronamine; Intracellular Ca2+; transient receptor potential melastatin 8; transient receptor potential vanilloid 1 channel; uveal melanoma; vascular endothelial growth factor.


Figures

Figure 1
Figure 1
Larger functional TRPM8 expression in UM 92.1 than PM cells. Drug additions were made at the indicated time points (arrows). Data are mean ± SEM of 4–8 experiments. (A) CAP (20 μM) induced an irreversible Ca2+ influx (n = 4) whereas non-treated control cells showed a constant Ca2+ baseline (n = 4). (B) The same effect could be observed in normal porcine melanocytes but with a time lag (n = 7; controls n = 11). (C) Summary of the experiments with CAP (n = 4–7). The asterisks (*) show significant differences between control and CAP (n = 4; 350s; *p < 0.05; n = 7; 590 s; **p < 0.01; paired tested). The hashtag shows a significant difference of the CAP effect at 350 s between UM 92.1 cells and melanocytes (n = 4-7; 590 s; #p < 0.05; unpaired tested). (D–F) Same experiments as shown in (A–C), but with icilin (20 μM) (n = 4–8). The icilin effect was markedly reduced in porcine melanocytes. The asterisks (*) show significant differences between control and icilin (n = 4; 350 s; *p < 0.05; paired tested). The hashtags (#) shows a significant difference of the icilin effect at 350 s and 590 s between UM 92.1 cells and melanocytes (n = 4–8; 350 s; ###p < 0.005; 590 s; ##p < 0.01; unpaired tested).
Figure 2
Figure 2
VEGF transactivates TRPV1 channels in UM 92.1 cells. VEGF (10 ng/ml) was added at the indicated time points (arrows). Data are mean ± SEM of 6–17 experiments. (A) Mean trace showing VEGF-induced Ca2+ increase (n = 17). (B) Same experiment as shown in (A), but in the presence of CPZ (20 μM). CPZ clearly suppressed the VEGF-induced Ca2+ increase (n = 6). (C) Same experiment as shown in (A), but in the presence of BCTC (20 μM). BCTC partially suppressed the VEGF-induced Ca2+ increase (n = 6). (D) Same experiment as shown in (A), but in the presence of AMTB (20 μM). AMTB had no effect on the VEGF-induced Ca2+ increase (n = 10). (E) Summary of the experiments with VEGF and the TRP channel blockers. The asterisks (*) show significant Ca2+ increases with VEGF (n = 17; 300 s; ***p < 0.005; 450 s; *p < 0.05; paired tested). The hashtags (##) indicate statistically significant differences of fluorescence ratios between VEGF with and without the TRP channel blockers CPZ and BCTC, resp. (n = 6–17; 300 s; ##p < 0.01; unpaired tested). One hashtag (#) indicates a statistically significant difference between CPZ and BCTC effect on VEGF-induced Ca2+ increase at 300 s (n = 6; #p < 0.05).
Figure 3
Figure 3
Comparison of the effects of CPZ and AMTB on VEGF-induced rises in whole-cell currents in UM 92.1 cells. (A) Time course recording showing the current increases induced by VEGF (10 ng/ml) and after application of 20 μM AMTB. (B) Original traces of VEGF-induced current responses to voltage ramps. Current densities are shown before application (labeled as A), during application of VEGF (labeled as B), and after addition of AMTB (labeled as C). (C–D) Same recordings as shown in (A–B) but with 20 μM CPZ instead of AMTB. CPZ clearly reduced the VEGF-induced whole-cell increases. (E) Summary of patch-clamp experiments with VEGF, AMTB and CPZ. The asterisks (***) indicate statistically significant differences of in- and outward currents with VEGF without and with AMTB (n = 8–40; ***p < 0.005; paired tested). VEGF had no effect in the presence of CPZ.
Figure 4
Figure 4
CAP does not augment increases in whole-cell currents in VEGF treated UM 92.1 cells. (A) Time course recording showing the current peak induced by 10 ng/ml VEGF and current peak after application of 20 μM CAP. (B) Original traces of VEGF- and CAP-induced current responses to voltage ramps. Current densities are shown before application (labeled as A), during application of VEGF (labeled as B), and after addition of CAP (labeled as C). (C) Summary of patch-clamp experiments with VEGF and CAP. The asterisks (**) indicate statistically significant increase with VEGF (n = 7; p < 0.01; paired tested) and unchanged magnitude of currents in the presence of CAP (n = 4; p > 0.05; paired tested). (D) Maximal negative current amplitudes induced by a voltage step from 0 to −60 mV are depicted in percent of control values before application of 10 ng/ml VEGF. VEGF-induced inward currents (n = 7; *p < 0.05) were not increased in the presence of 20 μM CAP (n = 4; p > 0.05). (E) Maximal positive current amplitudes induced by a voltage step from 0 to +130 mV are depicted in percent of control values before application of 10 ng/ml VEGF. VEGF-induced outwardly rectifying currents (n = 7; *p < 0.05) were not increased in the presence of 10 μM CAP (n = 4; p > 0.05).
Figure 5
Figure 5
AMTB suppresses menthol-induced rises in whole-cell currents in UM 92.1 cells. (A) Time course recording showing the current increases induced by menthol (100 μM) and reduction after application of 20 μM AMTB. (B) Original traces of menthol-induced current responses to voltage ramps. Current densities are shown before application (labeled as A), during application of menthol (labeled as B), and after addition of AMTB (labeled as C). (C) Summary of the patch-clamp experiments with menthol and AMTB. The asterisks (*) indicate statistically significant differences of in- and outward currents with menthol without AMTB (n = 8; inward currents; **p < 0.01; outward currents; *p < 0.05; paired tested) and in the presence of AMTB (n = 8; in- and outward currents *p < 0.05; paired tested). (D) Maximal negative current amplitudes induced by a voltage step from 0 to −60 mV are depicted in percent of control values before application of 100 μM menthol. Menthol-induced inward currents (n = 8; **p < 0.01) were clearly suppressed in the presence of 20 μM AMTB (n = 8; **p < 0.01). (E) Maximal positive current amplitudes induced by a voltage step from 0 to +130 mV are depicted in percent of control values before application of 100 μM menthol. Menthol-induced outwardly rectifying currents (n = 8; **p < 0.01) were clearly suppressed in the presence of 20 μM AMTB (n = 8; *p < 0.05).
Figure 6
Figure 6
3-T1AM elicits increases in whole-cell currents through TRPM8 channels in UM 92.1 cells. (A) Time course recording showing the current increases induced by 3-T1AM and reduction after application of 20 μM AMTB. (B) Original traces of 3-T1AM -induced current responses to voltage ramps. Current densities are shown before application (labeled as A), during application of 3-T1AM (labeled as B), and after addition of AMTB (labeled as C). (C) Summary of patch-clamp experiments with 3-T1AM and AMTB. The asterisks (**) indicate statistically significant increase with 3-T1AM (n = 9; p < 0.05 at the minimum; paired tested) and decreases in the presence of AMTB (n = 7; p < 0.05; paired tested).). (D) Maximal negative current amplitudes induced by a voltage step from 0 to −60 mV are depicted in percent of control values before application of 1 μM 3-T1AM. 3-T1AM-induced inward currents were clearly suppressed in the presence of 20 μM AMTB (n = 4; *p < 0.05). (E) Maximal positive current amplitudes induced by a voltage step from 0 to +130 mV are depicted in percent of control values before application of 1 μM 3-T1AM. 3-T1AM-induced outwardly rectifying currents (n = 5; **p < 0.01) were clearly suppressed in the presence of 20 μM AMTB (n = 4; *p < 0.05).
Figure 7
Figure 7
3-T1AM elicits increases in Ca2+ entry through TRPM8 channels but instead suppresses VEGF-induced Ca2+ increases in UM 92.1 cells. 3-T1AM (5 μM) or VEGF (10 ng/ml) was added at the time points indicated by arrows. Data are mean ± SEM of 4–9 experiments. (A) Mean trace showing 3-T1AM-induced Ca2+ increase (n = 9) whereas non-treated control cells showed a constant Ca2+ baseline (n = 13). (B) Same experiment as shown in (A), but in the presence of BCTC (20 μM). BCTC clearly suppressed the 3-T1AM-induced Ca2+ increase (n = 4). (C) Summary of the experiments with 3-T1AM and BCTC. The asterisks (**) show significant Ca2+ increases with 3-T1AM (n = 9; 350 s; *p < 0.05; 490 s; **p < 0.01; paired tested). The hashtag (#) indicates a statistically significant difference of fluorescence ratios between 3-T1AM with and without BCTC (n = 6; 490s; #p < 0.05; unpaired tested). (D) Mean trace showing VEGF-induced Ca2+ increase (n = 6) whereas non-treated control cells showed a constant Ca2+ baseline (n = 9). (E) Same experiment as shown in (D), but in the presence of 3-T1AM (1 μM). 3-T1AM clearly suppressed the VEGF-induced Ca2+ increase (n = 6). (F) Summary of the experiments with VEGF and 3-T1AM. The asterisk (*) shows a significant Ca2+ increase with VEGF (n = 6; 400 s; *p < 0.05; paired tested). The hashtags (##) indicate statistically significant differences of fluorescence ratios between VEGF with and without 3-T1AM (n = 6; 400 s; ##p < 0.01; unpaired tested).
Figure 8
Figure 8
3-T1AM suppresses VEGF-induced rises in whole-cell currents in UM 92.1 cells. (A) Time course recording showing the current increases induced by VEGF (10 ng/ml) and reduction after application of 10 μM 3-T1AM. (B) Original traces of VEGF-induced current responses to voltage ramps. Current densities are shown before application (labeled as A), during application of VEGF (labeled as B), and after addition of 3-T1AM (labeled as C). Current densities as function of voltage were derived from the traces shown in panel A. (C) Summary of patch-clamp experiments with VEGF and 3-T1AM. The asterisks (***) indicate statistically significant increase with VEGF (n = 40; ***p < 0.005; paired tested). The hashtags (##) indicate statistically significant differences of whole-cell in- and outward currents between VEGF with and without 3-T1AM (n = 7–40; ##p < 0.01; unpaired tested). (D) Maximal negative current amplitudes induced by a voltage step from 0 to −60 mV are depicted in percent of control values before application of 10 ng/ml VEGF. VEGF-induced inward currents (n = 7; **p < 0.01) were clearly suppressed in the presence of 1 μM 3-T1AM (n = 7; *p < 0.05). (E) Maximal positive current amplitudes induced by a voltage step from 0 to +130 mV are depicted in percent of control values before application of 10 ng/ml VEGF. VEGF-induced outwardly rectifying currents (n = 7; ***p < 0.005) were clearly suppressed in the presence of 1 μM 3-T1AM (n = 7; **p < 0.01).
Figure 9
Figure 9
Icilin suppressed VEGF-induced Ca2+ increase in UM 92.1 cells. Drugs were added at the indicated time points (arrows). Data are mean ± SEM of 15–85 Ca2+ traces in each set of experiments. (A) CAP (10 μM) induced an irreversible Ca2+ increase (n = 19). A washout did not reduce the Ca2+ levels. Non-treated control cells showed a constant Ca2+ baseline (n = 15). (B) The similar Ca2+ response pattern could be observed with 10 ng/ml VEGF instead of CAP (n = 85). (C) Same experiment as shown in (B), but in the presence of icilin (10 μM) (n = 65). Icilin partially suppressed the VEGF-induced Ca2+ increase (n = 65). Non-treated control cells showed a constant Ca2+ baseline in the presence of icilin (n = 36). (D) Summary of the experiments with CAP, VEGF and icilin. The asterisks (***) show significant Ca2+ increases with CAP and VEGF (n = 15–85; **p < 0.01 at the minimum; unpaired tested).
Figure 10
Figure 10
Menthol suppressed VEGF-induced Ca2+ increase in UM 92.1 cells. Drugs were added at the indicated time points (arrows). Data are mean ± SEM of 15–40 Ca2+ traces in each set of experiments. (A) Moderate cooling (≈27 to 18°C) induced a Ca2+ increase, which partially recovered (n = 17). Non-treated control cells showed a constant Ca2+ baseline (n = 15). (B) TRPM8 activation by menthol (200 μM) led to a Ca2+ increase, which is at lower levels compared to moderate cooling (n = 40). (C) Summary of the experiments with cooling and menthol. The asterisks (*) show significant Ca2+ increases with moderate cooling and menthol (n = 17 - 40; ***p < 0.005; paired tested). (D) The Mean trace showing VEGF-induced Ca2+ increase (n = 25). (E) Same experiment as shown in (D), but in the presence of menthol (200 μM). Menthol clearly suppressed the VEGF-induced Ca2+ increase (n = 32). (F) Summary of the experiments with VEGF and menthol. The asterisks (*) show significant Ca2+ increases with VEGF (n = 25; ***p < 0.005; paired tested). The hashtags (###) show significant Ca2+ decreases in the presence of menthol (n = 32; ###p < 0.005; unpaired tested).
Figure 11
Figure 11
3-T1AM modulation of TRPV1 is associated with cannabinoid receptor type 1 activity. Drugs were added at the indicated time points (arrows). Data are mean ± SEM of 13–53 Ca2+ traces in each set of experiments. (A) WIN 55,212-2 (10 μM) induced a Ca2+ increase, (n = 27). Non-treated control cells showed a constant Ca2+ baseline (n = 34). (B) Ca2+ free condition reduced the intracellular Ca2+ level (baseline) and extracellular application of WIN 55,212-2 (10 μM) strongly increased the intracellular Ca2+ level (n = 53). (C) Summary of the experiments with WIN 55,212-2 with and without external Ca2+. The asterisks (***) show significant Ca2+ increases with WIN 55,212-2 (n = 27 - 53; ***p < 0.005; paired tested). The hashtags (###) show significant stronger Ca2+ increase under external Ca2+ free conditions (n = 53; ###p < 0.005; unpaired tested). (D) Mean trace showing 3-T1AM-induced Ca2+ increase (n = 13) whereas non-treated control cells showed a constant Ca2+ baseline (n = 29). (E) Same experiment as shown in (D), but in the presence of AM251 (10 μM) (n = 46). The 3-T1AM-induced Ca2+ increase is at higher levels compared to the effect without the CB1 blocker. (F) Same experiment as shown in (B), but with 1 μM 3-T1AM instead of WIN 55,212-2. 3-T1AM did not change the intracellular Ca2+ concentration. (G) Summary of the experiments with 3-T1AM with and without AM251 or external Ca2+. The asterisks (***) show significant Ca2+ increases with 3-T1AM (n = 13–46; ***p < 0.005; paired tested). The hashtags (###) show significant difference of the 3-T1AM-induced Ca2+increase with and without AM251 (n = 13–46; ###p < 0.005; unpaired tested).
Figure 12
Figure 12
Suggested Ca2+ signal transduction model accounting for how TRPM8 activation affects receptor-linked signaling pathways (Mergler et al., ; Khajavi et al., 2017). Ca2+ channels such as TRPs of the TRPV1 subtype (capsaicin receptor) can be selectively activated by heat (>43°C) or capsaicin and blocked by CPZ (Figure 1A) (Mergler et al., 2014). VEGF-A activating VEGFR-1/VEGFR-2 can also activate TRPV1 (Figures 2, 3). The TRPM8 subtype (menthol receptor) can be selectively activated by cold (23–28°C), menthol, icilin or 3-T1AM and blocked by BCTC/AMTB (Figures 1D, Figures 5, 6) (Mergler et al., ; Khajavi et al., 2017). Notably, a G-protein coupled receptor (GPCR) coupled to Gi/o proteins could be activated by 3-T1AM (Dinter et al., ; Khajavi et al., ; Schanze et al., 2017). 3-T1AM may also directly activate TRPM8 by a GPCR-independent mechanism (↑[Ca2+]i]) (Khajavi et al., 2017). If TRPM8 is activated by 3-T1AM, 3-T1AM suppresses VEGRF via TRPV1 (Figures 7, 8). Notably, 3-T1AM may also directly suppress TRPV1 via VEGFR by a GPCR-independent mechanism (↓[Ca2+]i]) (Figure 8) Menthol and icilin mimic the 3-T1AM effect and suppresses increases in TRPV1 activity by VEGF (Figures 9, 10).

References

    1. Andersson D. A., Chase H. W., Bevan S. (2004). TRPM8 activation by menthol, icilin, and cold is differentially modulated by intracellular pH. J. Neurosci. 24, 5364–5369. 10.1523/JNEUROSCI.0890-04.2004 - DOI - PMC - PubMed
    1. Bai V. U., Murthy S., Chinnakannu K., Muhletaler F., Tejwani S., Barrack E. R., et al. . (2010). Androgen regulated TRPM8 expression: a potential mRNA marker for metastatic prostate cancer detection in body fluids. Int. J. Oncol. 36, 443–450. 10.3892/ijo_00000518 - DOI - PubMed
    1. Barry P. H. (1994). JPCalc, a software package for calculating liquid junction potential corrections in patch-clamp, intracellular, epithelial and bilayer measurements and for correcting junction potential measurements. J. Neurosci. Methods 51, 107–116. - PubMed
    1. Bautista D. M., Siemens J., Glazer J. M., Tsuruda P. R., Basbaum A. I., Stucky C. L., et al. . (2007). The menthol receptor TRPM8 is the principal detector of environmental cold. Nature 448, 204–208. 10.1038/nature05910 - DOI - PubMed
    1. Behrendt H. J., Germann T., Gillen C., Hatt H., Jostock R. (2004). Characterization of the mouse cold-menthol receptor TRPM8 and vanilloid receptor type-1 VR1 using a fluorometric imaging plate reader (FLIPR) assay. Br. J. Pharmacol. 141, 737–745. 10.1038/sj.bjp.0705652. - DOI - PMC - PubMed