

Monitoring the Process of Endostar-Induced Tumor Vascular Normalization by Non-contrast Intravoxel Incoherent Motion Diffusion-Weighted MRI
- PMID: 30483478
- PMCID: PMC6243029
- DOI: 10.3389/fonc.2018.00524
Monitoring the Process of Endostar-Induced Tumor Vascular Normalization by Non-contrast Intravoxel Incoherent Motion Diffusion-Weighted MRI
Abstract
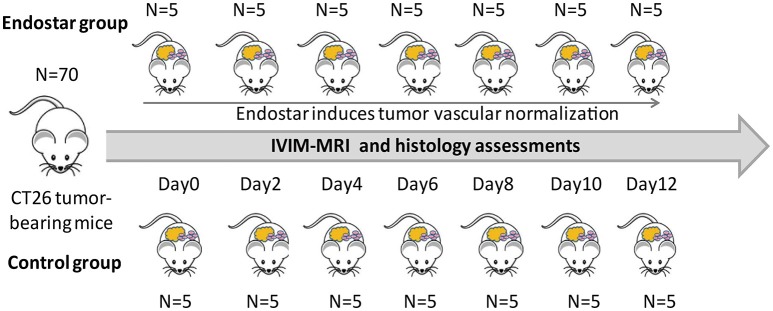
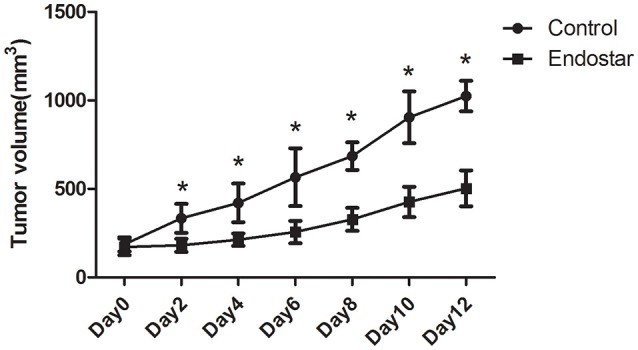
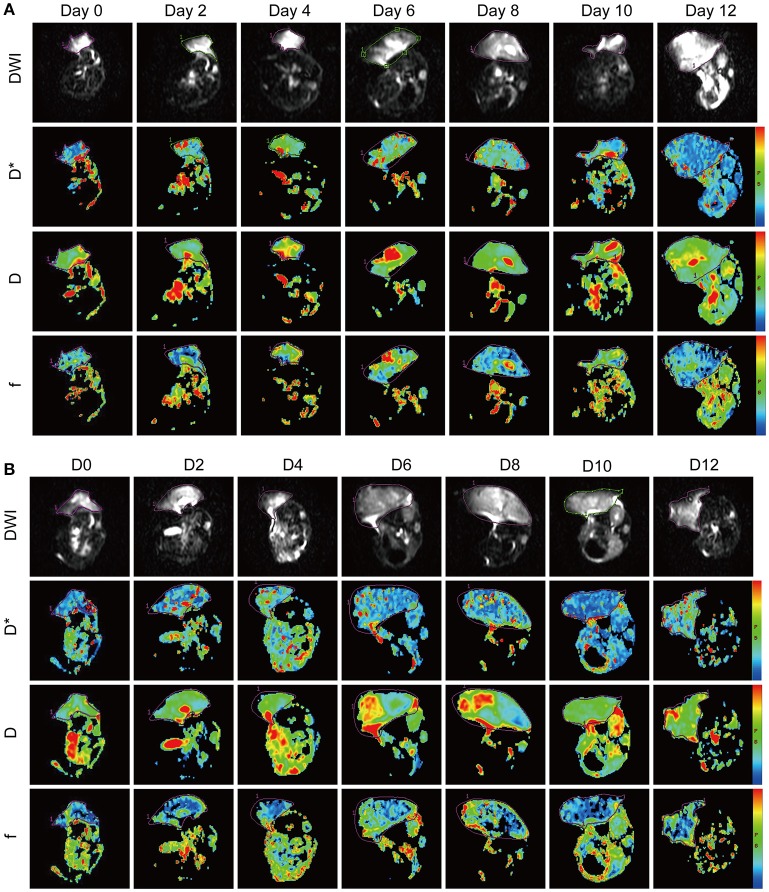
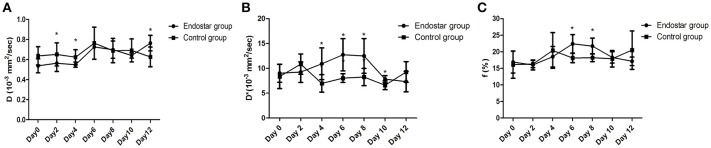
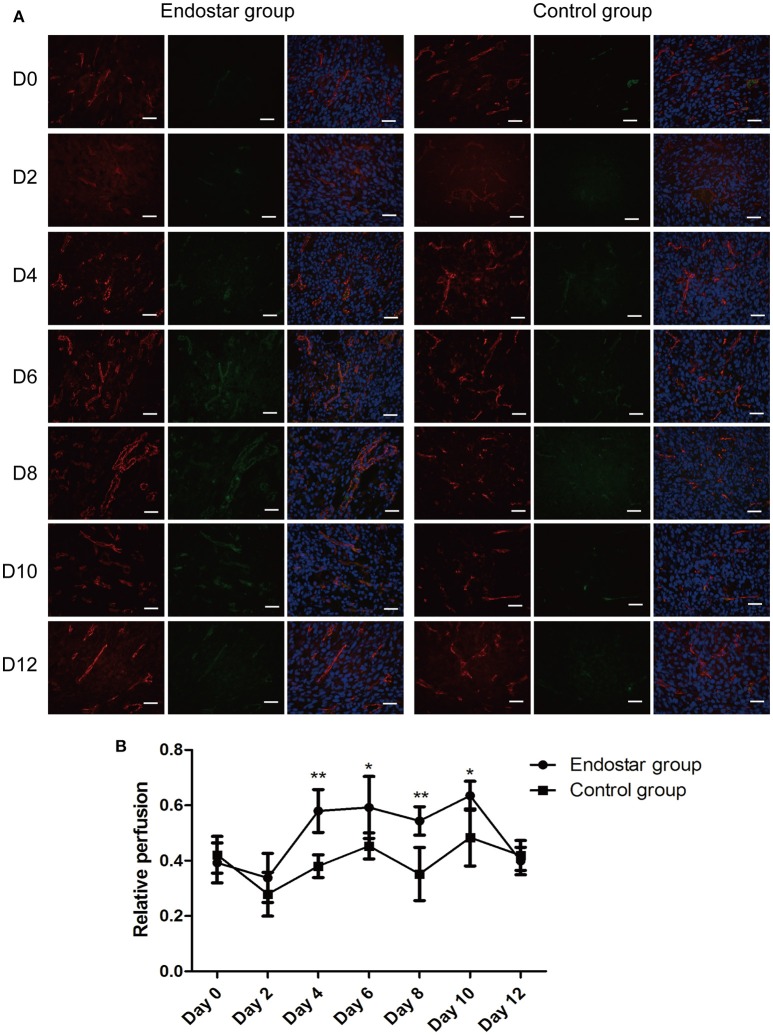
Tumor vascular normalization has been proposed as a new concept in anti-tumor angiogenesis, and the normalization window is considered as an opportunity to increase the effect of chemoradiotherapy. However, there is still a lack of a non-invasive method for monitoring the process of tumor vascular normalization. Intravoxel incoherent motion diffusion-weighted magnetic resonance imaging (IVIM DW-MRI) is an emerging approach which can effectively assess microperfusion in tumors, without the need for exogenous contrast agents. However, its role in monitoring tumor vascular normalization still needs further study. In this study, we established a tumor vascular normalization model of CT26 colon-carcinoma-bearing mice by means of Endostar treatment. We then employed IVIM DW-MRI and immunofluorescence to detect the process of tumor vascular normalization at different times after treatment. We found that the D* values of the Endostar group were significantly higher than those of the control group on days 4, 6, 8, and 10 after treatment, and the f values of the Endostar group were significantly higher than those of the control group on days 6 and 8. Furthermore, we confirmed through analysis of histologic parameters that Endostar treatment induced the CT26 tumor vascular normalization window starting from day 4 after treatment, and this window lasted for 6 days. Moreover, we found that D* and f values were well correlated with pericyte coverage (r = 0.469 and 0.504, respectively; P < 0.001, both) and relative perfusion (r = 0.424 and 0.457, respectively; P < 0.001, both). Taken together, our findings suggest that IVIM DW-MRI has the potential to serve as a non-invasive approach for monitoring Endostar-induced tumor vascular normalization.
Keywords: Endostar; IVIM-DWI; MRI; perfusion; tumor vascular normalization.
Figures


Similar articles
-
Evaluating the efficacy and microenvironment changes of HER2 + gastric cancer during HLX02 and Endostar treatment using quantitative MRI.BMC Cancer. 2022 Oct 3;22(1):1033. doi: 10.1186/s12885-022-10136-y. BMC Cancer. 2022. PMID: 36192709 Free PMC article.
-
[Evaluation of tumor vascular normalization in colorectal cancer mouse mode induced by recombinant human endostatin by intravoxel incoherent motion diffusion-weighted magnetic resonance imaging].Zhonghua Zhong Liu Za Zhi. 2019 Jun 23;41(6):421-428. doi: 10.3760/cma.j.issn.0253-3766.2019.06.005. Zhonghua Zhong Liu Za Zhi. 2019. PMID: 31216827 Chinese.
-
Monitoring Bevacizumab-Induced Tumor Vascular Normalization by Intravoxel Incoherent Motion Diffusion-Weighted MRI.J Magn Reson Imaging. 2022 Aug;56(2):427-439. doi: 10.1002/jmri.28012. Epub 2021 Dec 7. J Magn Reson Imaging. 2022. PMID: 34873766
-
Intravoxel incoherent motion diffusion-weighted imaging for monitoring chemotherapeutic efficacy in gastric cancer.World J Gastroenterol. 2016 Jun 28;22(24):5520-31. doi: 10.3748/wjg.v22.i24.5520. World J Gastroenterol. 2016. PMID: 27350730 Free PMC article.
-
Monitoring of tumor vascular normalization: the key points from basic research to clinical application.Cancer Manag Res. 2018 Oct 3;10:4163-4172. doi: 10.2147/CMAR.S174712. eCollection 2018. Cancer Manag Res. 2018. PMID: 30323672 Free PMC article. Review.
Cited by
-
Application of IVIM-DWI in Detecting the Tumor Vasculogenic Mimicry Under Antiangiogenesis Combined With Oxaliplatin Treatment.Front Oncol. 2020 Aug 18;10:1376. doi: 10.3389/fonc.2020.01376. eCollection 2020. Front Oncol. 2020. PMID: 32974136 Free PMC article.
-
Evaluating the efficacy and microenvironment changes of HER2 + gastric cancer during HLX02 and Endostar treatment using quantitative MRI.BMC Cancer. 2022 Oct 3;22(1):1033. doi: 10.1186/s12885-022-10136-y. BMC Cancer. 2022. PMID: 36192709 Free PMC article.
-
Vascular Normalization: A New Window Opened for Cancer Therapies.Front Oncol. 2021 Aug 12;11:719836. doi: 10.3389/fonc.2021.719836. eCollection 2021. Front Oncol. 2021. PMID: 34476218 Free PMC article. Review.
-
Current trends in the characterization and monitoring of vascular response to cancer therapy.Cancer Imaging. 2024 Oct 23;24(1):143. doi: 10.1186/s40644-024-00767-8. Cancer Imaging. 2024. PMID: 39438891 Free PMC article. Review.
-
Endostatin induces normalization of blood vessels in colorectal cancer and promotes infiltration of CD8+ T cells to improve anti-PD-L1 immunotherapy.Front Immunol. 2022 Oct 24;13:965492. doi: 10.3389/fimmu.2022.965492. eCollection 2022. Front Immunol. 2022. PMID: 36389685 Free PMC article.
References
LinkOut - more resources
Full Text Sources