Review
. 2018 Nov 13:6:165.
doi: 10.3389/fbioe.2018.00165. eCollection 2018.

Computational Modeling and Reverse Engineering to Reveal Dominant Regulatory Interactions Controlling Osteochondral Differentiation: Potential for Regenerative Medicine

Affiliations
Review

Computational Modeling and Reverse Engineering to Reveal Dominant Regulatory Interactions Controlling Osteochondral Differentiation: Potential for Regenerative Medicine

Raphaelle Lesage et al. Front Bioeng Biotechnol. .

Abstract

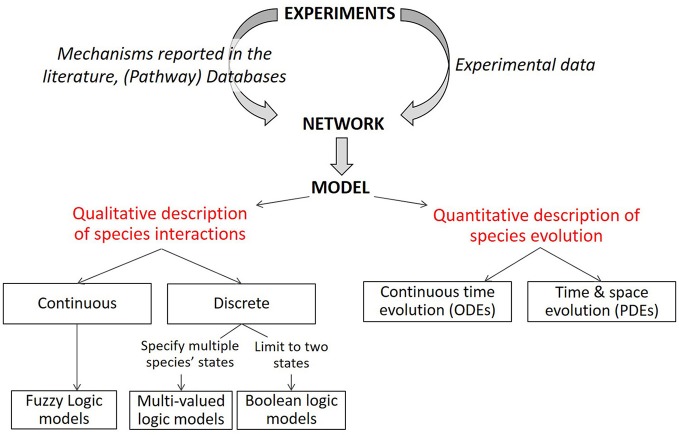
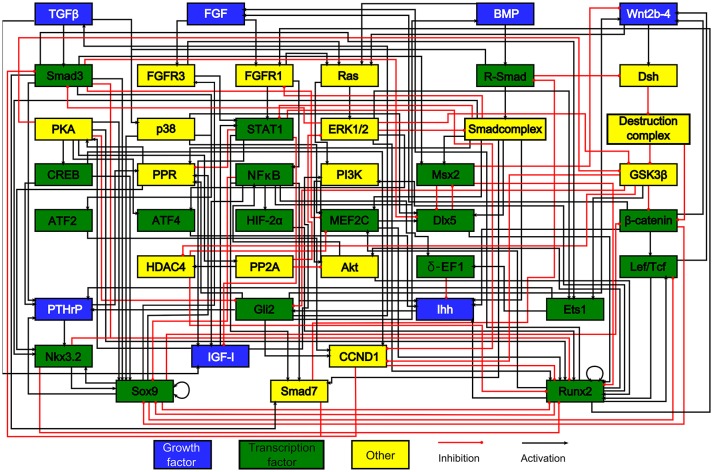
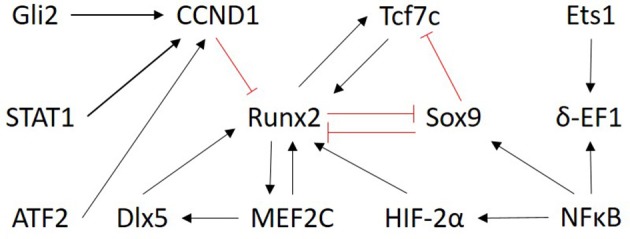
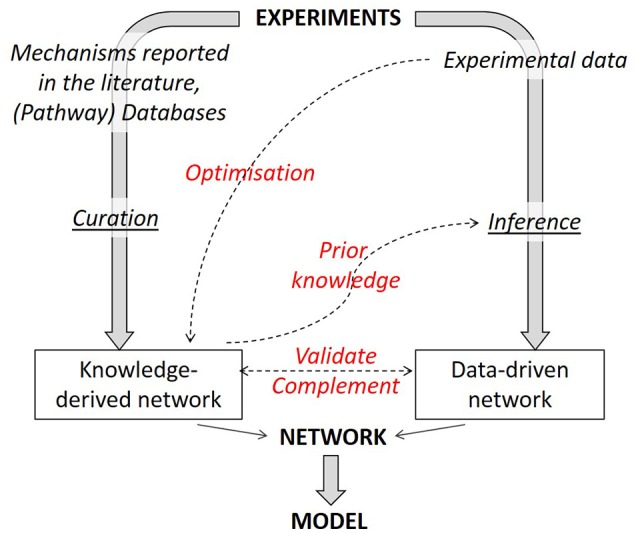
The specialization of cartilage cells, or chondrogenic differentiation, is an intricate and meticulously regulated process that plays a vital role in both bone formation and cartilage regeneration. Understanding the molecular regulation of this process might help to identify key regulatory factors that can serve as potential therapeutic targets, or that might improve the development of qualitative and robust skeletal tissue engineering approaches. However, each gene involved in this process is influenced by a myriad of feedback mechanisms that keep its expression in a desirable range, making the prediction of what will happen if one of these genes defaults or is targeted with drugs, challenging. Computer modeling provides a tool to simulate this intricate interplay from a network perspective. This paper aims to give an overview of the current methodologies employed to analyze cell differentiation in the context of skeletal tissue engineering in general and osteochondral differentiation in particular. In network modeling, a network can either be derived from mechanisms and pathways that have been reported in the literature (knowledge-based approach) or it can be inferred directly from the data (data-driven approach). Combinatory approaches allow further optimization of the network. Once a network is established, several modeling technologies are available to interpret dynamically the relationships that have been put forward in the network graph (implication of the activation or inhibition of certain pathways on the evolution of the system over time) and to simulate the possible outcomes of the established network such as a given cell state. This review provides for each of the aforementioned steps (building, optimizing, and modeling the network) a brief theoretical perspective, followed by a concise overview of published works, focusing solely on applications related to cell fate decisions, cartilage differentiation and growth plate biology. Particular attention is paid to an in-house developed example of gene regulatory network modeling of growth plate chondrocyte differentiation as all the aforementioned steps can be illustrated. In summary, this paper discusses and explores a series of tools that form a first step toward a rigorous and systems-level modeling of osteochondral differentiation in the context of regenerative medicine.

Keywords: chondrocyte; differentiation; gene regulatory network; in silico modeling; network inference; regenerative medicine.


Figures

Figure 1
Figure 1
Description of modeling formalisms. Starting from a static network graph obtained from experimental data, various modeling approaches can be used to simulate the evolution over time of the network components. Quantitative models describe the evolution of species over time with ordinary differential equations (ODE) and can introduce spatial resolution with partial differential equations. Qualitative models (limited here to logical models) describe the evolution of species in terms of logical statements. Discrete logic can specify two or more levels for each modeled species (only two for Boolean logic). Various methods of describing discrete or Boolean logical models with piece-wise continuous equations or logic-based ODEs have been successfully implemented to represent biochemical signaling networks. Modified from Morris et al. (2010).
Figure 2
Figure 2
The model's chondrocyte gene network. Every box represents a gene, its protein or in some cases a complex of them. The interactions are represented by red and black lines if they are inhibitory and stimulatory, respectively. Blue boxes denote growth factors, green boxes are transcription factors, yellow boxes do not belong to either category. Reproduced from Kerkhofs and Geris (2015).
Figure 3
Figure 3
Overview of the subnetwork of factors selected for inference. The regulatory interactions are those present in the literature derived model (Kerkhofs et al., 2016). Only the nodes are considered as input for the ensemble inference. Red and black arrows indicate inhibition and activation, respectively.
Figure 4
Figure 4
Strategies to combine knowledge-derived and data-based modeling. When deriving a network graph from experimental results, different routes can be followed, either a mechanistic one (using available knowledge) or a data-driven one. Combining both strategies allows to obtain an optimized network graph. Knowledge-derived networks can be fitted against experimental data to optimize network parameters. Knowledge-derived networks can serve as prior knowledge within some inference algorithms in order to improve inference performance. Finally, data-driven networks can be used to validate or complement (add or remove interactions) a knowledge-derived one and vice versa.
Figure 5
Figure 5
Receiver Operating Characteristic (ROC) and Precision Recall (PR) curves for inferred consensus network with respect to knowledge-based network and STRING network. The ROC plots the True Prediction Rate (TPR) against the False Prediction Rate (FPR) for each (cumulative) interaction inferred. The PR curve plots the precision vs. the recall for each (cumulative) interaction inferred. (A) ROC curve for the inferred consensus network compared to the literature-derived topology. (B) PR curve for the inferred consensus network compared to literature-derived topology. (C) ROC curve for the inferred consensus topology compared to the STRING network. (D) PR curve for the inferred consensus topology compared to the STRING network.

Similar articles

Cited by

References

    1. Abou-Jaoudé W., Traynard P., Monteiro P. T., Saez-Rodriguez J., Helikar T., Thieffry D., et al. . (2016). Logical modeling and dynamical analysis of cellular networks. Front. Genet. 7:94. 10.3389/fgene.2016.00094 - DOI - PMC - PubMed
    1. Agoston H., Khan S., James C. G., Gillespie J. R., Serra R., Stanton L. A., et al. . (2007). C-type natriuretic peptide regulates endochondral bone growth through p38 MAP kinase-dependent and -independent pathways. BMC Dev. Biol. 7:18. 10.1186/1471-213X-7-18 - DOI - PMC - PubMed
    1. Aldridge B. B., Saez-Rodriguez J., Muhlich J. L., Sorger P. K., Lauffenburger D. A. (2009). Fuzzy logic analysis of kinase pathway crosstalk in TNF/EGF/insulin-induced signaling. PLoS Comput. Biol. 5:e1000340. 10.1371/journal.pcbi.1000340 - DOI - PMC - PubMed
    1. Ay A., Arnosti D. N. (2011). Mathematical modeling of gene expression: a guide for the perplexed biologist. Crit. Rev. Biochem. Mol. Biol. 46, 137–151. 10.3109/10409238.2011.556597 - DOI - PMC - PubMed
    1. Bernot G., Comet J. P., Richard A., Guespin J. (2004). Application of formal methods to biological regulatory networks: extending Thomas' asynchronous logical approach with temporal logic. J. Theor. Biol. 229, 339–347. 10.1016/j.jtbi.2004.04.003 - DOI - PubMed