The Hypervariable Loops of Free TCRs Sample Multiple Distinct Metastable Conformations in Solution
- PMID: 30483515
- PMCID: PMC6243104
- DOI: 10.3389/fmolb.2018.00095
The Hypervariable Loops of Free TCRs Sample Multiple Distinct Metastable Conformations in Solution
Abstract
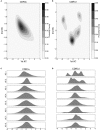
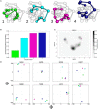
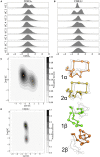
CD4+ and CD8+ αβ T cell antigen recognition is determined by the interaction between the TCR Complementarity Determining Region (CDR) loops and the peptide-presenting MHC complex. These T cells are known for their ability to recognize multiple pMHC complexes, and for a necessary promiscuity that is required for their selection and function in the periphery. Crystallographic studies have previously elucidated the role of structural interactions in TCR engagement, but our understanding of the dynamic process that occurs during TCR binding is limited. To better understand the dynamic states that exist for TCR CDR loops in solution, and how this relates to their states when in complex with pMHC, we simulated the 2C T cell receptor in solution using all-atom molecular dynamics in explicit water and constructed a Markov State Model for each of the CDR3α and CDR3β loops. These models reveal multiple metastable states for the CDR3 loops in solution. Simulation data and metastable states reproduce known CDR3β crystal conformations, and reveal several novel conformations suggesting that CDR3β bound states are the result of search processes from nearby pre-existing equilibrium conformational states. Similar simulations of the invariant, Type I Natural Killer T cell receptor NKT15, which engages the monomorphic, MHC-like CD1d ligand, demonstrate that iNKT TCRs also have distinct states, but comparatively restricted degrees of motion.
Keywords: T cell receptor dynamics; adaptive immunity; independent component (IC) analysis; innate immunity; markov state models; molecular dynamics (MD).
Figures


Similar articles
-
Innate-like control of human iNKT cell autoreactivity via the hypervariable CDR3beta loop.PLoS Biol. 2010 Jun 22;8(6):e1000402. doi: 10.1371/journal.pbio.1000402. PLoS Biol. 2010. PMID: 20585371 Free PMC article.
-
Quantifying conformational changes in the TCR:pMHC-I binding interface.Front Immunol. 2024 Dec 2;15:1491656. doi: 10.3389/fimmu.2024.1491656. eCollection 2024. Front Immunol. 2024. PMID: 39687625 Free PMC article.
-
Conformational changes and flexibility in T-cell receptor recognition of peptide-MHC complexes.Biochem J. 2008 Oct 15;415(2):183-96. doi: 10.1042/BJ20080850. Biochem J. 2008. PMID: 18800968 Free PMC article. Review.
-
Disparate degrees of hypervariable loop flexibility control T-cell receptor cross-reactivity, specificity, and binding mechanism.J Mol Biol. 2011 Dec 2;414(3):385-400. doi: 10.1016/j.jmb.2011.10.006. Epub 2011 Oct 12. J Mol Biol. 2011. PMID: 22019736 Free PMC article.
-
MHC Molecules, T cell Receptors, Natural Killer Cell Receptors, and Viral Immunoevasins-Key Elements of Adaptive and Innate Immunity.Adv Exp Med Biol. 2019;1172:21-62. doi: 10.1007/978-981-13-9367-9_2. Adv Exp Med Biol. 2019. PMID: 31628650 Review.
Cited by
-
T-Cell Receptor CDR3 Loop Conformations in Solution Shift the Relative Vα-Vβ Domain Distributions.Front Immunol. 2020 Jul 8;11:1440. doi: 10.3389/fimmu.2020.01440. eCollection 2020. Front Immunol. 2020. PMID: 32733478 Free PMC article.
-
Computational Structural Biology: Successes, Future Directions, and Challenges.Molecules. 2019 Feb 12;24(3):637. doi: 10.3390/molecules24030637. Molecules. 2019. PMID: 30759724 Free PMC article. Review.
-
Enhanced T cell receptor specificity through framework engineering.Front Immunol. 2024 Mar 12;15:1345368. doi: 10.3389/fimmu.2024.1345368. eCollection 2024. Front Immunol. 2024. PMID: 38545094 Free PMC article.
-
T-cell receptor structures and predictive models reveal comparable alpha and beta chain structural diversity despite differing genetic complexity.Commun Biol. 2025 Mar 4;8(1):362. doi: 10.1038/s42003-025-07708-6. Commun Biol. 2025. PMID: 40038394 Free PMC article.
-
Comparative Analysis of the CDR Loops of Antigen Receptors.Front Immunol. 2019 Oct 15;10:2454. doi: 10.3389/fimmu.2019.02454. eCollection 2019. Front Immunol. 2019. PMID: 31681328 Free PMC article.
References
Grants and funding
LinkOut - more resources
Full Text Sources
Research Materials

