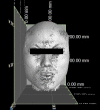
Multiple regression analysis of the craniofacial region of Chinese Han people using linear and angular measurements based on MRI
- PMID: 30483617
- PMCID: PMC6197125
- DOI: 10.1080/20961790.2016.1276120
Multiple regression analysis of the craniofacial region of Chinese Han people using linear and angular measurements based on MRI
Abstract
The purpose of this study was to measure the craniofacial region of Chinese Han people in the linear and angular dimensions, and to analyse the effects on sex, age and body parameters (height and weight). All 250 individuals (86 males, 164 females) underwent a three-dimensional magnetic resonance imaging (MRI) scan, and the MRI data were imported into VG Studio MAX 2.2 software. Each linear and angular measurement in the craniofacial region was processed directly. Using SPSS 20.0 software, nine multiple regression equations were constructed, and all the adjusted R 2 values were statistically significant (0.031-0.311). Multiple regression analysis showed that most craniofacial measurements of Chinese people were significantly correlated with height, weight or age. The multiple regression equations constructed will be helpful in anthropometric analysis and forensic inference.
Keywords: Forensic science; anthropometry; forensic anthropology; magnetic resonance imaging; regression analysis.
Figures


Similar articles
-
[Relationship between Body Height and Craniofacial Lines Measured by CT in Southwest Han Males].Fa Yi Xue Za Zhi. 2016 Apr;32(2):97-9. Fa Yi Xue Za Zhi. 2016. PMID: 27501679 Chinese.
-
Three-dimensional anthropometric analysis of the Chinese nose.J Plast Reconstr Aesthet Surg. 2010 Nov;63(11):1832-9. doi: 10.1016/j.bjps.2009.11.035. Epub 2010 Jan 13. J Plast Reconstr Aesthet Surg. 2010. PMID: 20056506
-
Estimation of stature by using the dimensions of the right hand and right foot in Han Chinese adults.Sci China Life Sci. 2017 Jan;60(1):81-90. doi: 10.1007/s11427-016-0051-8. Epub 2016 Dec 21. Sci China Life Sci. 2017. PMID: 28008554
-
Stature estimation from craniofacial anthropometry in Bangladeshi Garo adult females.Mymensingh Med J. 2012 Jul;21(3):479-84. Mymensingh Med J. 2012. PMID: 22828547
-
Assessment of nasal profiles for forensic facial approximation in a modern Korean population of known age and sex.Leg Med (Tokyo). 2020 Feb;42:101646. doi: 10.1016/j.legalmed.2019.101646. Epub 2019 Nov 14. Leg Med (Tokyo). 2020. PMID: 31751793
References
-
- Vanezi P, Vanezis M, Mccombe G, et al. . Facial reconstruction using 3-D computer graphics. Forensic Sci Int. 2000;108:81–95. - PubMed
-
- Olszewski R, Cosnard G, Macq B, et al. . 3D CT-based cephalometric analysis: 3D cephalometric theoretical concept and software. Neuroradiology. 2006;48:853–862. - PubMed
-
- Graviero G, Guastini L, Mora R, et al. . The role of three-dimensional CT in the evaluation of nasal structures and anomalies. Eur Arch Otorhinolaryngol. 2011;268:1163–1167. - PubMed
-
- Nishida Y, Tian S, Isberg B, et al. . MRI measurements of orbital tissues in dysthyroid ophthalmopathy. Graefe's Arch Clin Exp Ophthalmol. 2001;239:824–831. - PubMed
-
- Cosottini M, Ceravolo R, Faggioni L, et al. . Assessment of midbrain atrophy in patients with progressive supranuclear palsy with routine magnetic resonance imaging. Acta Neurol Scand. 2007;116:37–42. - PubMed
LinkOut - more resources
Full Text Sources

