. 2019 Feb;43(2):868-878.
doi: 10.3892/ijmm.2018.3998. Epub 2018 Nov 26.

Expression of FKBP52 in the ovaries of PCOS rats

Affiliations

Expression of FKBP52 in the ovaries of PCOS rats

Shiyan Song et al. Int J Mol Med. 2019 Feb.

Abstract

The present study aimed to examine the expression of FK‑506 binding protein 52 (FKBP52) in the ovary tissues of rats with polycystic ovarian syndrome (PCOS) and its action on mediating androgen receptor (AR) through the mitogen‑activated protein kinase (MAPK)/extracellular signal‑regulated kinase (ERK) pathway. PCOS model rats were established by dehydroepiandrosterone injection. Enzyme‑linked immunosorbent assay (ELISA) measured serum sex hormones. Hematoxylin and eosin (H&E) staining was used to examine histological changes of the ovarian tissues. The expression levels of FKBP52 were detected by immunohistochemical (IHC) staining, reverse transcription‑quantitative polymerase chain reaction (RT‑qPCR) analysis and western blotting (WB). In addition, RT‑qPCR analysis was used to detect the mRNA expression of AR, and WB was used to detect the protein expression levels of AR, ERK1/2 and phosphorylated (p‑)ERK1/2. In granulosa cell (GC) experiments, primary GCs were extracted and cultured. FKBP4 is the FKBP52‑encoding gene, therefore, adenovirus vectors Ad‑Oe‑FKBP4‑EGFP and Ad‑siRNA‑FKBP4‑EGFP were constructed to examine the association among the above factors using the RT‑qPCR and WB methods. In the animal experiment, the vaginal smear, H&E staining and ELISA results showed that the PCOS model was successfully established. The IHC staining revealed that the expression of FKBP52 in the GCs of the PCOS model group was higher than the remaining groups (P<0.01). The mRNA and expression levels of FKBP52 and AR in the PCOS model rats were significantly increased, when compared with levels in the other rats (P<0.05). The expression level of p‑ERK1/2 was also higher (P<0.05). In the GC experiment, following overexpression of the FKBP4 gene, the mRNA and expression levels of FKBP52 and AR were increased (P<0.05). The expression level of p‑ERK1/2 was also increased (P<0.05). Following FKBP4 gene silencing, the mRNA and expression levels of FKBP52 and AR were decreased (P<0.05). The expression level of ERK1/2 was also decreased (P<0.05). However, the expression level of p‑ERK1/2 was increased (P<0.05). In conclusion, the upregulation of co‑chaperone FKBP52 may mediate the activation of AR through the MAPK/ERK pathway.


Figures

Figure 1
Figure 1
PCOS model evaluation. (A) Microscopy of stained smears of vaginal secretions (toluidine blue staining; magnification, ×100; n=20 per group). Estrus (keratinized epithelial cells); metaestrus (keratinized epithelial cells, epithelial cells, and white blood cells); anestrus (white blood cells); proestrus (epithelial cells). NC and OC groups had regular estrous cycle, however, rats in the PM group remained in the estrus period and lost their regular estrous cycles, suggesting anovulation. (B) Comparison of body weight, ovarian weight and organ coefficient among the three groups (mean ± SD, n=20 per group). Body weights at 21 and 58 days did not differ significantly among groups, whereas PM group ovarian weight and organ coefficient were significantly lower. (C) Comparison of rat ovarian structure (hematoxylin and eosin staining, ×25 magnification, n=4 per group). Morphological changes of rat ovarian tissue specimens were examined by light microscopy. In the NC and OC groups, microscopic examination revealed the presence of follicles of different developmental stages and a few corpora lutea; granulosa cells were orderly arranged with an intact form, mostly in 6-8 layers. In the PM group, the number of follicles with saccular dilatation increased, whereas follicles of different developmental stages and corpora lutea were rare; granulosa cells were arranged loosely in ~2-3 layers, with atresia of some follicles. This result was consistent with PCOS characteristics. (D) Comparison of FSH, LH, LH/FSH, P, E2, T and E2/T among groups (mean ± SD, n=20 per group). Sex hormones were measured by enzyme-linked immunosorbent assay. No significant differences in FSH, LH or LH/FSH were found. However, E2 and T in the PM group were significantly higher, and E2/T was significantly lower. Experiments were performed in triplicate and repeated three times. ***P<0.0001 and ****P<0.0001 NC group vs. PM group; ##P<0.01 and ####P<0.0001 OC group vs. PM group. PCOS, polycystic ovarian syndrome; PM, PCOS model; NC, normal control; OC, oil control; FSH, follicle stimulating hormone; LH, luteinizing hormone; E2, estradiol; P, progesterone; T, total testosterone; F, follicle; CL, corpora lutea; SD, standard deviation.
Figure 2
Figure 2
Comparison of the expression of FKBP52 in the ovaries of three groups (immunohistochemistry; magnification, ×200; GCs, n=4 per group). FKBP52-positive staining (yellow) was present in the nucleus and cytoplasm (indicated by black triangle) among all types of cells in the rat ovary. In GCs, expression of FKBP52 in the PM group was higher than in the other two groups. **P<0.01 NC group vs. PM group; ##P<0.01 OC group vs. PM group. FKBP52, FK-506 binding protein 52; PM, polycystic ovarian syndrome model; NC, normal control; OC, oil control.
Figure 3
Figure 3
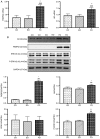
Expression of FKBP52, AR, ERK1/2 and p-ERK1/2 in rats. (A) Comparison of mRNA expression levels of FKBP52 and AR among the three groups (mean ± SD, n=8 per group). The mRNA expression levels of FKBP52 and AR in the rat ovarian tissues of the PM group were significantly higher than those in the NC and OC groups. No significant difference was found between the NC and OC groups (P>0.05). (B) Comparison of protein expression levels of FKBP52, AR, ERK1/2 and p-ERK1/2 among the three groups (mean ± SD, n=8 per group). The protein expression levels of FKBP52, AR and p-ERK1/2 in the rat ovarian tissues of the PM group were significantly higher than those in the NC and OC groups. No significant difference was found between the NC and OC groups. Protein expression of ERK1/2 did not differ significantly among the groups. Experiments were performed in triplicate and repeated three times. *P<0.05, **P<0.01 and ***P<0.001 NC group vs. PM group; #P<0.05, ##P<0.01 and ###P<0.001 OC group vs. PM group. FKBP52, FK-506 binding protein 52; AR, androgen receptor; ERK1/2, extracellular signal-regulated kinase; p-ERK1/2, phosphorylated ERK1/2; PM, polycystic ovarian syndrome model; NC, normal control; OC, oil control; SD, standard deviation.
Figure 4
Figure 4
Morphology and identification of GCs (hematoxylin and eosin staining, magnification, ×200; immunocytochemistry staining, magnification ×200; IF staining, magnification ×400). (A) GCs exhibited polygonal or cuboidal appearance under inverted phase contrast microscopy on adhering to the culture surface, proliferating, and spreading to form a monolayer. (B) FSHR-positive staining (yellow) was present in the nucleus and cytoplasm of GCs. IF staining was performed; (C) the positive rate was >95%, therefore, the GCs extracted met the requirements of subsequent trials. GCs, granulosa cells; FSHR, follicle stimulating hormone receptor; IF, immunofluorescence.
Figure 5
Figure 5
Expression of green fluorescence in GCs. (A) Oe negative control virus group, 1011 PFU/ml, MOI=200; (B) FKBP4-Oe virus group, 2×10¹⁰ PFU/ml, MOI=400; (C) RNAi negative control virus group, 5×10¹⁰ PFU/ml, MOI=100; (D) FKBP4-RNAi virus group, 2×10¹⁰ PFU/ml, MOI=400). The cell transfection rate was >80%. Magnification, ×100. GCs, granulosa cells; MOI, multiplicity of infection.
Figure 6
Figure 6
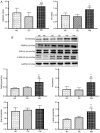
Expression of FKBP52, AR, ERK1/2 and p-ERK1/2 in GCs. (A) Comparison of the mRNA expression levels of FKBP52 and AR mRNA (mean ± SD, n=9 per group). mRNA expression levels of FKBP52 and AR in the FO group were significantly higher than those in the CO and EO groups. No significant difference was found between the CO and EO groups (P>0.05). (B) Comparison of the protein expression levels of FKBP52, AR, ERK1/2 and p-ERK1/2 (mean ± SD, n=6 per group). Protein expression levels of FKBP52, AR and p-ERK1/2 in the FO group were significantly higher than those in the CO and EO groups. No significant difference was found between the CO and EO groups. Protein expression of ERK1/2 did not differ significantly among the groups. (C) Comparison of the mRNA expression levels of FKBP52 and AR (mean ± SD, n=9 per group). mRNA expression levels of FKBP52 and AR in the FR group were significantly lower than those in the CR and ER groups. No significant difference was found between the CR and ER groups (P>0.05). (D) Comparison of the protein expression levels of FKBP52, AR, ERK1/2 and p-ERK1/2 (mean ± SD, n=6 per group). Protein expression levels of FKBP52, AR and ERK1/2 in the FR group were significantly lower than those in the CR and ER groups. p-ERK1/2 showed the opposite result. No significant difference was found between the CR and ER groups. The experiment was repeated three times. *P<0.05, **P<0.01 and ***P<0.001 NC group vs. PM group; #P<0.05, ##P<0.01 and ###P<0.001 OC group vs. PM group. FKBP52, FK-506 binding protein 52; AR, androgen receptor; ERK1/2, extracellular signal-regulated kinase; p-ERK1/2, phosphorylated ERK1/2; PM, polycystic ovarian syndrome model; NC, normal control; OC, oil control; SD, standard deviation.
Figure 6
Figure 6
Expression of FKBP52, AR, ERK1/2 and p-ERK1/2 in GCs. (A) Comparison of the mRNA expression levels of FKBP52 and AR mRNA (mean ± SD, n=9 per group). mRNA expression levels of FKBP52 and AR in the FO group were significantly higher than those in the CO and EO groups. No significant difference was found between the CO and EO groups (P>0.05). (B) Comparison of the protein expression levels of FKBP52, AR, ERK1/2 and p-ERK1/2 (mean ± SD, n=6 per group). Protein expression levels of FKBP52, AR and p-ERK1/2 in the FO group were significantly higher than those in the CO and EO groups. No significant difference was found between the CO and EO groups. Protein expression of ERK1/2 did not differ significantly among the groups. (C) Comparison of the mRNA expression levels of FKBP52 and AR (mean ± SD, n=9 per group). mRNA expression levels of FKBP52 and AR in the FR group were significantly lower than those in the CR and ER groups. No significant difference was found between the CR and ER groups (P>0.05). (D) Comparison of the protein expression levels of FKBP52, AR, ERK1/2 and p-ERK1/2 (mean ± SD, n=6 per group). Protein expression levels of FKBP52, AR and ERK1/2 in the FR group were significantly lower than those in the CR and ER groups. p-ERK1/2 showed the opposite result. No significant difference was found between the CR and ER groups. The experiment was repeated three times. *P<0.05, **P<0.01 and ***P<0.001 NC group vs. PM group; #P<0.05, ##P<0.01 and ###P<0.001 OC group vs. PM group. FKBP52, FK-506 binding protein 52; AR, androgen receptor; ERK1/2, extracellular signal-regulated kinase; p-ERK1/2, phosphorylated ERK1/2; PM, polycystic ovarian syndrome model; NC, normal control; OC, oil control; SD, standard deviation.

Similar articles

Cited by

References

    1. Chiofalo B, Laganà AS, Palmara V, Granese R, Corrado G, Mancini E, Vitale SG, Ban Frangež H, Vrtačnik-Bokal E, Triolo O. Fasting as possible complementary approach for poly-cystic ovary syndrome: Hope or hype. Med Hypotheses. 2017;105:1–3. doi: 10.1016/j.mehy.2017.06.013. - DOI - PubMed
    1. Asemi Z, Samimi M, Taghizadeh M, Esmaillzadeh A. Effects of Ramadan fasting on glucose homeostasis, lipid profiles, inflammation and oxidative stress in women with polycystic ovary syndrome in Kashan, Iran. Arch Iran Med. 2015;18:806–810. - PubMed
    1. Franks S. Controversy in clinical endocrinology: Diagnosis of polycystic ovarian syndrome: In defense of the rotterdam criteria. J Clin Endocrinol Metab. 2006;91:786–789. doi: 10.1210/jc.2005-2501. - DOI - PubMed
    1. Qu J, Wang Y, Wu X, Gao L, Hou L, Erkkola R. Insulin resistance directly contributes to androgenic potential within ovarian theca cells. Fertil Steril. 2009;91:1990–1997. doi: 10.1016/j.fertnstert.2008.02.167. - DOI - PubMed
    1. Laganà AS, Pizzo A. Authors’ reply to: ‘Empiric’ inositol supplementation in normal-weight non-insulin resistant women with polycystic ovarian disease: From the absence of benefit to the potential adverse effects. Arch Gynecol Obstet. 2015;291:959–960. doi: 10.1007/s00404-015-3663-8. - DOI - PubMed

MeSH terms