Observational Study
. 2019 Mar;62(3):473-484.
doi: 10.1007/s00125-018-4781-1. Epub 2018 Nov 27.

Maternal metabolites during pregnancy are associated with newborn outcomes and hyperinsulinaemia across ancestries

Affiliations
Observational Study

Maternal metabolites during pregnancy are associated with newborn outcomes and hyperinsulinaemia across ancestries

Rachel Kadakia et al. Diabetologia. 2019 Mar.

Abstract

Aims/hypothesis: We aimed to determine the association of maternal metabolites with newborn adiposity and hyperinsulinaemia in a multi-ethnic cohort of mother-newborn dyads.

Methods: Targeted and non-targeted metabolomics assays were performed on fasting and 1 h serum samples from a total of 1600 mothers in four ancestry groups (Northern European, Afro-Caribbean, Mexican American and Thai) who participated in the Hyperglycemia and Adverse Pregnancy Outcome (HAPO) study, underwent an OGTT at ~28 weeks gestation and whose newborns had anthropometric measurements at birth.

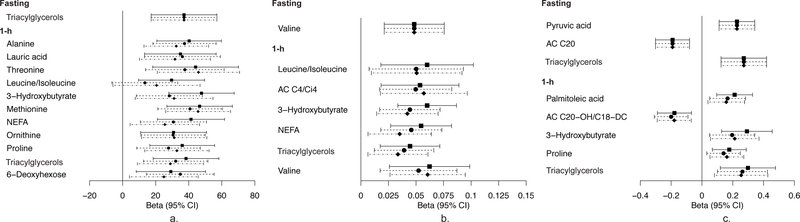
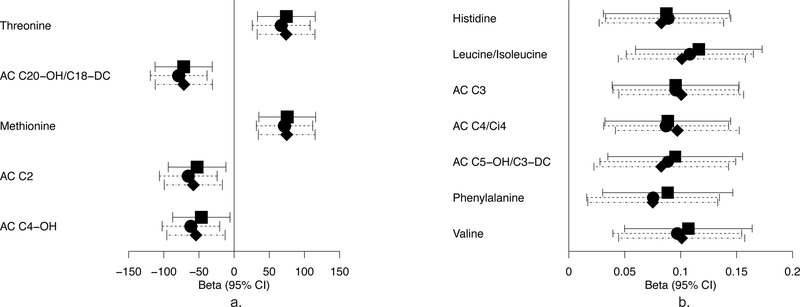
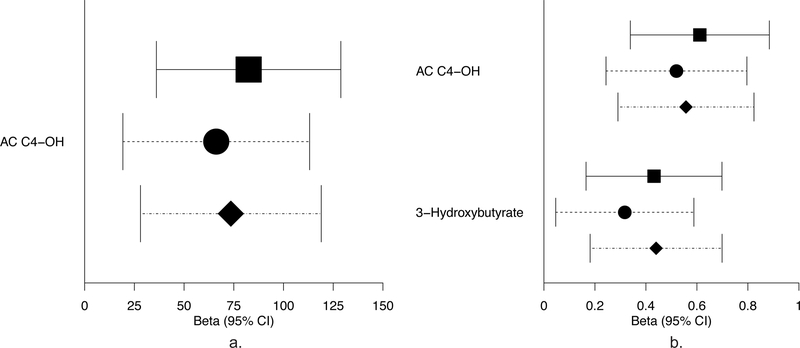
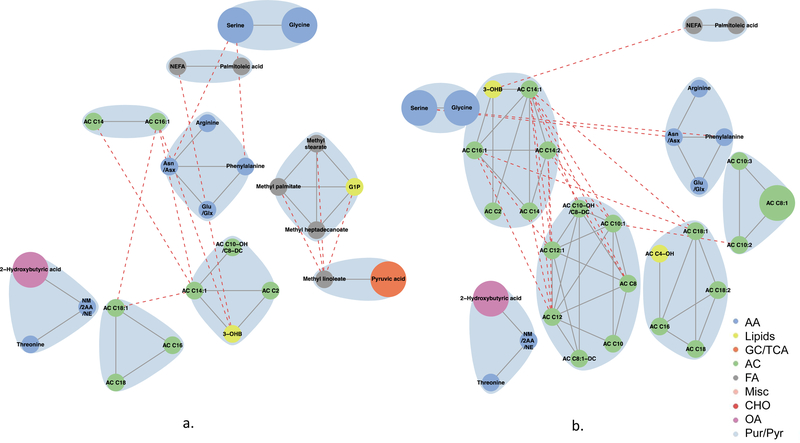
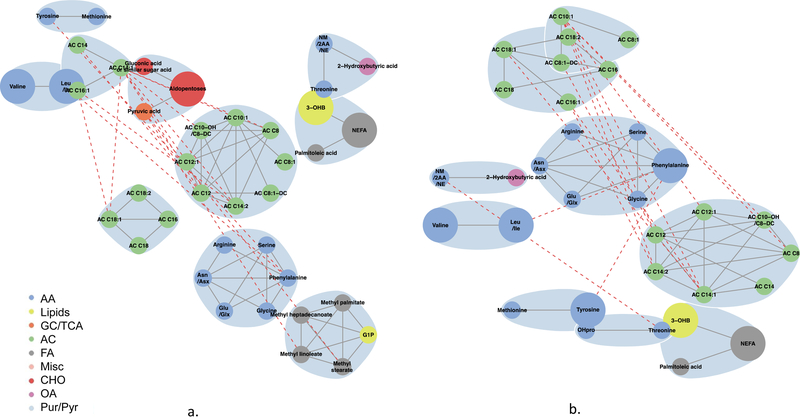
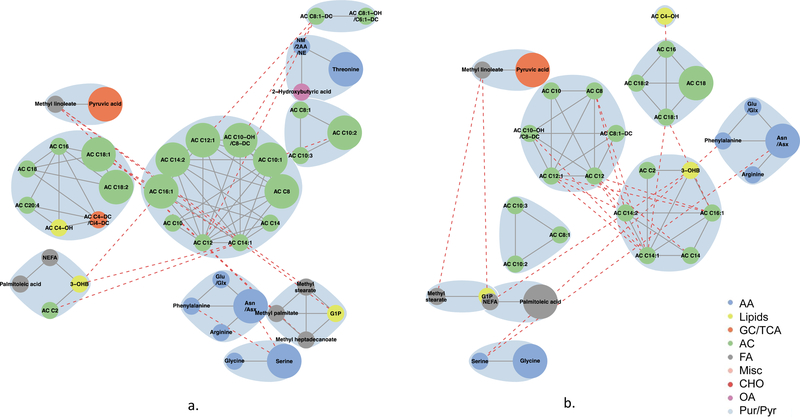
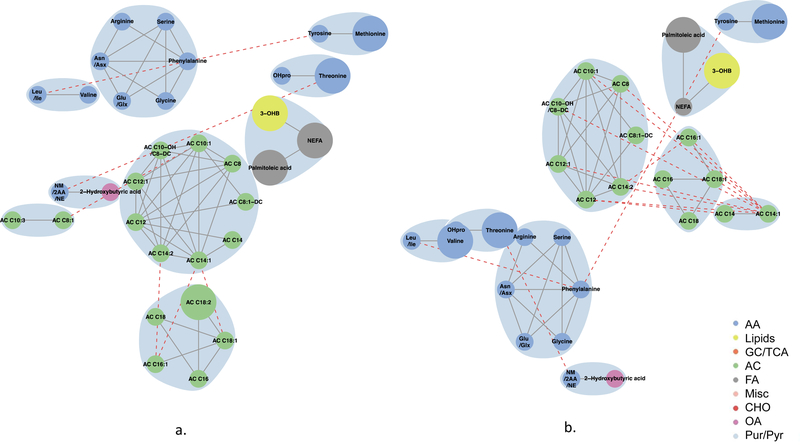
Results: In this observational study, meta-analyses demonstrated significant associations of maternal fasting and 1 h metabolites with birthweight, cord C-peptide and/or sum of skinfolds across ancestry groups. In particular, maternal fasting triacylglycerols were associated with newborn sum of skinfolds. At 1 h, several amino acids, fatty acids and lipid metabolites were associated with one or more newborn outcomes. Network analyses revealed clusters of fasting acylcarnitines, amino acids, lipids and fatty acid metabolites associated with cord C-peptide and sum of skinfolds, with the addition of branched-chain and aromatic amino acids at 1 h.

Conclusions/interpretation: The maternal metabolome during pregnancy is associated with newborn outcomes. Maternal levels of amino acids, acylcarnitines, lipids and fatty acids and their metabolites during pregnancy relate to fetal growth, adiposity and cord C-peptide, independent of maternal BMI and blood glucose levels.

Keywords: Adiposity; Fetal growth; Metabolomics; Pregnancy outcomes.


Conflict of interest statement

Duality of interest

The authors declare that there is no duality of interest associated with this manuscript.

Figures

Fig. 1
Fig. 1
Maternal metabolites associated with newborn outcomes across ancestries. Forest plot depicting maternal metabolites after fasting and at 1 h in the OGTT that are significantly associated with newborn birthweight (a), cord blood C-peptide (b) and/or newborn SSF (c). The x-axis represents the standardised β of each individual metabolite. Analyses were adjusted for field centre, mean arterial pressure, maternal age, neonatal sex, sample storage time, maternal height and gestational age at delivery (model 1). Model 2 included model 1 covariates and maternal BMI; model 3 included model 1 covariates and fasting or 1 h maternal glucose for the corresponding fasting or 1 h metabolite levels. Squares, model 1; circles, model 2; diamonds, model 3. AC, acylcarnitine
Fig. 2
Fig. 2
One hour metabolites and newborn outcomes in Afro-Caribbeans. Forest plot depicting 1h maternal metabolites that are significantly associated with newborn birthweight (a) and cord blood C-peptide (b) in Afro-Caribbean participants. The x-axis represents the standardised β of each individual metabolite. Covariates for each model are as stated in the legend for Fig. 1. Squares, model 1; circles, model 2; diamonds, model 3. AC, acylcarnitine
Fig. 3
Fig. 3
Fasting metabolites and newborn outcomes in Northern Europeans. Forest plot depicting fasting maternal metabolites that are significantly associated with newborn birthweight (a) and newborn SSF (b) in Northern European participants. The x-axis represents the standardised β of each individual metabolite. Covariates for each model are as stated in the legend for Fig. 1. Squares, model 1; circles, model 2; diamonds, model 3. AC, acylcarnitine
Fig. 4
Fig. 4
Maternal fasting metabolite subnetworks associated with newborn C-peptide. Subnetwork of maternal fasting metabolites associated with newborn C-peptide in models 2 (a) and 3 (b). Covariates for each model are as stated in the legend for Fig. 1. Blue shading denotes spinglass communities within the estimated networks. The lines between two nodes (edges) represent dependence among metabolite pairs conditional on all other metabolites in the network according to graphical lasso. Solid edges represent dependencies for metabolites in the same spinglass cluster and red dashed edges represent dependencies for metabolites in different spinglass clusters. Large nodes represent metabolites that are individually significant with newborn C-peptide while small nodes are correlated with an individually significant metabolite. Nodes are coloured by metabolite class (amino acid, lipid, glycolysis/tricarboxylic acid cycle, acylcarnitine, fatty acid, miscellaneous, carbohydrate, organic acid, purine/pyrimidine). AA, amino acid; AC, acylcarnitine; Asn/Asx, asparagine/aspartic acid; CHO, carbohydrate; FA, fatty acid; GC/TCA, glycolysis/tricarboxylic acid cycle; G1P, glycerol-1-phosphate; Glu/Glx, glutamine/glutamic acid; Leu/Ile, leucine/isoleucine; Misc, miscellaneous; NM/2AA/NE, N-methylamine/2-aminobutanoic acid/N-ethylglycine; OA, organic acid; 3-OHB, 3-hydroxybutyrate; OHPro, hydroxyproline; Pur/Pyr, purine or pyrimidine
Fig. 5
Fig. 5
Maternal 1 h metabolite subnetworks associated with newborn C-peptide. Subnetwork of maternal 1 h metabolites associated with newborn C-peptide in models 2 (a) and 3 (b). Covariates for each model are as stated in the legend for Fig. 1. Blue shading denotes spinglass communities within the estimated networks. The lines between two nodes (edges) represent dependence among metabolite pairs conditional on all other metabolites in the network according to graphical lasso. Solid edges represent dependencies for metabolites in the same spinglass cluster and red dashed edges represent dependencies for metabolites in different spinglass clusters. Large nodes represent metabolites that are individually significant with newborn C-peptide while small nodes are correlated with an individually significant metabolite. Nodes are coloured by metabolite class (amino acid, lipid, glycolysis/tricarboxylic acid cycle, acylcarnitine, fatty acid, miscellaneous, carbohydrate, organic acid, purine/pyrimidine). AA, amino acid; AC, acylcarnitine; Asn/Asx, asparagine/aspartic acid; CHO, carbohydrate; FA, fatty acid; GC/TCA, glycolysis/tricarboxylic acid cycle; G1P, glycerol-1-phosphate; Glu/Glx, glutamine/glutamic acid; Leu/Ile, leucine/isoleucine; Misc, miscellaneous; NM/2AA/NE, N-methylamine/2-aminobutanoic acid/N-ethylglycine; OA, organic acid; 3-OHB, 3-hydroxybutyrate; OHPro, hydroxyproline; Pur/Pyr, purine or pyrimidine
Fig. 6
Fig. 6
Maternal fasting metabolite subnetworks associated with newborn SSF. Subnetwork of maternal fasting metabolites associated with newborn SSF in models 2 (a) and 3 (b). Covariates for each model are as stated in the legend for Fig. 1. Blue shading denotes spinglass communities within the estimated networks. The lines between two nodes (edges) represent dependence among metabolite pairs conditional on all other metabolites in the network according to graphical lasso. Solid edges represent dependencies for metabolites in the same spinglass cluster and red dashed edges represent dependencies for metabolites in different spinglass clusters. Large nodes represent metabolites that are individually significant with newborn C-peptide while small nodes are correlated with an individually significant metabolite. Nodes are coloured by metabolite class (amino acid, lipid, glycolysis/tricarboxylic acid cycle, acylcarnitine, fatty acid, miscellaneous, carbohydrate, organic acid, purine/pyrimidine). AA, amino acid; AC, acylcarnitine; Asn/Asx, asparagine/aspartic acid; CHO, carbohydrate; FA, fatty acid; GC/TCA, glycolysis/tricarboxylic acid cycle; G1P, glycerol-1-phosphate; Glu/Glx, glutamine/glutamic acid; Leu/Ile, leucine/isoleucine; Misc, miscellaneous; NM/2AA/NE, N-methylamine/2-aminobutanoic acid/N-ethylglycine; OA, organic acid;3-OHB, 3-hydroxybutyrate; OHPro, hydroxyproline; Pur/Pyr, purine or pyrimidine
Fig. 7
Fig. 7
Maternal 1 h metabolite subnetworks associated with newborn SSF. Subnetwork of maternal 1 h metabolites associated with newborn SSF in models 2 (a) and 3 (b). Covariates for each model are as stated in the legend for Fig. 1. Blue shading denotes spinglass communities within the estimated networks. The lines between two nodes (edges) represent dependence among metabolite pairs conditional on all other metabolites in the network according to graphical lasso. Solid edges represent dependencies for metabolites in the same spinglass cluster and red dashed edges represent dependencies for metabolites in different spinglass clusters. Large nodes represent metabolites that are individually significant with newborn C-peptide while small nodes are correlated with an individually significant metabolite. Nodes are coloured by metabolite class (amino acid, lipid, glycolysis/tricarboxylic acid cycle, acylcarnitine, fatty acid, miscellaneous, carbohydrate, organic acid, purine/pyrimidine). AA, amino acid; AC, acylcarnitine; Asn/Asx, asparagine/aspartic acid; CHO, carbohydrate; FA, fatty acid; GC/TCA, glycolysis/tricarboxylic acid cycle; G1P, glycerol-1-phosphate; Glu/Glx, glutamine/glutamic acid; Leu/Ile, leucine/isoleucine; Misc, miscellaneous; NM/2AA/NE, N-methylamine/2-aminobutanoic acid/N-ethylglycine; OA, organic acid; 3-OHB, 3-hydroxybutyrate; OHPro, hydroxyproline; Pur/Pyr, purine or pyrimidine

References

    1. Barker DJ, Osmond C, Simmonds SJ, Wield GA (1993) The relation of small head circumference and thinness at birth to death from cardiovascular disease in adult life. BMJ 306: 422–426 - PMC - PubMed
    1. Gluckman PD, Hanson MA, Mitchell MD (2010) Developmental origins of health and disease: reducing the burden of chronic disease in the next generation. Genome medicine 2: 14. - PMC - PubMed
    1. Catalano PM, Hauguel-De Mouzon S (2011) Is it time to revisit the Pedersen hypothesis in the face of the obesity epidemic? American journal of obstetrics and gynecology 204: 479–487 - PMC - PubMed
    1. Dabelea D, Crume T (2011) Maternal environment and the transgenerational cycle of obesity and diabetes. Diabetes 60: 1849–1855 - PMC - PubMed
    1. Mihalik SJ, Goodpaster BH, Kelley DE, et al. (2010) Increased levels of plasma acylcarnitines in obesity and type 2 diabetes and identification of a marker of glucolipotoxicity. Obesity (Silver Spring) 18: 1695–1700 - PMC - PubMed

Publication types