Review
. 2018 Dec;9(6):1035-1056.
doi: 10.1007/s13244-018-0666-6. Epub 2018 Nov 27.

Fibrous dysplasia for radiologists: beyond ground glass bone matrix

Affiliations
Review

Fibrous dysplasia for radiologists: beyond ground glass bone matrix

Yevgeniya S Kushchayeva et al. Insights Imaging. 2018 Dec.

Abstract

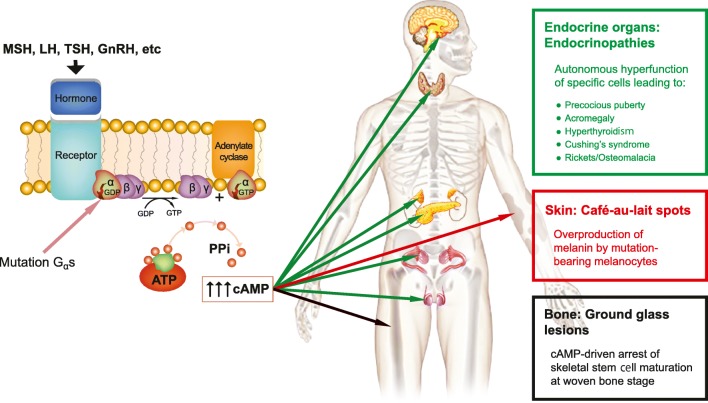
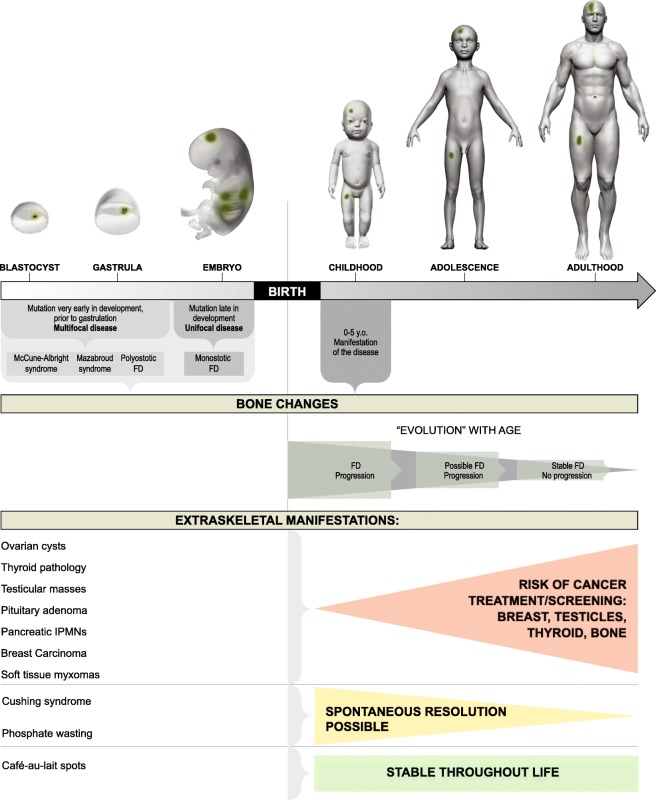
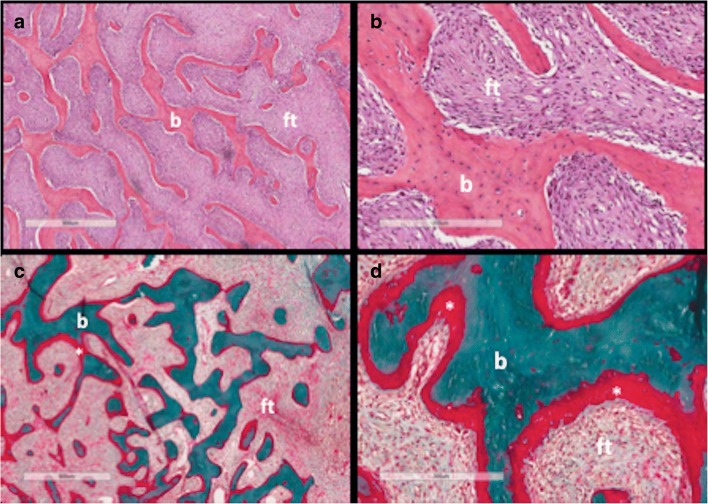
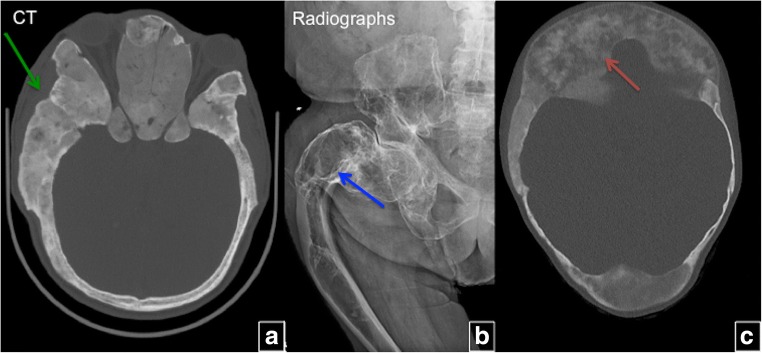
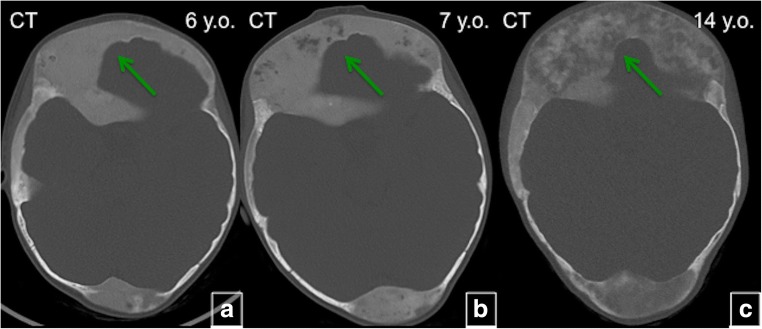
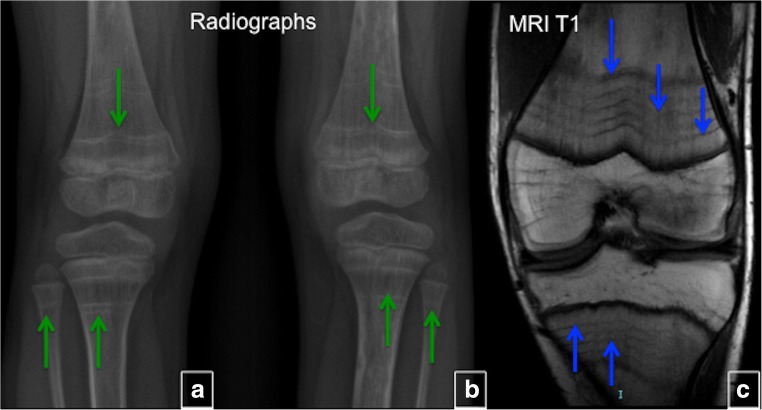
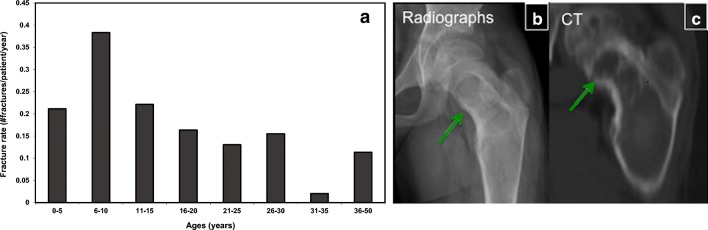
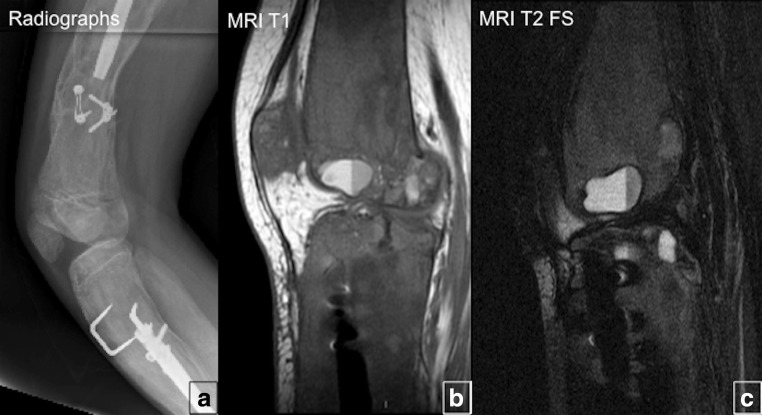
Fibrous dysplasia (FD) is a congenital disorder arising from sporadic mutation of the α-subunit of the Gs stimulatory protein. Osseous changes are characterised by the replacement and distortion of normal bone with poorly organised, structurally unsound, fibrous tissue. The disease process may be localised to a single or multiple bones. In McCune-Albright syndrome (MAS), fibrous dysplasia is associated with hyperfunction of endocrine organs and overproduction of melanin in the skin, while Mazabraud syndrome FD is associated with intramuscular myxomas. In radiology, FD is very often automatically associated with the term "ground glass matrix". However, FD is a complex disease, and knowledge of its unique pathogenesis and course are crucial to understanding imaging findings and potential complications. This article aims to not only summarise the spectrum of radiological findings of osseous and extra-osseous abnormalities associated with FD but also to highlight the pathological base of the disease evolution, corresponding imaging changes and complications based on the disease distribution. We also have provided current recommendations for clinical management and follow-up of patients with FD. TEACHING POINTS: • FD is often a part of complex disease, involving not only bone but also multiple other organs. • FD lesions are characterised by age-related histological, radiographical and clinical transformations. • Radiologists play a crucial role in the identification of osseous complications associated with FD. • The craniofacial form of the disease is the most common type of FD and the most difficult form to manage. • Patients with McCune-Albright syndrome may have different extra-skeletal abnormalities, which often require follow-up.

Keywords: Fibrous dysplasia; Ground glass bone matrix; Mazabraud’s syndrome; McCune-Albright syndrome; Skeletal radiology.


Figures

Fig. 1
Fig. 1
Post-zygotic mutations of the α-subunit of the Gs stimulatory protein (GNAS mutations) lead to the inappropriate production of the cyclic adenosine monophosphate (cAMP). In skin, the increased concentration of cAMP results in overproduction of the enzyme tyrosinase and abnormally high melanin production, incomplete differentiation of marrow stromal cells to abnormal osteoblasts with abnormal maturation of the bony matrix, and hyperfunction of the endocrine organs
Fig. 2
Fig. 2
Mutation timing determines the extent of the disease and clinical manifestations. The stage of embryogenesis during which a mutation occurs, and the locations to where mutated progenitors subsequently migrate, determines if a patient will have a single lesion, polyostotic disease or one of the FD-related syndromes. Mutations that occur at early stages of embryogenesis result in the widespread distribution of the lesions. Mutations that develop at late stages of embryogenesis lead to more focused distribution of the lesions. Patients with McCune-Albright syndrome (MAS) may have different extra-skeletal abnormalities. Some of these abnormalities may progress to malignancy; part of them become stable throughout life; some abnormalities can regress or disappear
Fig. 3
Fig. 3
Histopathological features of fibrous dysplasia (FD). FD lesions are composed of fibrous tissue interspersed between bone trabeculae. The amount of bone within lesions is quite variable. Trabeculae are dysplastic, non-stress oriented, and appear disorganised. Haematoxylin-eosin stained sections in low (a) and high power (b) show irregular, discontinuous trabeculae (b) within a fibrous stroma (ft), demonstrating the typical “alphabet soup” pattern. Goldner’s trichrome stained sections in low (c) and high power (d) reveal osteomalacic changes including excess osteoid (asterisks) and severe undermineralisation of the dysplastic bone (reprinted from Boyce [34])
Fig. 4
Fig. 4
The location-based difference in appearance of fibrous dysplasia (FD) lesions. a Craniofacial FD demonstrates dense, sclerotic lesions (green arrow). b Lesions in the long bones and axial skeleton are typically lucent. There is a typical lesion in the proximal femur with characteristic lucent ground glass appearance and shepherd’s crook deformity (blue arrow). c Mixed radiolucent/lytic FD lesions in the skull
Fig. 5
Fig. 5
The radiographic appearance of fibrous dysplasia (FD) and the rind sign. ae Frontal radiographs demonstrate classic FD lesions in appendicular skeleton. A classic lucent lesion surrounded by a layer of sclerotic reactive bone (so-called the rind sign). The rind sign is most commonly seen in the proximal femur (red arrow)
Fig. 6
Fig. 6
CT in fibrous dysplasia (FD). CT imaging is the modality of choice and superior to radiographs in delineating morphological changes in bone. Radiographs are not recommended for diagnostic purposes or for the characterisation of craniofacial lesions. a, b Radiographs of the head show evidence of FD (red arrow). c, d CT of the head on the same patient delineates lesions and demonstrates relationship between lesions and neuronal, vascular and soft tissue structures (green arrow)
Fig. 7
Fig. 7
MRI in fibrous dysplasia (FD). a, b MRI typically shows sharply demarcated lesions with intermediate to low signal intensity on T1-weighted images (WI) and intermediate to high on T2-WI (red arrow). c Some FD lesions may also contain small cystic areas, which make the T2 signal bright (green arrow). d FD lesions usually show some degree of enhancement after contrast administration (blue arrow)
Fig. 8
Fig. 8
CT and MRI in craniofacial fibrous dysplasia (FD). a CT demonstrates mixed sclerotic FD lesions involving the skull base (red arrows). b Lesions demonstrate intermediate signal intensity on T1 weighted MRI (green arrows). On T2 weighted images lesions demonstrate heterogeneous hypointense/intermediate signal intensity (blue arrows). d FD lesions show slightly heterogeneous enhancement (yellow arrows)
Fig. 9
Fig. 9
The significance of MRI with diffusion-weighted imaging (DWI) in the patient with polyostotic fibrous dysplasia (FD). CT (a), T2-weighted MRI (b) and DWI (c) show multiple rib lesions (green arrows). The left rib lesion (red arrow) demonstrates restricted diffusion, which requires further evaluation to rule out malignant transformation
Fig. 10
Fig. 10
Nuclear medicine imaging in fibrous dysplasia (FD). a Bone scans with 99m-Tc-MDP are exquisitely sensitive at detecting the presence and extend of the disease. b 18-F-NaF on the same patient with polyostotic FD demonstrates multiple areas of focal radiotracer uptake corresponding to FD lesions. c, d 18-F-NaF PET/CT shows heterogeneous uptake by the lesions in the jaw and the spine with a central photopenic area (green arrow) and a peripheral metabolically active area (red arrow)
Fig. 11
Fig. 11
Multimodality imaging in polyostotic fibrous dysplasia (FD). a, b PET/CT with 18-F-NaF demonstrates multiple lucent FD lesions seen on CT with corresponding areas of mild radiotracer uptake on PET. cf Lesions demonstrate intermediate T1 signal intensity on MRI (c), intermediate-to-low signal intensity on T2 (d), slightly hyperintense signal intensity on DWI (e), uniform enhancement after contrast administration (f)
Fig. 12
Fig. 12
“Evolution” of the fibrous dysplasia (FD) lesions. a Radiograph of a 3-year-old demonstrates a typical heterogeneous-appearing FD lesion in the femur. b Radiograph from an 11-year-old demonstrates homogeneous and radiolucent FD lesion. c Image from a 54-year-old patient shows sclerotic FD lesions
Fig. 13
Fig. 13
Age-related changes in fibrous dysplasia (FD). CT of the head on the same patient at age of 6 (a), 7 (b) and 14 years (c). Diffuse FD involvement with homogenous “ground glass” appearance (green arrows), which demonstrates the tendency to develop cystic lesions and become more heterogeneous with time (green arrows)
Fig. 14
Fig. 14
Bisphosphonate-induced lines. Administration of bisphosphonates results in the development of the parallel sclerotic metaphysial bands, which can be seen on radiographs (green arrows) and T1-weighted MRI (blue arrows)
Fig. 15
Fig. 15
Fractures in fibrous dysplasia (FD). a Fractures are more frequent in childhood, with the highest rate occurring between 6 and 10 years of age. b, c Radiograph and CT of the left femoral bone demonstrate a fracture in the medial proximal femur in the settings of FD (green arrows) (reprinted from Dumitrescu and Collins [35])
Fig. 16
Fig. 16
Benign fibrous dysplasia (FD) bone matrix transformation to aneurysmal bone cysts (ABCs). a Radiographs of the distal femur and the proximal fibula show heterogeneous FD lesions with surgical hardware. T1-weighted MRI (b) and T2 fat-suppressed images MRI (c) demonstrate ABCs
Fig. 17
Fig. 17
Benign myxoid bone matrix transformation in fibrous dysplasia (FD). a A patient with known FD of the femurs presents with an enlarging right thigh mass. b Axial unenhanced CT of the lower extremities shows a large heterogeneous mass in the right thigh replacing femur and causing mass effect on thigh muscles. Please note a normal position of the intramedullary road in the left femur. c The mass in the right thigh shows a focal 99m-Tc MDP radiotracer uptake. d Subsequently, the patient developed the same complication in the left leg. The image demonstrates extensive myxoid degeneration of the left femur
Fig. 18
Fig. 18
Malignant transformation of the fibrous dysplasia (FD) lesion. A patient with known craniofacial FD (a) presented with enlarging left jaw mass (b). CT of the facial bones demonstrated an aggressive lytic lesion with soft tissue component involving the left aspect of the mandible (red arrows) (c). The pathology showed malignant transformation of the mandibular FD lesion
Fig. 19
Fig. 19
Optic nerves in craniofacial fibrous dysplasia (FD) in two different patients. a Extensive FD involving most of the facial bones and skull. Optic canals are narrowed but patent. bd Expansile bone lesions in the left frontal bone, left sphenoid bones, ethmoid bone, and body of the sphenoid bone with marked narrowing and deformity of the left optic canal, causing left-sided blindness (red arrows). The right optic canal is narrowed (blue arrows). Vision in the right eye is preserved
Fig. 20
Fig. 20
Evaluation of hearing loss in craniofacial fibrous dysplasia (FD). a Extensive fibrous dysplasia (FD) involving petrous bones bilaterally; however, the internal auditory canals are patent (green arrows). T2 fat-saturated (b) and T1 contrast-enhanced (c) MRI demonstrate a large FD lesion centred in the left petrous temporal bone with near complete obliteration of left external auditory canal (blue arrow), which contributes to patient’s hearing loss (green arrow)
Fig. 21
Fig. 21
Brain compression in craniofacial fibrous dysplasia (FD). A patient with known right parietal bone FD (a) develops an aneurysmal bone cyst causing mass effect on adjacent brain (be)
Fig. 22
Fig. 22
Fibrous dysplasia (FD) of the spine. a Monostotic FD of the T6 vertebral body complicated by a compression fracture (green arrow). b Polyostotic FD involving the spine, ribs and skull (red arrows). c, d Postsurgical radiographs after a spinal fusion for scoliosis in the settings of polyostotic FD
Fig. 23
Fig. 23
The classification of femur deformities in fibrous dysplasia (FD). a Type 1. The neck-shaft angle is within normal limits (135°), but a distal femur shows 16° valgus deformity. b Type 2. The neck-shaft angle is valgus (152°). c Type 3. The neck-shaft angle is varus (100°). A distal shaft 10° demonstrates varus deformity. Distal juxta-articular valgus deformity is also present. d Type 4. The neck-shaft angle is normal (125°). Proximal lateral (shepherd’s crook) and distal medial bowing of the femoral shaft are present. e Type 5. The neck-shaft angle is valgus (160°). Lateral bowing of the proximal femur (shepherd’s crook) and medial bowing of the distal femur are present. f Type 6. FD affects the entire femur. Lateral bowing of the proximal femur is present at two levels (shepherd’s crook) as well as medial bowing of the distal femur. The neck-shaft angle is varus (100°) (reprinted from Ippolito et al. [21])
Fig. 24 a-d
Fig. 24 a-d
Bilateral ovarian cysts in McCune-Albright syndrome (red arrows)
Fig. 25
Fig. 25
Testicular abnormalities in McCune-Albright syndrome in three different patients. a, b Ultrasound (US) of the testicles shows extensive echogenic material secondary to Leydig cell hyperplasia. c, d The heterogeneous appearance of the testicle with more focal, well-circumscribed areas of abnormal echogenicity. These imaging findings correlate with Leydig cell hyperplasia on pathology. e, f The right testicle appears atrophic and demonstrates inhomogeneous echotexure and multiple punctate calcifications
Fig. 26
Fig. 26
Thyroid abnormalities in McCune-Albright syndrome (MAS) in three different patients. ac Ultrasound (US) of the thyroid gland shows typical microcystic changes. Macrocystic pattern (df) and solid thyroid nodules (gi) can also be seen in patients with MAS
Fig. 27
Fig. 27
Pituitary adenoma in craniofacial fibrous dysplasia (FD). a, b A patient with craniofacial FD (blue arrows) with pituitary macroadenoma (red arrows) on CT (a) and T1 contrast-enhanced MRI (b)
Fig. 28
Fig. 28
Intraductal papillary mucinous neoplasms (IPMNs) of the pancreas in McCune-Albright syndrome (blue arrows). T2-weighted MRI (a), T1 contrast-enhanced MRI (b). Coronal maximum intensity projection from a 3D T2-weighted MRCP acquisition shows IPMNs (c). Please note, a fibrous dysplasia lesion in the left rib (green arrows)
Fig. 29
Fig. 29
ad Intramuscular myxomas in Mazabraud syndrome. Sagittal and axial T2-weighted fat-saturated magnetic resonance images demonstrate several high-signal-intensity lesions (green arrows). Some of the lesions show peripheral oedema (blue arrows)
Fig. 30
Fig. 30
An algorithm of the management of fibrous dysplasia

Similar articles

Cited by

References

    1. Kozlowski K, Beighton P. Gamut index of skeletal dysplasias: an aid to radiodiagnosis. London: Springer; 2012.
    1. Weinstein LS, Shenker A, Gejman PV, Merino MJ, Friedman E, Spiegel AM. Activating mutations of the stimulatory G protein in the McCune-Albright syndrome. N Engl J Med. 1991;325(24):1688–1695. doi: 10.1056/NEJM199112123252403. - DOI - PubMed
    1. Robinson C, Collins MT, Boyce AM. Fibrous dysplasia/McCune-Albright syndrome: clinical and translational perspectives. Curr Osteoporos Rep. 2016;14:178–186. doi: 10.1007/s11914-016-0317-0. - DOI - PMC - PubMed
    1. Lee JS, FitzGibbon EJ, Chen YR, et al. Clinical guidelines for the management of craniofacial fibrous dysplasia. Orphanet J Rare Dis. 2012;7(Suppl 1):S2. doi: 10.1186/1750-1172-7-S1-S2. - DOI - PMC - PubMed
    1. Kuznetsov SA, Cherman N, Riminucci M, Collins MT, Robey PG, Bianco P. Age-dependent demise of GNAS-mutated skeletal stem cells and “normalization” of fibrous dysplasia of bone. J Bone Miner Res. 2008;23:1731–1740. doi: 10.1359/jbmr.080609. - DOI - PMC - PubMed

LinkOut - more resources