Review
. 2018:1104:119-147.
doi: 10.1007/978-981-13-2158-0_7.

Biophysical Analyses for Probing Glycan-Protein Interactions

Affiliations
Review

Biophysical Analyses for Probing Glycan-Protein Interactions

Masamichi Nagae et al. Adv Exp Med Biol. 2018.

Abstract

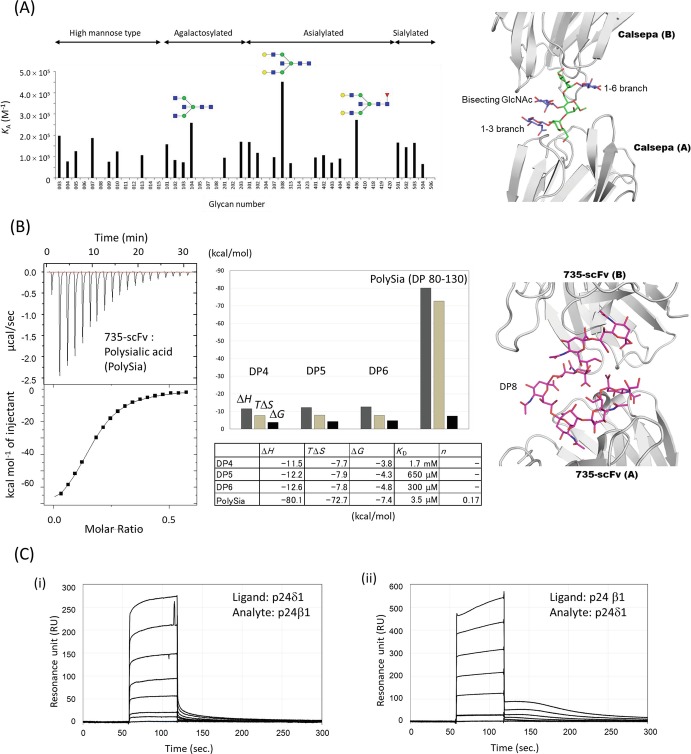
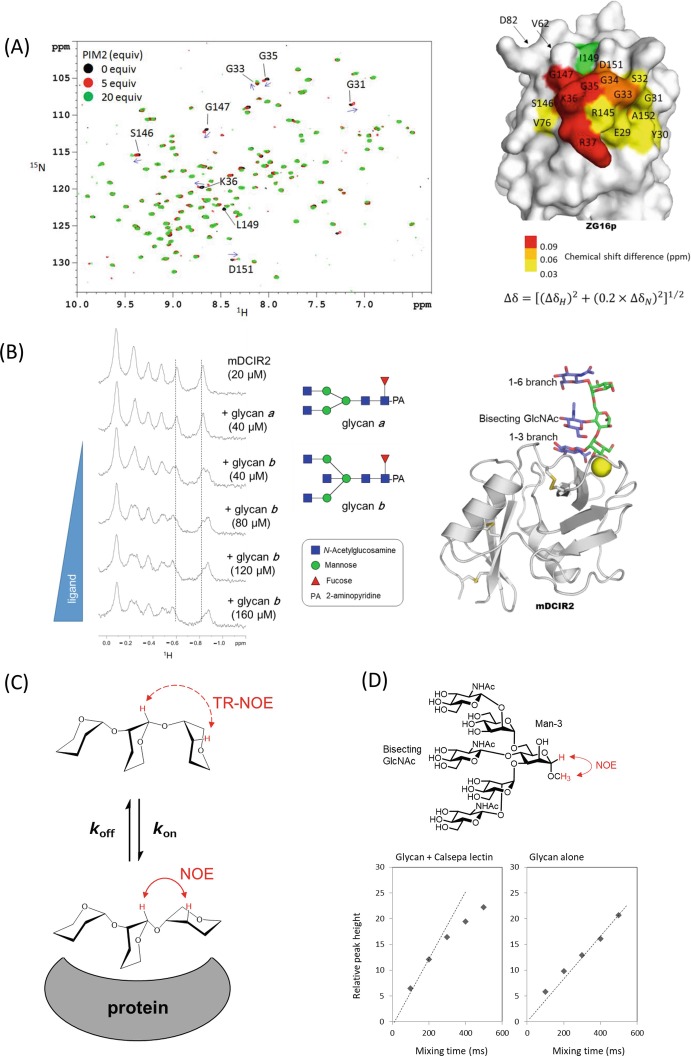
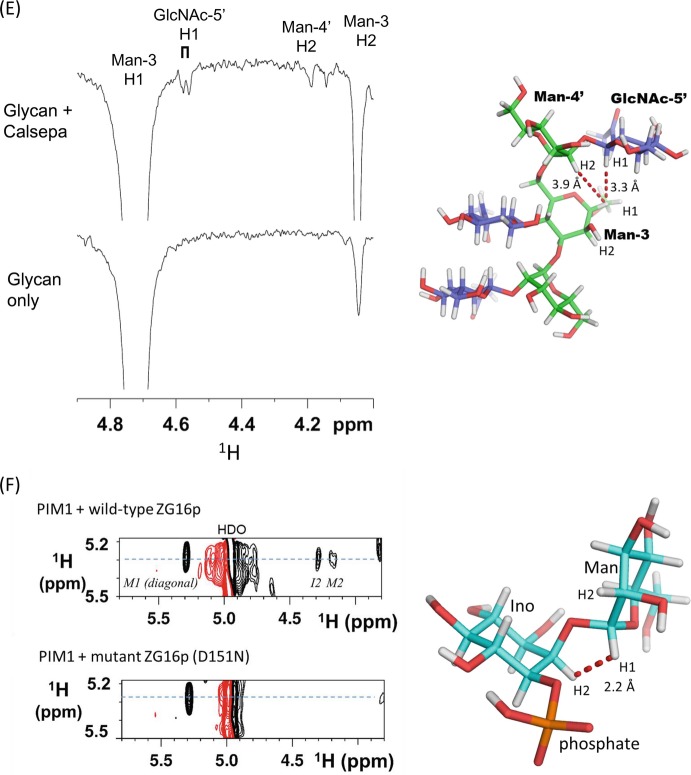
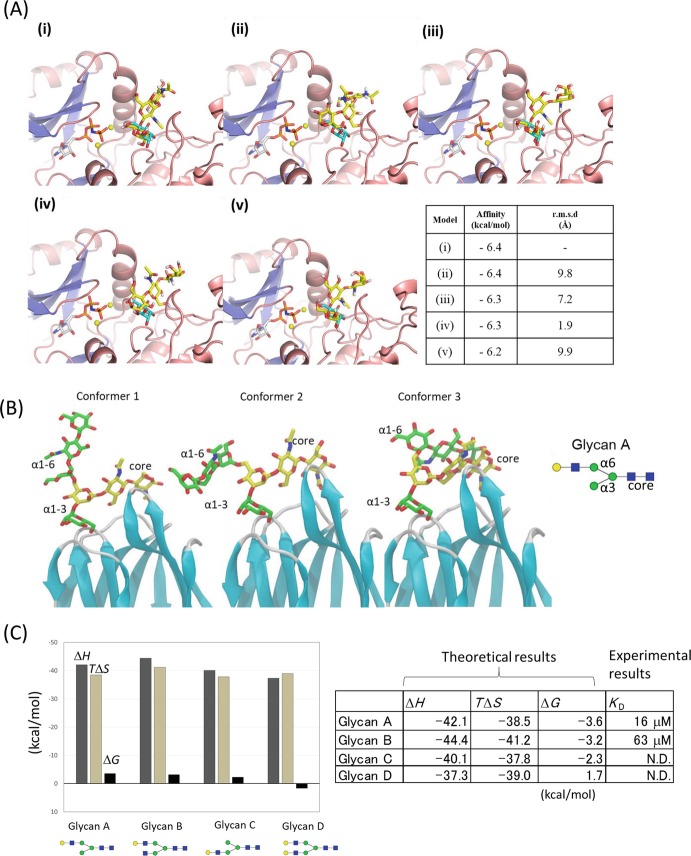
Glycan-protein interactions occur at many physiological events, and the analyses are of considerable importance for understanding glycan-dependent mechanisms. Biophysical approaches including 3D structural analysis are essential for revealing glycan-protein interactions at the atomic level. The inherent diversity of glycans suits them to function as identification tags, e.g., distinguish self from the nonself components of pathogens. However, the complexity of glycans and poor affinities for interaction partners limit the usefulness of conventional analyses. To cope with such troublesome glycans, a logical sequence of biophysical analyses need to be developed. In this chapter, we introduce a workflow of glycan-protein interaction analysis consisting of six steps: preparation of lectin and glycan, screening of glycan ligand, determination of binding epitope, quantitative interaction analysis, 3D structural analysis, and molecular dynamics simulation. Our increasing knowledge and understanding of lectin-glycan interactions will hopefully lead to the design of glyco-based medicines and vaccines.

Keywords: Frontal affinity chromatography; Glycan microarray; Isothermal titration calorimetry; Molecular dynamics simulation; Nuclear magnetic resonance; Surface plasmon resonance; X-ray crystallography.


Figures

Fig. 7.1
Fig. 7.1
Large-scale preparation of recombinant proteins (a) A flowchart of large-scale preparation of lectins for 3D structure and interaction studies (b) Small-scale expression of differently fused MLS128-scFv in BL21 CodonPlus (left) and Origami B (right) strains analyzed by SDS-PAGE. M: Molecular weight of marker proteins; Lanes 1–8, odd number lanes are composition of total cell lysates, and even number lanes are composition of soluble cell lysates. Lanes 1 and 2 for scFv without fusion tag, Lanes 3 and 4 for thioredoxin (Trx)-fused scFv, Lanes 5 and 6 for DsbC-fused scFv, and Lanes 7 and 8 for PDI-fused scFv. The figure was adapted from a previous paper (Subedi et al. 2012) with permission (c) Comparison of expression yield of Dectin-1 with and without GB1 fusion tag before and after concentration (to 1 mL) of purified sample. Results are presented as mean ± SD (n = 3) for pET28a murine Dectin-1, pCold murine Dectin-1, pCold-human Dectin-1 (codon-optimized), pCold murine Dectin-1 (optimized), and pCold GB1-fused murine Dectin-1 (codon-optimized). The figure was adapted from the paper (Dulal et al. 2016) with permission
Fig. 7.2
Fig. 7.2
Glycan microarray analysis for the lectin specificity (a) Non-covalent and covalent glycan immobilization for glycan microarray analysis (b) On-array inhibition assays for analyzing the binding of GST-fused human ZG16p to selected ligands which are non-covalently immobilized on the plate as neoglycolipids. Man-α-OMe, Gal-β-OMe (upper panel), oligosaccharide fractions (>20-mer) of heparin (Hep), and hyaluronic acid (HA) (lower panel) were used as inhibitors. This figure was adapted from a previous paper (Kanagawa et al. 2014) with permission
Fig. 7.3
Fig. 7.3
Saturation transfer difference NMR (STD-NMR) analysis for group epitope mapping (a) Basic principle of saturation transfer difference NMR (STD-NMR). The ligand protons which receive saturation from the protein are highlighted in red. From the degree of ligand saturation, one can map the group epitope which is recognized by the protein (b) STD-NMR spectra of (Neu5Ac)6 with an anti-polysialic acid antibody 12E3 at 10 °C (ii), 20 °C (iii), and 30 °C (iv) with the control 1H-NMR spectrum (off-resonance) at 10 °C (i). STD-NMR spectra were collected by irradiating iteratively at 7 ppm (on resonance)/ 40 ppm (off resonance). x; the signals from low-molecular-weight impurities, which are nearly null in STD-NMR spectra. This figure was adapted from a previous paper (Hanashima et al. 2013) with permission (c) STD-NMR spectrum (lower) and reference 1H-NMR spectrum (upper) of the di-galactosylated biantennary glycan bearing bisecting GlcNAc and core fucose (top panel) in the presence of PHA-E (glycan: subunit molar ratio is 1:2). Normalized amplification factor (GlcNAc-2 signal is set to 100%) is shown in parenthesis. The signal indicated with an asterisk originates from PHA-E protein. This figure was adapted from a previous paper (Nagae et al. 2014c) with permission. Crystal structure of PHA-E in complex with bisected N-glycan (PDB code: 5AVA) is shown in right panel
Fig. 7.4
Fig. 7.4
Hydrogen exchange analysis using deuterium-induced isotope shift (a) Deuterium-induced 13C isotope shifts for analyzing the proton exchange rate of sugar hydroxyl groups. k ex, exchange rates of hydroxyl protons with water. The chemical shift difference (isotope shift) is ~0.15 ppm, which is not dependent on the magnetic field (b) 13C-NMR spectra of 40 mM LewisX tetrasaccharide with expanded secondary carbon area. LewisX at 5 °C (top), and LewisX with 1.0 M calcium chloride at 5 °C (bottom). The sample was dissolved in 10 mM sodium acetate buffer (pH 6.0) composed of H2O:D2O = 1:1 (c) 13C-NMR spectra of short β1–3-glucans DP7 (red) and laminarin (black) at 5, 10, 15, 20, and 25 °C. 13C-NMR signal focuses on the C4 position. All ligands were dissolved in the same buffer shown in (B). The figures were adapted from previous papers (Hanashima et al. 2011, 2014a) with modifications
Fig. 7.5
Fig. 7.5
Quantitative analyses of lectin-glycan interaction (a) FAC analysis of a mannose-binding Jacalin-related lectin Calsepa toward N-glycans. Association constant (K A) of Calsepa lectin for each glycan is shown. Monosaccharide symbols follow the SNFG (symbol nomenclature for glycans) system (Varki et al. 2015). The FAC data is adapted from a paper (Nagae et al. 2017a) with permission. Crystal structure of Calsepa in complex with bisected glycan (corresponding to #104) is shown in right panel (PDB code: 5AV7) (b) Isothermal titration calorimetry (ITC) analysis of scFv735 using polysialic acid (PolySia, DP 80–130) (left). Bar graph and table of thermodynamic parameters for DP4, DP5, DP6, and PolySia are shown in middle panel. Crystal structure of scFv735 in complex with octa- sialic acid (DP8) is shown in the right panel (PDB code: 3WBD) (c) Surface plasmon resonance (SPR) analyses of the protein-protein interaction between p24β1 and p24δ1 GOLD domains. (i) Sensorgram showing the interaction between immobilized p24δ1 GOLD domain and analyte p24β1 GOLD domain. p24β1 GOLD domain aliquots (0, 5, 25, 50, 100, 200, and 400 μM) were injected for 60 s at a flow rate of 30 μl/min. Subtracted sensorgrams with blank lanes are shown. (ii) Sensorgram showing the interaction between immobilized p24β1 GOLD domain and analyte p24δ1 GOLD domain. The dilution series of p24δ1 GOLD domain are the same as those of p24β1 GOLD domain shown in (i). The SPR data was adapted from a paper (Nagae et al. 2016a) with permission
Fig. 7.6
Fig. 7.6
NMR titration studies and trNOE-based conformational analyses (a) NMR titration study of the interaction between ZG16p and PIM2. (Left panel) 1H-15N HSQC spectra of uniformly 15N-labeled ZG16p in titration with PIM2 glycan (Black, 0 equiv.; red, 5 equiv.; and green, 20 equiv. of PIM2). Blue arrows indicate directions of the chemical shift changes. The figure was adapted from a paper (Hanashima et al. 2015) with permission.Fig. 7.6 (continued) (Right panel) Mapping surface residues in the PIM2 glycan interaction on the crystal structure of human ZG16p (PDB ID; 3APA). The signal from I149 (green) was broadened upon PIM2 binding (b) NMR titration study of the interaction between a C-type lectin receptor mDCIR2 CRD and glycans. The pyridylaminated bisected and non-bisected N-glycans (glycans a and b) used in this study are shown in middle panel. A part of 1H-NMR spectra of 20 μM mDCIR2 CRD in the absence of glycan (top), in the presence of 40 μM glycan a (second), and 40–120 μM glycan b (third to the last). The figure was adapted and modified from a previous paper (Nagae et al. 2013b) with permission. Crystal structure of mDCIR2 CRD in complex with bisected glycan corresponding to glycan b is shown in right panel (PDB code: 3VYK) (c) Basic principle of transferred NOE (trNOE). If the glycan ligand is bound to protein for a sufficiently short time (in fast exchange), one can observed the bound NOEs (reflecting the interproton distances in the bound state) by using the free ligand signals (d) NOE build up curves of Man-3 H1 and Man-3 O-methyl proton signals in the presence (left) and absence (right) of Calsepa lectin. Man-3 H1 signal was selectively inverted using a 180° rectangular pulse with 40-ms duration. This figure was adapted from a paper (Nagae et al. 2016c) with permission (e) 1D selective NOESY spectra of bisected glycan in the presence (upper) and absence (lower) of Calsepa. Strong intra-residue trNOE was observed from Man-3 H1 to Man-3 H2, and long-range Fig. 7.6 (continued) trNOEs were also observed from Man-3 H1 to GlcNAc-5′ (α1–6 branch) H1 and to Man-4’ H2 signals (Right panel). Proton-proton distances were indicated between Man-3 H1 and GlcNAc-5’ H1 and between Man-3 H1 and Man-4’ H2. Structures of back-fold conformations are derived from Calsepa complex (PDB code: 5AV7). Hydrogen atoms are generated with PyMOL. This figure was adapted and modified from a paper (Nagae et al. 2016c) with permission (f) 2D 1H-1H NOESY spectrum of PIM1 glycan (4.6-fold excess) in the presence of wild-type ZG16p collected with a mixing time of 250 ms at 10 °C (upper panel). Key inter-residual correlation was provided between Man-H1 and Ino-H2 and intra-residual correlations (Man-H1 and Man-H2) as negative NOEs. The atomic distance of inter-residue Man-H1-Ino-H2 was determined as 2.2 Å from the relative intensity of the signal. No correlation was observed when using the inactive ZG16p mutant (D151N) (lower panel). This figure is reproduced from the paper (Hanashima et al. 2015) with permission
Fig. 7.6
Fig. 7.6
NMR titration studies and trNOE-based conformational analyses (a) NMR titration study of the interaction between ZG16p and PIM2. (Left panel) 1H-15N HSQC spectra of uniformly 15N-labeled ZG16p in titration with PIM2 glycan (Black, 0 equiv.; red, 5 equiv.; and green, 20 equiv. of PIM2). Blue arrows indicate directions of the chemical shift changes. The figure was adapted from a paper (Hanashima et al. 2015) with permission.Fig. 7.6 (continued) (Right panel) Mapping surface residues in the PIM2 glycan interaction on the crystal structure of human ZG16p (PDB ID; 3APA). The signal from I149 (green) was broadened upon PIM2 binding (b) NMR titration study of the interaction between a C-type lectin receptor mDCIR2 CRD and glycans. The pyridylaminated bisected and non-bisected N-glycans (glycans a and b) used in this study are shown in middle panel. A part of 1H-NMR spectra of 20 μM mDCIR2 CRD in the absence of glycan (top), in the presence of 40 μM glycan a (second), and 40–120 μM glycan b (third to the last). The figure was adapted and modified from a previous paper (Nagae et al. 2013b) with permission. Crystal structure of mDCIR2 CRD in complex with bisected glycan corresponding to glycan b is shown in right panel (PDB code: 3VYK) (c) Basic principle of transferred NOE (trNOE). If the glycan ligand is bound to protein for a sufficiently short time (in fast exchange), one can observed the bound NOEs (reflecting the interproton distances in the bound state) by using the free ligand signals (d) NOE build up curves of Man-3 H1 and Man-3 O-methyl proton signals in the presence (left) and absence (right) of Calsepa lectin. Man-3 H1 signal was selectively inverted using a 180° rectangular pulse with 40-ms duration. This figure was adapted from a paper (Nagae et al. 2016c) with permission (e) 1D selective NOESY spectra of bisected glycan in the presence (upper) and absence (lower) of Calsepa. Strong intra-residue trNOE was observed from Man-3 H1 to Man-3 H2, and long-range Fig. 7.6 (continued) trNOEs were also observed from Man-3 H1 to GlcNAc-5′ (α1–6 branch) H1 and to Man-4’ H2 signals (Right panel). Proton-proton distances were indicated between Man-3 H1 and GlcNAc-5’ H1 and between Man-3 H1 and Man-4’ H2. Structures of back-fold conformations are derived from Calsepa complex (PDB code: 5AV7). Hydrogen atoms are generated with PyMOL. This figure was adapted and modified from a paper (Nagae et al. 2016c) with permission (f) 2D 1H-1H NOESY spectrum of PIM1 glycan (4.6-fold excess) in the presence of wild-type ZG16p collected with a mixing time of 250 ms at 10 °C (upper panel). Key inter-residual correlation was provided between Man-H1 and Ino-H2 and intra-residual correlations (Man-H1 and Man-H2) as negative NOEs. The atomic distance of inter-residue Man-H1-Ino-H2 was determined as 2.2 Å from the relative intensity of the signal. No correlation was observed when using the inactive ZG16p mutant (D151N) (lower panel). This figure is reproduced from the paper (Hanashima et al. 2015) with permission
Fig. 7.7
Fig. 7.7
Molecular dynamics simulations of protein-glycan complexes (a) Top five docking poses of the core M3 trisaccharide ( GalNAcβ1–3GlcNAcβ1-4Man, shown in yellow) in POMK binding site (i-v) by AutoDock Vina. The mannose residue assigned in the crystal structure (PDB code: 5GZ9) is overlaid in cyan. The table contains docking results for each model (i)-(v). Calculated binding affinity (in kcal/mol) together with root mean square deviation (r.m.s.d. in Å) from top scoring docking pose (i) is shown for all five models. This figure is adapted from the paper (Nagae et al. 2017b) with permission (b) Three major conformations (Conformers 1, 2, and 3) of the α1–6 branch of glycan A bound to Orysata lectin in MD simulations. The simulation was performed using the crystal structure of Orysata in complex with glycan A (PDB code: 5XFH). This figure is adapted from the paper (Nagae et al. 2017a) with permission (c) Bar graph and table of calculated average enthalpy (∆H), entropy (TS), and total binding free energy (∆G) for the biantennary glycans A–D. Experimental dissociation constant (K D = 1/K A) determined by FAC analysis is also indicated. N.D.: K D was not determined due to weak or no binding
Fig. 7.8
Fig. 7.8
Electron microscopic images of carbohydrates covalently attached onto proteins (a) N-glycan core attached onto N55 of human nicastrin, a component of γ-secretase complex ((Bai et al. 2015), PDB code: 5A63, EMDB: 3061). The density map is depicted at 5.0 σ level cutoff. Schematic representation of the observed glycan is shown in right panel (b) High-mannose-type N-glycan attached onto N426 of human coronavirus NL63 (HCoV-NL63) ((Walls et al. 2016), PDB code, 5SZS; EMDB, 8331). The density map is contoured at 7.0 σ level (c) Tetra-antennary glycan attached onto N637 of HIV-1 Env trimer ((Lee et al. 2016), PDB code, 5FUU; EMDB, 3308). The density map is depicted in cyan mesh contoured at 5.5 σ level

Similar articles

Cited by

References

    1. Angulo J, Nieto PM. STD-NMR: application to transient interactions between biomolecules-a quantitative approach. Eur Biophys J. 2011;40(12):1357–1369. doi: 10.1007/s00249-011-0749-5. - DOI - PubMed
    1. Angulo J, Díaz I, Reina JJ, Tabarani G, Fieschi F, Rojo J, Nieto PM. Saturation transfer difference (STD) NMR spectroscopy characterization of dual binding mode of a mannose disaccharide to DC-SIGN. Chembiochem. 2008;9(14):2225–2227. doi: 10.1002/cbic.200800361. - DOI - PubMed
    1. Angulo J, Enríquez-Navas PM, Nieto PM. Ligand-receptor binding affinities from saturation transfer difference (STD) NMR spectroscopy: the binding isotherm of STD initial growth rates. Chemistry (Weinheim an der Bergstrasse, Germany) 2010;16(26):7803–7812. doi: 10.1002/chem.200903528. - DOI - PubMed
    1. Bai XC, Yan C, Yang G, Lu P, Ma D, Sun L, Zhou R, Scheres SHW, Shi Y. An atomic structure of human γ-secretase. Nature. 2015;525(7568):212–217. doi: 10.1038/nature14892. - DOI - PMC - PubMed
    1. Battistel MD, Azurmendi HF, Freedberg DI. Glycan OH exchange rate determination in aqueous solution: Seeking evidence for transient hydrogen bonds. J Phys Chem B. 2017;121(4):683–695. doi: 10.1021/acs.jpcb.6b10594. - DOI - PubMed

LinkOut - more resources