Review
. 2019;26(1):44-54.
doi: 10.2174/0929866526666181128142401.

Using X-ray Footprinting and Mass Spectrometry to Study the Structure and Function of Membrane Proteins

Affiliations
Review

Using X-ray Footprinting and Mass Spectrometry to Study the Structure and Function of Membrane Proteins

Sayan Gupta. Protein Pept Lett. 2019.

Abstract

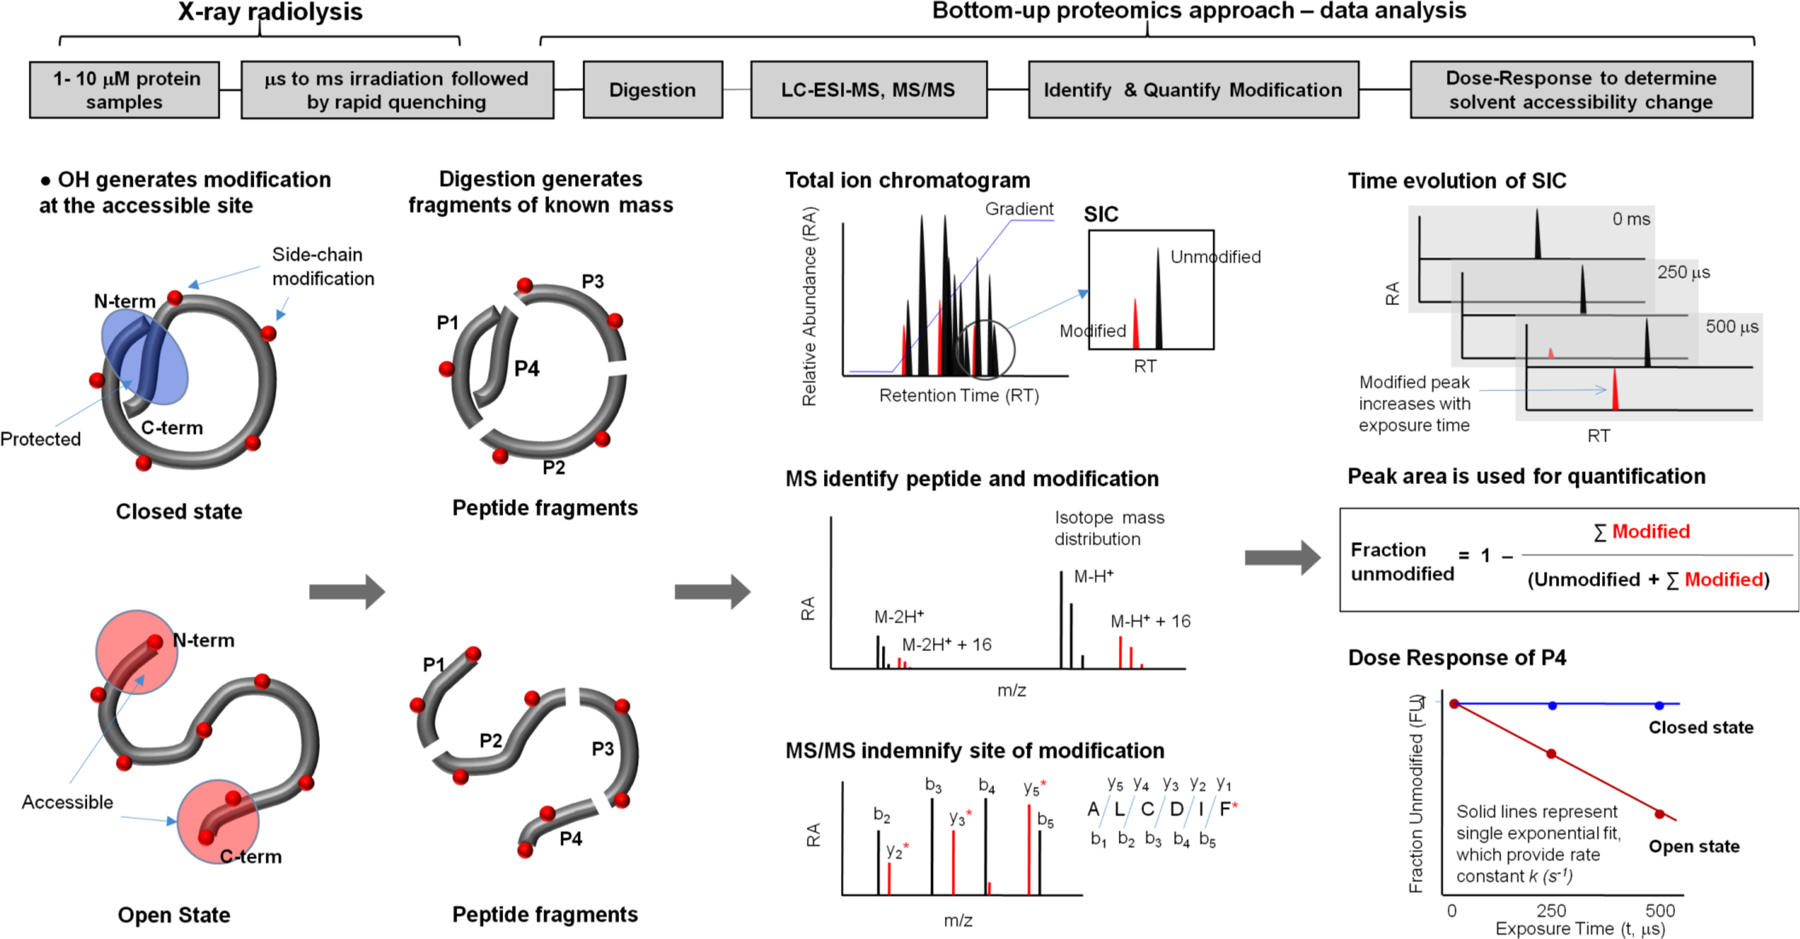
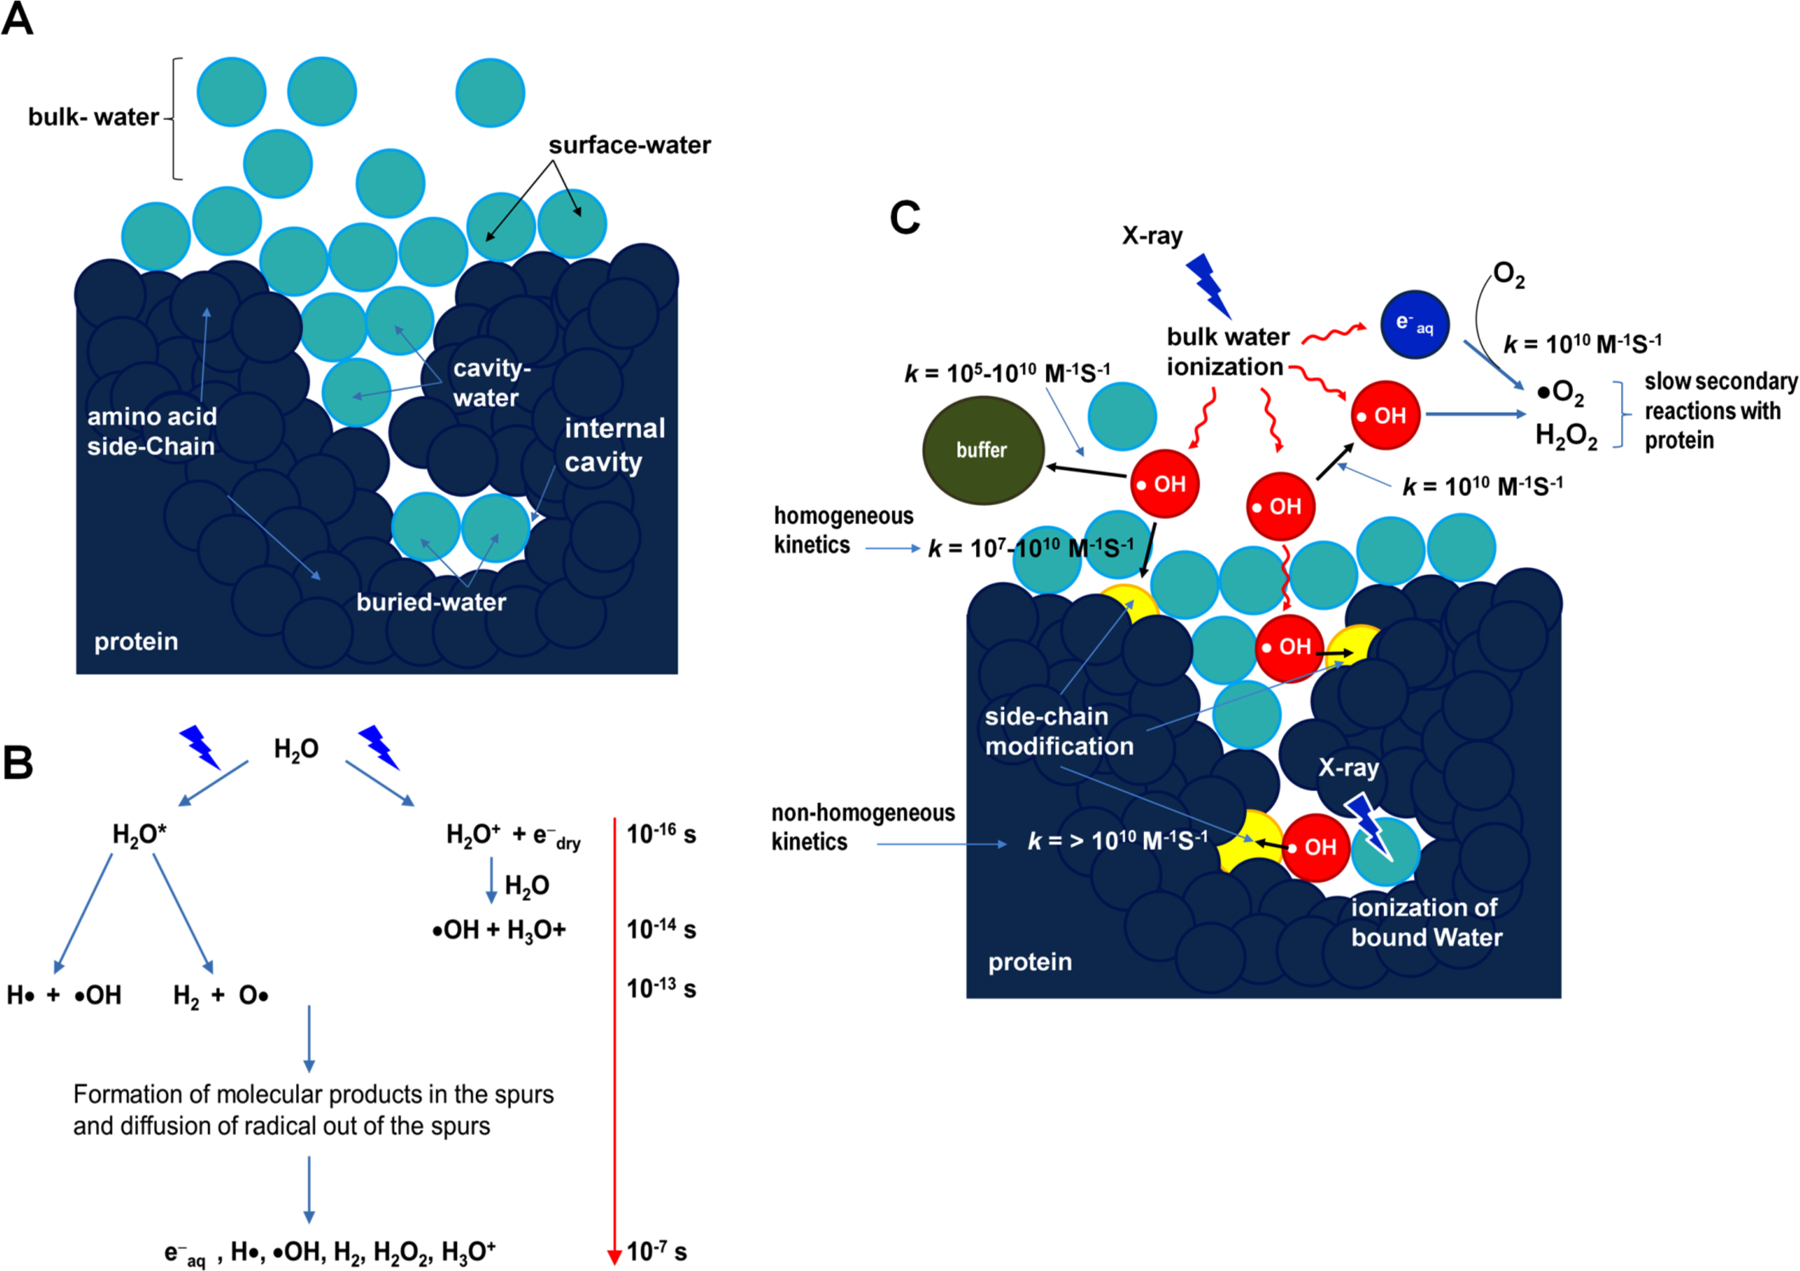
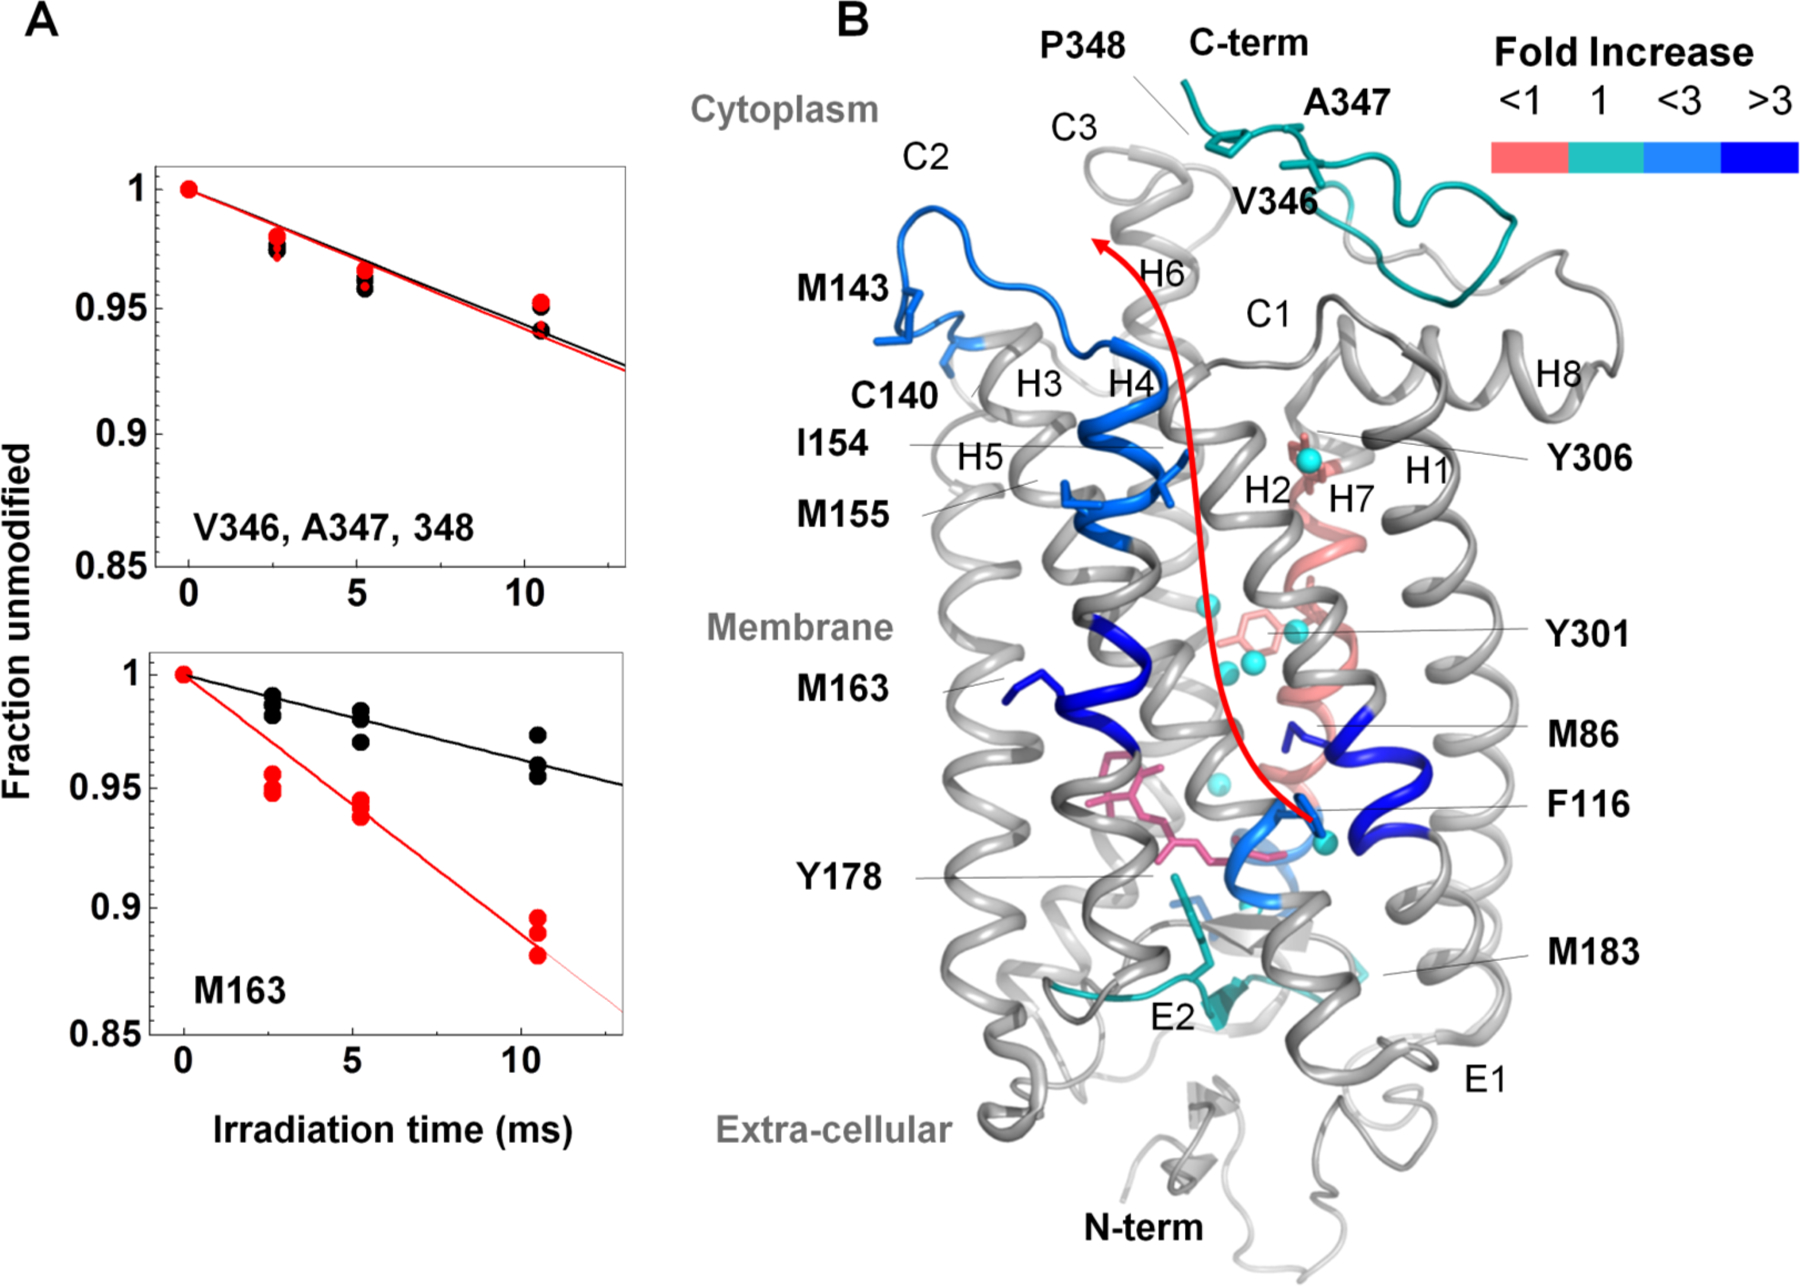
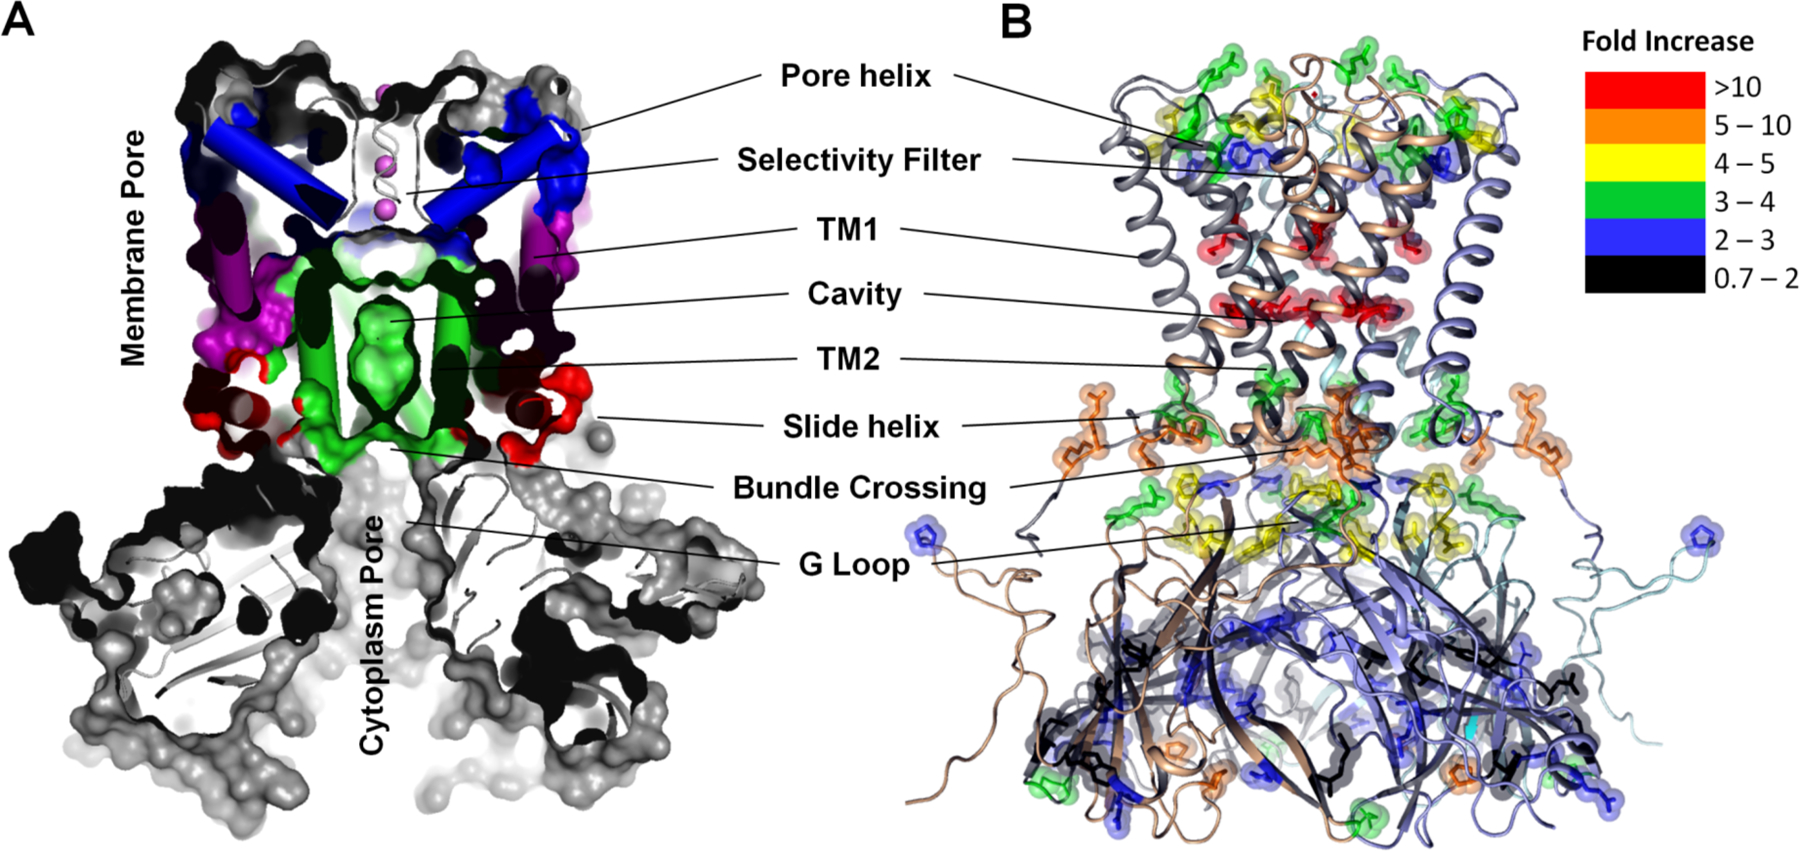
Background: Membrane proteins are crucial for cellular sensory cascades and metabolite transport, and hence are key pharmacological targets. Structural studies by traditional highresolution techniques are limited by the requirements for high purity and stability when handled in high concentration and nonnative buffers. Hence, there is a growing requirement for the use of alternate methods in a complementary but orthogonal approach to study the dynamic and functional aspects of membrane proteins in physiologically relevant conditions. In recent years, significant progress has been made in the field of X-ray radiolytic labeling in combination with mass spectroscopy, commonly known as X-ray Footprinting and Mass Spectrometry (XFMS), which provide residue-specific information on the solvent accessibility of proteins. In combination with both lowresolution biophysical methods and high-resolution structural data, XFMS is capable of providing valuable insights into structure and dynamics of membrane proteins, which have been difficult to obtain by standalone high-resolution structural techniques. The XFMS method has also demonstrated a unique capability for identification of structural waters and their dynamics in protein cavities at both a high degree of spatial and temporal resolution, and thus capable of identifying conformational hot-spots in transmembrane proteins.

Conclusion: We provide a perspective on the place of XFMS amongst other structural biology methods and showcase some of the latest developments in its usage for studying conformational changes in membrane proteins.

Keywords: Hydroxyl-radical footprinting; ion channels; mass spectrometry; oxidative labeling; radiolysis; transporters..


Figures

Figure 1.
Figure 1.. Schematic of the X-ray footprinting method using synchrotron X-ray radiolysis and mass spectrometry.
The top panel shows the overall method, and the bottom panel illustrates a case study for a protein that undergoes a conformational change from the closed to the open state. The protein is covalently modified after a series of X-ray irradiations on the order of microseconds followed by rapid quenching by methionine amide. Irradiated protein is digested with proteases to generate peptide fragments of known mass. Digested protein is analyzed by reverse phase Liquid Chromatography coupled with Electrospray Ionization Mass Spectrometry (LC-ESI-MS), in which peptides are separated in the Total Ion Chromatogram (TIC) or mass chromatogram. For any peptide fragment the unmodified and modified m/z is extracted and visualized by Selected Ion Chromatogram (SIC). High resolution mass spectrometry is used to identify the unmodified and modified peptide fragments by their accurate m/z and isotope mass distribution. The site of modification is identified from the mass assignment of the y and b fragment ions from the tandem mass spectrometry (MS/MS) of the corresponding peptide. The extent of modification for the series of irradiation points are quantified for the SICs of unmodified and modified peptide fragments. The fraction of unmodified peptide vs. exposure time (dose-response or DR-plot) provides site-specific modification rate constants (k s−1). The rates are compared among different sample conditions, and their ratios, which are independent of intrinsic reactivity, account for the degree in solvent accessibility changes due to any conformational transition/interactions. The final results are mapped onto available structures or used as constraints for structural modeling. Reproduced in part with the permission from Gupta et al. J Sync. Rad. .
Figure 2.
Figure 2.. Major reactions scenarios for X-ray radiolysis in dilute protein samples.
(A) Schematic showing the position of bulk- , surface- , and bound-water (cavity- and buried-water) (light blue) in a protein molecule (dark blue). (B) Radiolysis of water and the timescale of sequence of events reproduced from Gupta et al. J. Sync. Rad. 2014 and Liljenzin, J., Radiation Effects on Matter, in Radiochemistry and Nuclear Chemistry, 2002, Butterworth-Heinemann. (C) The location of hydroxyl radical (red) generated in situ from ionization or activation of water by X-ray irradiation. The •OH radicals react with nearby side chains in close proximity and yield covalent modifications on the protein side chains (yellow). Radiolysis of bulk water starts with the ionization of water on the time scale of 10−16 s . The key product, •OH, diffuses (10−7 s) out in the bulk (red arrows) and undergoes reactions with other •OH, buffer molecules, and protein side chains (bimolecular reactions are indicated by black arrows, and approximate values of the rate constants for different reactions are shown). The rapid counterproductive reactions, such as •OH - •OH recombination, as well as various other reactions scavenge •OH and reduce the concentration of •OH in the bulk. Thus, a sufficient X-ray dose or high flux density beam is needed to maintain a steady concentration of •OH that will lead to a detectable yield of side chain modification on the protein in solution. In contrast, •OH radicals formed from activation of a bound water can react faster with side chains in proximity because of the translational and rotational ordering of water and because fewer scavenging reactions by other •OH or highly reactive buffer constituents are available. Radiolysis of water also produces electrons, which rapidly become solvated and react with O2 to produce superoxide radicals. In general, the reactivity of side-chains to solvated electrons is lower than to hydroxyl radicals (Xu & Chance 2007). Peroxides and superoxides undergo slow reactions with protein side chains and are quenched as described in sections 1.1 and 1.3. Solvated electrons consume O2, which is also required for side chain labeling by •OH radicals; thus short irradiation time as well as high flux density are the key factors for success of the XF-MS experiment. Reproduced in part with the permission from Gupta et al. J. Sync. Rad. and Gupta et al. J Sync. Rad. .
Figure 3.
Figure 3.. XF-MS probes bound water mediated signal transfer pathway in bovine rhodopsin.
(A) DR plots of dark (black) vs. meta II (red) for the peptide p333–348 (at the solvent exposed cytoplasmic side) and p160–164 (at the TM region) for modified residues indicated. (B) Pictorial summary of relative solvent accessibility changes for the photoactivation of dark to meta II state. Residues with rate constants > 0.1 s−1 are shown as sticks. The color coding represents the ratio of rate constants between meta-II and rhodopsin. Conserved transmembrane waters are shown as cyan spheres. The changes in rates of modification reflect local structural changes inside the TM domain upon formation of meta II. The results demonstrate disruption and reorganization of multiple close-packing interactions, mediated by both side chains and bound waters. The information is transmitted from the chromophore (ligand-binding site) to the cytoplasmic surface for G-protein activation. Results from Angel et al. PNAS 2009 and reproduced from Gupta et al. J. Sync. Rad. .
Figure 4.
Figure 4.. XF-MS identifies conformation changes during gating of a K+ ion channel, KirBac3.1.
(A) Cross sectional view showing multiple surface exposed and buried cavities in close KirBac3.1 (PDB-1XL4). The TM1 (purple) and TM2 (green) denote transmembrane helix-1 (Outer), and transmembrane helix-2 (Inner) respectively. Pore helix and side helix are colored as blue and red respectively. (B) Solvent accessibility changes from the closed to the open conformation in KirBac3.1 are visualized on the structure of closed KirBac3.1, where the subunits are represented by different colors. The modified residues are shown by sticks. Color coding indicates the changes in the modification rates or solvent accessibilities upon transition from the closed to the open state. Residues that undergo increased interactions with water due to changes in the structure of the channel in the open state show dramatic increase in labeling efficiency. The results support the proposed existence of three potential gates within the channel. Results from Gupta et al. Structure. 2010 and reproduced in part with the permission from Gupta et al. J Sync. Rad. .
Figure 5.
Figure 5.. XF-MS probes proton-coupled Zn2+ transfer mechanism in Zn transporter YiiP.
(A) Bar plot showing radiometric water accessibility changes in response to Zn2+ binding measured by ratio (R) of •OH labeling rates for residues with increase (blue), decrease (red) and no change (grey) in accessibility after rapid Zn2+ exposure. (B) Time courses of water accessibility changes for the indicated residues. Solid lines represent single exponential fits, which provide rate constants of conformational changes associated with Zn2+ binding and translocation. (C) X-ray footprinting reveals a hydrophobic gate at residue L152, which controls the opening of the inner cavity water pathway for zinc-proton exchange in the YiiP transporter. The cross-sectional view shows the position of TM helices, which separate two cavities at the intra-cellular (IC) and extra-cellular (EC) sides. Residues are color coded as in (A). XF-MS results suggest the protein conformational change alternates the membrane-facing on–off mode of zinc coordination (in D49) and protonation–deprotonation (H153) of the transport site in a coordinated fashion. (D) Red arrow indicates the proposed water pathway, which connects EC with IC after excluding the residue L152 from the surface drawing of the TM helices. Results from Gupta et al. Nature. and reproduced in part with the permission from Gupta et al. J Sync. Rad. .

Similar articles

Cited by

References

    1. Carpenter EP; Beis K; Cameron AD; Iwata S Overcoming the challenges of membrane protein crystallography. Curr. Opin. Struct. Biol, 2008, 18(5), 581–586. - PMC - PubMed
    1. Hong M; Zhang Y; Hu F Membrane protein structure and dynamics from NMR spectroscopy. Annu. Rev. Phys. Chem, 2012, 63, 1–24. - PMC - PubMed
    1. Ubarretxena-Belandia I; Stokes DL Present and future of membrane protein structure determination by electron crystallography. Adv. Protein Chem. Struct. Biol, 2010, 81, 33–60. - PMC - PubMed
    1. Goldie KN; Abeyrathne P; Kebbel F; Chami M; Ringler P; Stahlberg H Cryo-electron microscopy of membrane proteins. Methods Mol. Biol, 2014, 1117, 325–341. - PubMed
    1. Bartesaghi A; Subramaniam S Membrane protein structure determination using cryo-electron tomography and 3D image averaging. Curr. Opin. Struct. Biol, 2009, 19(4), 402–407. - PMC - PubMed