. 2018 Dec 19;140(50):17456-17464.
doi: 10.1021/jacs.8b07607. Epub 2018 Dec 11.

Imaging Insulin Secretion from Mouse Pancreas by MRI Is Improved by Use of a Zinc-Responsive MRI Sensor with Lower Affinity for Zn2+ Ions

Affiliations

Imaging Insulin Secretion from Mouse Pancreas by MRI Is Improved by Use of a Zinc-Responsive MRI Sensor with Lower Affinity for Zn2+ Ions

André F Martins et al. J Am Chem Soc. .

Abstract

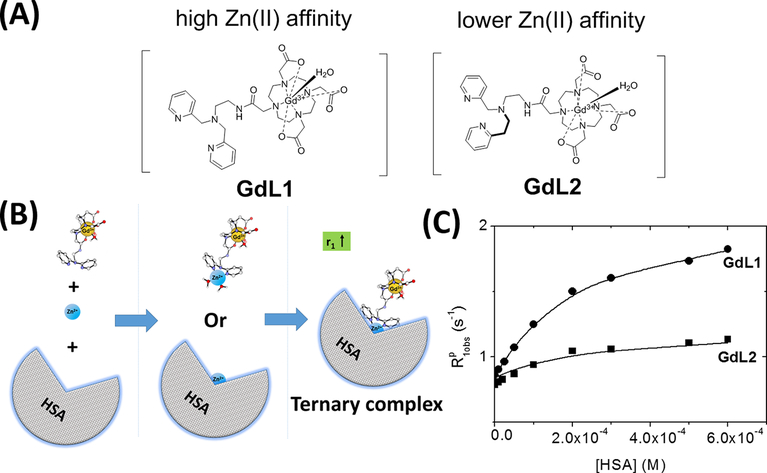
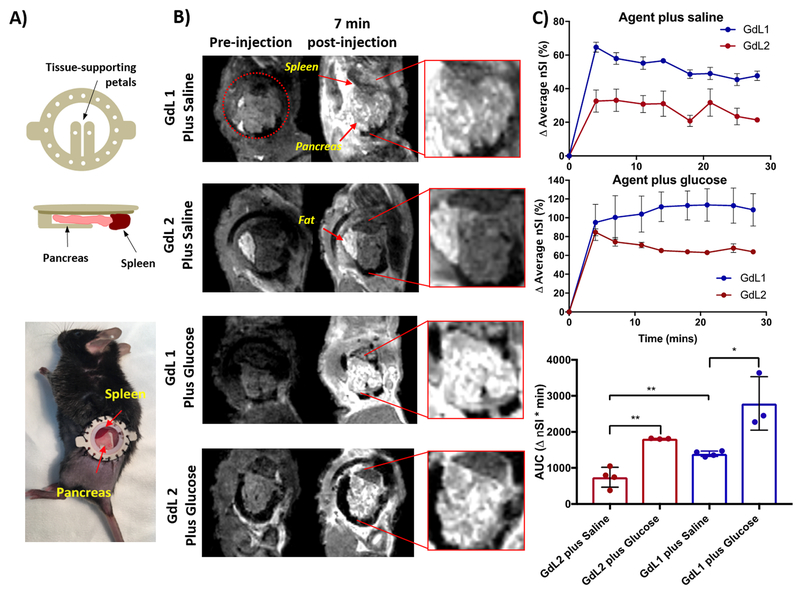
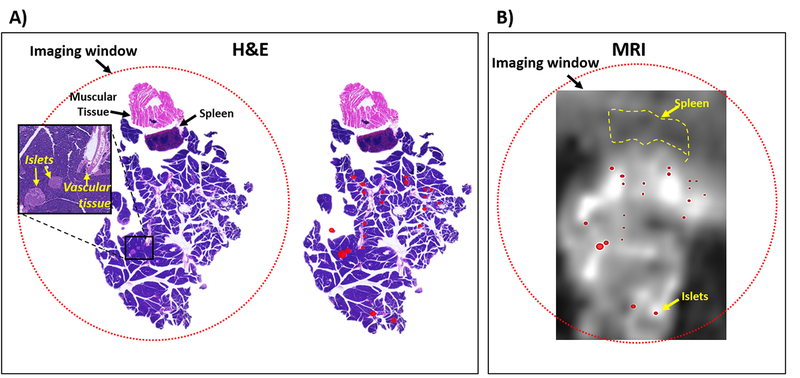
It has been demonstrated that divalent zinc ions packaged with insulin in β-cell granules can be detected by MRI during glucose-stimulated insulin secretion using a gadolinium-based Zn2+-sensitive agent. This study was designed to evaluate whether a simpler agent design having single Zn2+-sensing moieties but with variable Zn2+ binding affinities might also detect insulin secretion from the pancreas. Using an implanted MR-compatible window designed to hold the pancreas in a fixed position for imaging, we now demonstrate that focally intense "hot spots" can be detected in the tail of the pancreas using these agents after administration of glucose to stimulate insulin secretion. Histological staining of the same tissue verified that the hot spots identified by imaging correspond to clusters of islets, perhaps reflecting first-responder islets that are most responsive to a sudden increase in glucose. A comparison of images obtained when using a high-affinity Zn2+ sensor versus a lower-affinity sensor showed that the lower-affinity sensors produced the best image contrast. An equilibrium model that considers all possible complexes formed between Zn2+, the GdL sensor, and HSA predicts that a GdL sensor with lower affinity for Zn2+ generates a lower background signal from endogenous Zn2+ prior to glucose-stimulated insulin secretion (GSIS) and that the weaker binding affinity agent is more responsive to a further increase in Zn2+ concentration near β-cells after GSIS. These model predictions are consistent with the in vivo imaging observations.


Conflict of interest statement

The authors declare no competing financial interest.

Figures

Figure 1.
Figure 1.
(A) Chemical structures of GdDO3A-monoBPEN (GdL1) or monoPEPMA derivatives (GdL2). (B) Simplified illustration of the formation of a ternary complex, GdL-Zn-HSA. (C) Proton relaxation enhancement titrations of each complex (GdL1 and GdL2, 0.1 mM) as a function of increasing [HSA]. [Zn2+] was held constant (0.6 mM, equal to the highest concentration of HSA) in each titration. All measurements were performed at 0.5 T, 37 °C in 100 mM Tris buffer at pH 7.
Figure 2.
Figure 2.
Localized hotspots are observed in the pancreas tail by MRI after stimulation by glucose using an implanted imaging window to localize the mouse pancreas. (A) MR-compatible implantable window allowing the tail of the pancreas and spleen to be visible and held in place by the glass window coverslip. (B) 3D T1-weighted MRI of mouse pancreas pre- and postdelivery of 0.07 mmol/kg GdL1 or GdL2 plus saline or glucose. (C) Average MR signal intensity of the pancreas (compared to pre-injection baseline scans) after injection of either GdL1 or GdL2 agent plus saline (top panel). The middle panel shows the average signal of the pancreas (compared to preinjection baseline scans) after injection of either GdL1 or GdL2 agent plus glucose. The bottom panel shows the average area under the entire curve from 0 to 28 min for saline-treated mice (N = 4) and for glucose-treated animals (N = 3). Bars represent the standard error of the mean; *p-value < 0.05, **p-value < 0.01.
Figure 3.
Figure 3.
Pancreatic islets in the tail of the pancreas colocalizes with MRI-observed glucose-stimulated insulin secretion (GSIS) hotspots. (A) Mouse pancreas tail held by imaging window was resected and sectioned for histological staining. Islets were identified throughout the tissue (left) and labeled for visual identification (right). (B) MR image of a slice of tissue that closely matches the histological slice was collect 7 min after injection GdL2 and glucose. Labeled islets (red circles) from H&E are shown as an overlay.
Figure 4.
Figure 4.
Formation of the ternary complexes occurs mainly at the HSA MBS/site A, and the mathematical model predicts the expected contrast intensity signal. (A) Domain structure of albumin (PDB ID code 1AO6): domains I and II are colored green (residues 1–373), domain III is in yellow (residues 380–571), and long chain fatty acid sites (FA), Sudlow’s drug binding sites, and zinc binding site A (MBS/site A) are also shown. (B) The 59.92 MHz 113Cd NMR spectra of HSA (2 mM) in the presence of 3 mol equiv of 113CdCl2, at pD = 7.4 (bottom) and after the addition of 2 mol equiv of LaL1-Zn (middle) and LaL1 alone (top) in Tris buffer. The black arrows point to two new 113Cd sites that appear after addition of the agent. (C) HSA MBS/site A bound to Zn-GdL1: minimized MM+ structure involving zinc coordination with His-67, His247, and the two pyridines on the sensor. The surface charge is colored in red and blue for negative and positive charges, respectively. Zinc is colored light blue and gadolinium is gold. (D) Calculated plots of Δ contrast intensity (%) vs total Zn(II) levels, starting at 50 μM basal Zn2+ levels in the extracellular space around β-cells. The model assumes total extracellular [GdL] = 100 μM and total [HSA] = 600 μM. The red arrows reflect the range of Zn2+ concentrations where the image contrast would remain sensitive to changes in [Zn2+].

Similar articles

Cited by

References

    1. Merbach AE; Helm L; Toth E The Chemistry of Contrast Agents in Medical Magnetic Resonance Imaging, 2nd ed.; John Wiley & Sons: Chichester, UK, 2013.
    1. Goyen M Gadofosveset-Enhanced Magnetic Resonance Angiography. Vasc. Health Risk Manag 2008, 4, 1–9. - PMC - PubMed
    1. Pierre VC; Allen MJ; Caravan P Contrast Agents for MRI: 30+ Years and Where Are We Going? JBIC J. Biol. Inorg. Chem 2014, 19, 127–131. - PMC - PubMed
    1. Zhang X; Lovejoy KS; Jasanoff A; Lippard SJ Water- Soluble Porphyrins as a Dual-Function Molecular Imaging Platform for MRI and Fluorescence Zinc Sensing. Proc. Natl. Acad. Sci. U. S. A 2007, 104, 10780–10785. - PMC - PubMed
    1. De Leon-Rodriguez L; Lubag AJM Jr.; Sherry AD Imaging Free Zinc Levels in Vivo — What Can Be Learned? Inorg. Chim. Acta 2012, 393, 12–23. - PMC - PubMed

Publication types

MeSH terms