. 2019 Mar;67(3):467-481.
doi: 10.1002/glia.23556. Epub 2018 Nov 28.

The formation of a glial scar does not prohibit remyelination in an animal model of multiple sclerosis

Affiliations

The formation of a glial scar does not prohibit remyelination in an animal model of multiple sclerosis

Michaela Tanja Haindl et al. Glia. 2019 Mar.

Abstract

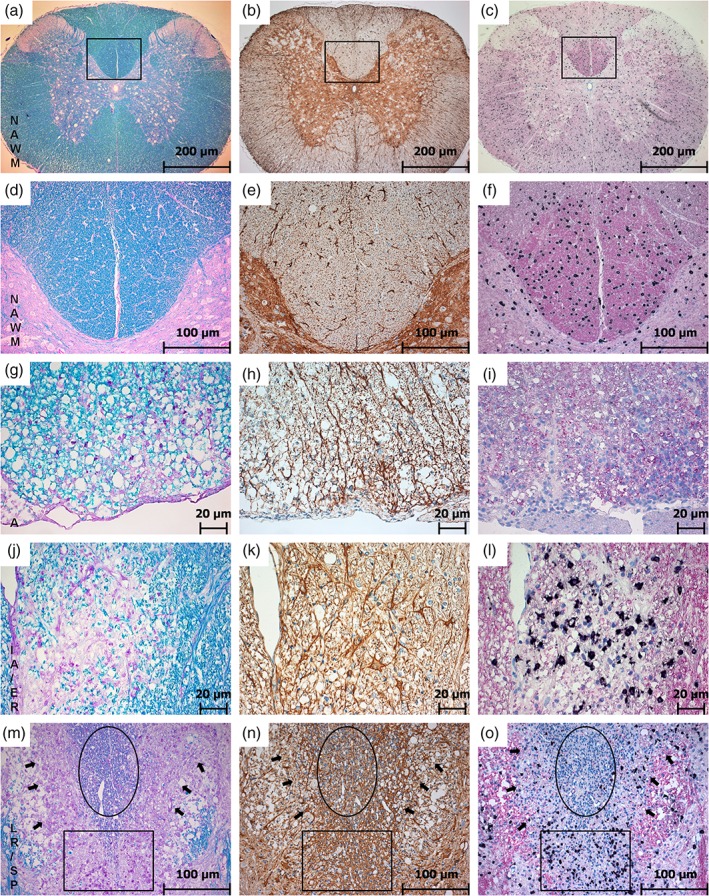
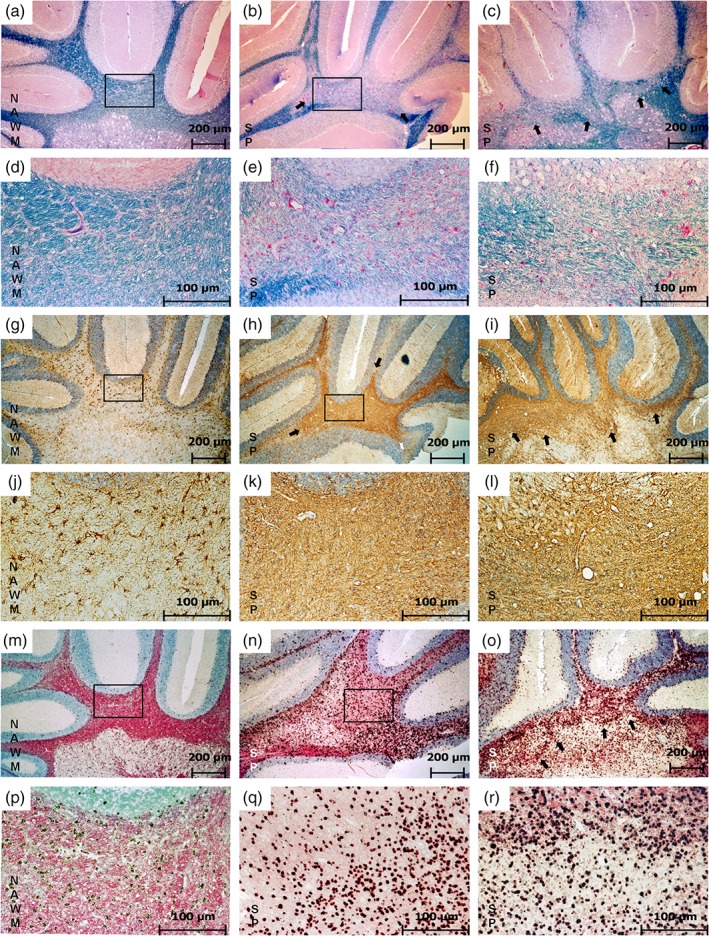
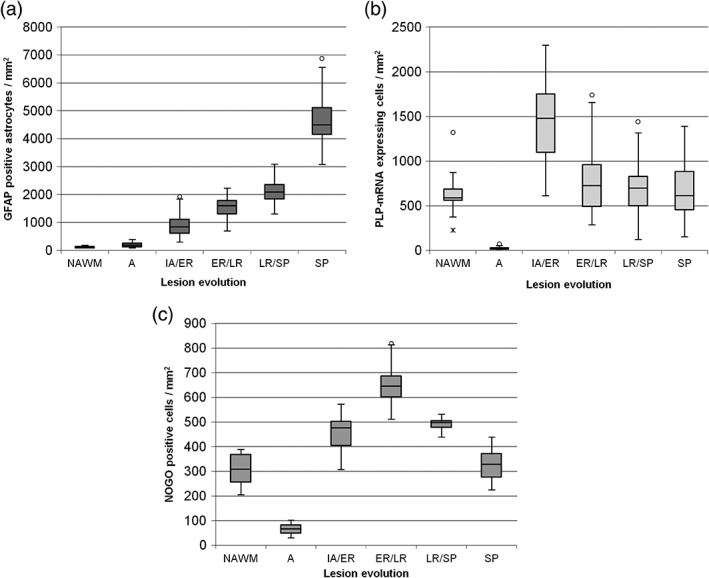
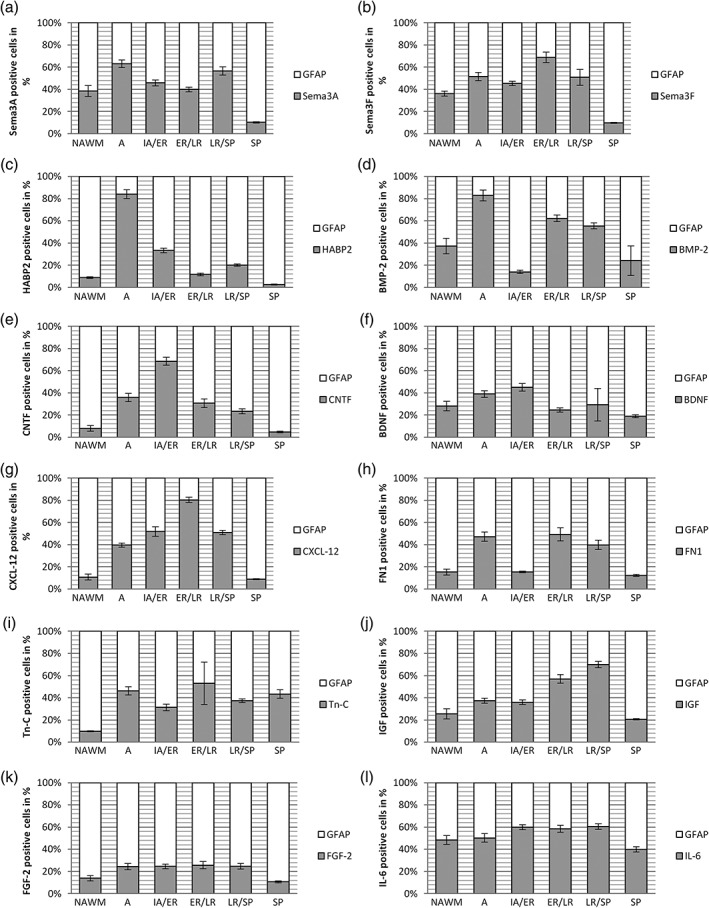
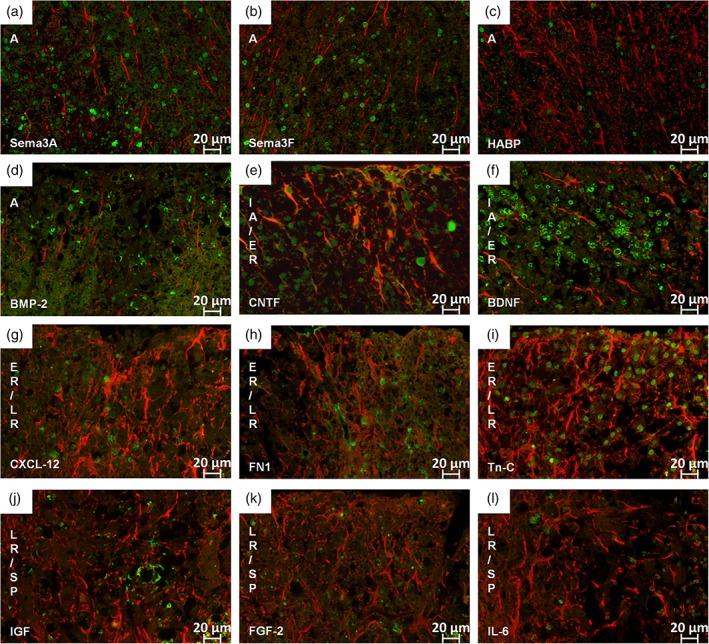
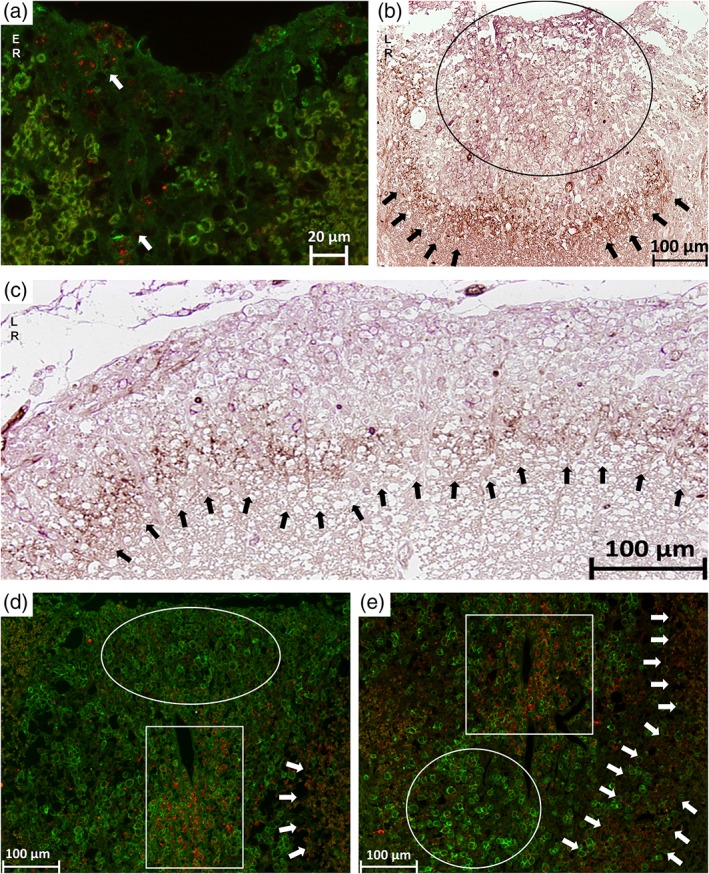
The role of astrocytes in the pathophysiology of multiple sclerosis (MS) is discussed controversially. Especially the formation of the glial scar is often believed to act as a barrier for remyelination. At the same time, astrocytes are known to produce factors that influence oligodendrocyte precursor cell (OPC) survival. To explore these mechanisms, we investigated the astrocytic reaction in an animal model induced by immunization with myelin oligodendrocyte glycoprotein (MOG) in Dark Agouti (DA) rats, which mimics most of the histological features of MS. We correlated the astroglial reaction by immunohistochemistry (IHC) for glial fibrillary acidic protein (GFAP) to the remyelination capacity by in situ hybridization for mRNA of proteolipid protein (PLP), indicative of OPCs, over the full course of the disease. PLP mRNA peaked in early remyelinating lesions while the amount of GFAP positive astrocytes was highest in remyelinated lesions. In shadow plaques, we found at the same time all features of a glial scar and numbers of OPCs and mature oligodendrocytes, which were nearly equal to that in unaffected white matter areas. To assess the plaque environment, we furthermore quantitatively analyzed factors expressed by astrocytes previously suggested to influence remyelination. From our data, we conclude that remyelination occurs despite an abundant glial reaction in this animal model. The different patterns of astrocytic factors and the occurrence of different astrocytic phenotypes during lesion evolution furthermore indicate a finely regulated, balanced astrocytic involvement leading to successful repair.

Keywords: astrocytes; glial scar; multiple sclerosis; oligodendrocyte precursor cells; remyelination; shadow plaque.


Conflict of interest statement

The authors declare no conflicts of interest.

Figures

Figure 1
Figure 1
Lesion evolution in the rat spinal cord. This figure shows the results of LFB over the course of lesion evolution (first column: (a), (d), (g), (j), (m)). In this staining, lesion areas can be detected as an overview in pink and SPs are represented in pale blue due to thinner myelin sheaths after remyelination. GFAP‐IHC (second column: (b), (e), (h), (k), (n)) shows reactive astrocytes (dark brown) and is used to trace astrogliosis. PLP‐ISH (third column: (c), (f), (i), (l), (o)) shows OPC density via PLP mRNA ISH (black) and the corresponding protein (in pink) at the same time. The rectangles in the figures of the first line (a–c) indicate the areas in the second line at a higher magnification (d–f). The first and the second line show the NAWM with normal, dark blue myelin in LFB (a, d), only some active astrocytes in GFAP (b, e), and a normal distribution of OPCs with a strong PLP immunoreactivity (c, f). In active lesions pink areas represent the absent myelin in LFB; macrophages are carrying early (blue) myelin degradation products (g). Astrocytes are more activated and start to branch (h), OPCs are nearly absent and PLP loss is indicated by a pale pink area (j). IA/ER clearly set apart in pink in LFB and myelin degradation products are already digested and appear in pink as well (j). Astrocytes are getting even larger and more branched (k) and a massive accumulation of OPCs can be observed in the same area where PLP loss is detectable (l). Lesions tend to undergo smooth transition between different stages with different lesion types bordering (m–o). The circle marks the SP area in LFB (m), GFAP (n) and PLP (o). The rectangle indicates a part with ongoing ER and the arrows point at the border of LR (magnification: (a–c) 50×; (d–f) and (m–o) 200×; (g–l) 400×) [Color figure can be viewed at wileyonlinelibrary.com]
Figure 2
Figure 2
Shadow plaques in the rat brain. This figure shows a direct comparison of SP features and NAWM as found in the cerebellar white matter. Panels (a–f) represent LFB staining, (g–l) show GFAP‐IHC, (m–r) show PLP ISH. In NAWM (a, d) myelin appears in dark blue in LFB staining (a). The rectangle indicates the area represented in (d) at a higher magnification. The fully remyelinated SP appears in light blue due to thinner myelin sheaths after accomplished remyelination (b, c, e, f). The rectangle in (b) indicates the area shown in (e) and the arrows in (b) and (c) point at the SP border. Only some astrocytes appear GFAP positive in NAWM (g). The rectangle indicates the area represented in (j) at a higher magnification. In SP areas, astrocytes exhibit all features associated with a glial scar (h, i, k, l). The rectangle in (h) indicates the area represented in (k). The arrows in (h) and (i) point at the border of the glial scar. In NAWM, a normal occurrence of OPCs (black) and PLP (pink) can be observed (m). The rectangle indicates the area represented in (p) with a higher magnification. The distribution of OPCs in SP appears similar to their distribution in NAWM but with less PLP immunoreactivity in the background represented by a much paler pink background (n, o, q, r). The rectangle in (n) indicates the area shown in (q) and the arrows in (o) point to the SP border (magnification: (a–c), (g–i), (m–o) 50×; (d–f), (j–l), (p–r) 200×) [Color figure can be viewed at wileyonlinelibrary.com]
Figure 3
Figure 3
Statistical analyses of GFAP positive astrocytes, PLP mRNA expressing OPCs and NOGO positive mature oligodendrocytes. Astrogliosis as a marker of diseased tissue increases during lesion evolution and reaches its peak in SP representing all features known for a glial scar (a). In NAWM, only a few astrocytes are GFAP positive and a significant upregulation of GFAP expressing astrocytes is detectable in SP with almost all astrocytes expressing GFAP. All groups differ significantly from each other (p < .01). In total, 540 lesions were quantified for GFAP (out of 45 rats). The observation of OPCs during lesion evolution reveals in a peak of PLP mRNA expression in IA/ER (b). In A hardly any OPCs expressing PLP mRNA are detectable. PLP mRNA expression in fully remyelinated SP shows close resemblance to the expression in NAWM. ER/LR and LR/SP results are slightly over the range of detected OPCs in NAWM and SP. Only A and IA/ER lesions differ significantly from the other groups (p < .01). In total, 450 lesions were quantified for PLP (out of 45 rats). As expected the distribution of NOGO‐positive cells (mature oligodendrocytes) follow the course of OPCs with a slight delay. During A mature oligodendrocytes are comparably low. There is an increase in mature oligodendrocytes detectable during early remyelination indicating a successful differentiation of OPCs. Mature oligodendrocytes are also detectable during late remyelination and their occurrence in SP is comparable with their appearance in NAWM. All groups differ significantly from each other (p < .01) with the exception of NAWM to SP (p = .541) and IA/ER to ER/LR (p = .086). In total, 120 lesions were quantified for NOGO (out of 15 rats)
Figure 4
Figure 4
Percentage scale of GFAP positive astrocytes and astrocyte‐derived factors on selected spinal cord lesions. In each lesion type the mean of all astrocytes represents the 100% scale and the corresponding astrocytes expressing factors involved in OPC regulation are given in the appropriate ratios (for each factor n = 20 selected lesions per type). Error bars represent 95% CI. The guidance molecule Sema3A (a) peaked in A with more than 60% of active astrocytes expressing this factor and additionally showed a high occurrence in LR/SP with approximately 55%. In A, the expression of Sema3F (b) is higher than in IA/ER and peaks again in ER/LR. HABP2 (c) is highly present during A with more than 80% of all astrocytes expressing this factor. It decreases again to 5–30% during remyelination. BMP‐2 (d) is comparably high during A decreases in IA/ER and increases again during later remyelination steps. CNTF expression (e) increases during lesion evolution with a peak of almost 70% CNTF positive astrocytes in IA/ER and decreases again to approximately 5% in SP. BDNF (f) expression increases from NAWM to IA/ER, decreases in ER/LR, increases again in LR/SP and reaches its minimum in SP. CXCL‐12 (g) increases during lesion evolution, peaks in ER/LR with 80% of active astrocytes expressing this factor and decreases again from LR/SP to SP. Around 50% of all astrocytes are FN1 positive during A and late remyelination steps (h). Tn‐C is upregulated during A and ER/LR (i). The expression of IGF (j) rises from NAWM to LR/SP with a slight increase in A and falls rapidly from LR/SP to SP. FGF‐2 (k) showed only a slight increase from NAWM to A and decreases from LR/SP to SP. IL‐6 (l) shows a more uniform course with a slight increase of IL‐6 expression during remyelination process with more than 50% of all active astrocytes expressing IL‐6
Figure 5
Figure 5
IF double staining for GFAP and selected astrocyte‐derived factors. In all figures GFAP appears in red and the respective factor in green. All factors are mainly present in the nucleus of the astrocytes. As Sema3A (a), Sema3F (b), HABP2 (c), and BMP‐2 (d) are mainly present during active demyelination those lesions are represented in the respective figure (a–d). Astrocytes are here in an early reactive state with mainly single nuclei and no branching. Factors mainly present during IA/ER are CNTF (e) and BDNF (f); astrocytes are enlarged and begin to branch at this stage. The factors CXCL‐12 (g), FN1 (h) and Tn‐C (i) are mainly present during ER/LR. During LR/SP we could detect more IGF (j) signal than FGF‐2 (k) and IL‐6 (l). (magnification: (a–l) 400×) [Color figure can be viewed at wileyonlinelibrary.com]
Figure 6
Figure 6
The switch of astrocytic phenotypes A1 and A2 during lesion evolution. In all IF stainings, the A1 phenotype (C3d) appears in red and the A2 phenotype (S100A10) in green. In all IHC stainings, the A1 phenotype appears in brown and the A2 phenotype in purple. In (a) a early remyelinating lesion is shown on a IF stained slide where the A2 phenotype is mainly present and the A1 phenotype is spread over the lesion in a granular‐like pattern indicated by the arrows. In (b) a IHC of a late remyelinating lesion is marked by the circle where the A2 phenotype (purple) is mainly present. The arrows point at the lesion border where the A1 phenotype (brown) accumulates. This remarkable border is also shown in another late remyelination lesion in (c) indicated by the arrows. In (d) and (e), IF stainings are shown with different lesion types side‐by‐side. The circles show SPs where the A2 phenotype (green) is mainly present. In the rectangles early remyelinating areas are marked with the A1 phenotype (red) spread over in a granular‐like pattern. The arrows show the border of A1 phenotype, which was detectable during later remyelination steps in our sample [Color figure can be viewed at wileyonlinelibrary.com]

Similar articles

Cited by

References

    1. Anderson, M. A. , Burda, J. E. , Ren, Y. , Ao, Y. , Coppola, G. , Khakh, B. S. , … Angeles, L. (2016). Astrocyte scar formation aids CNS axon regeneration. Nature, 532, 195–200. - PMC - PubMed
    1. Azin, M. , Mirnajafi‐Zadeh, J. , & Javan, M. (2014). Fibroblast growth factor‐2 enhanced the recruitment of progenitor cells and myelin repair in experimental demyelination of rat hippocampal formations. Cell Journal, 17, 540–546. - PMC - PubMed
    1. Back, S. A. , Tuohy, T. M. F. , Chen, H. , Wallingford, N. , Craig, A. , Struve, J. , … Sherman, L. S. (2005). Hyaluronan accumulates in demyelinated lesions and inhibits oligodendrocyte progenitor maturation. Nature Medicine, 11, 966–972. - PubMed
    1. Bauer J, Bradl M, Klein M, Leisser M, Deckwerth TL, Wekerle H, Lassmann H. 2002. Endoplasmic reticulum stress in PLP‐overexpressing transgenic rats: Gray matter oligodendrocytes are more vulnerable than white matter oligodendrocytes. The Journal of Neuropathology & Experimental Neurology 61:12–22. Available from: http://www.ncbi.nlm.nih.gov/htbin‐post/Entrez/query?db=m&form=6&dopt=r&u... - PubMed
    1. Brambilla, R. , Morton, P. D. , Ashbaugh, J. J. , Karmally, S. , Lambertsen, K. L. , & Bethea, J. R. (2014). Astrocytes play a key role in EAE pathophysiology by orchestrating in the CNS the inflammatory response of resident and peripheral immune cells and by suppressing remyelination. Glia, 62, 452–467. - PubMed