

A computational investigation of lift generation and power expenditure of Pratt's roundleaf bat (Hipposideros pratti) in forward flight
- PMID: 30485321
- PMCID: PMC6261594
- DOI: 10.1371/journal.pone.0207613
A computational investigation of lift generation and power expenditure of Pratt's roundleaf bat (Hipposideros pratti) in forward flight
Abstract
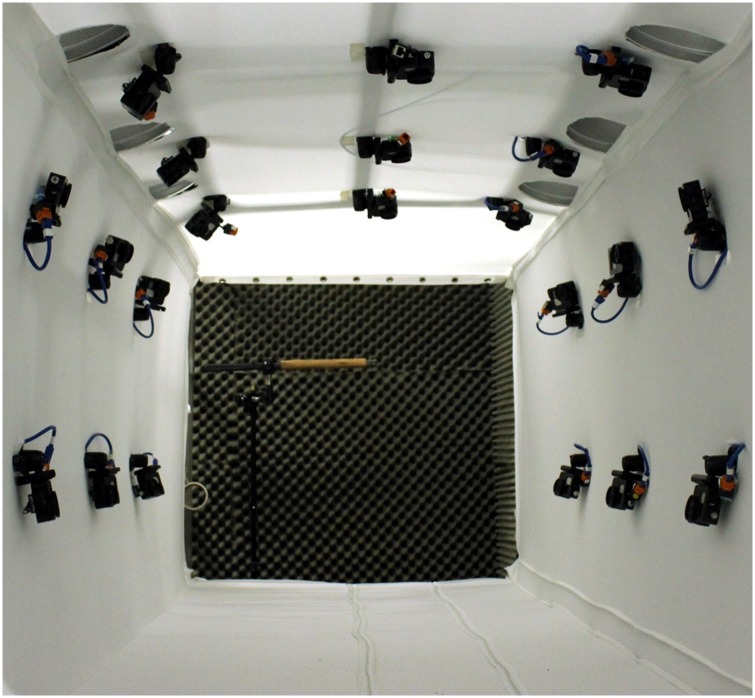
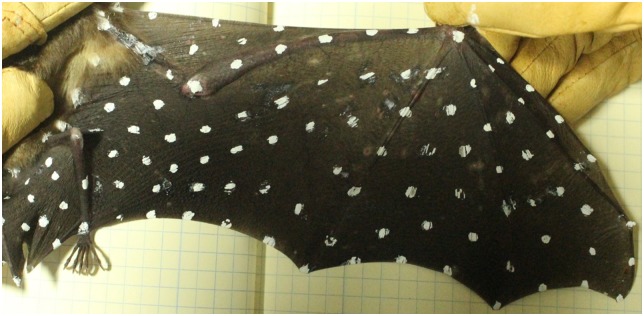
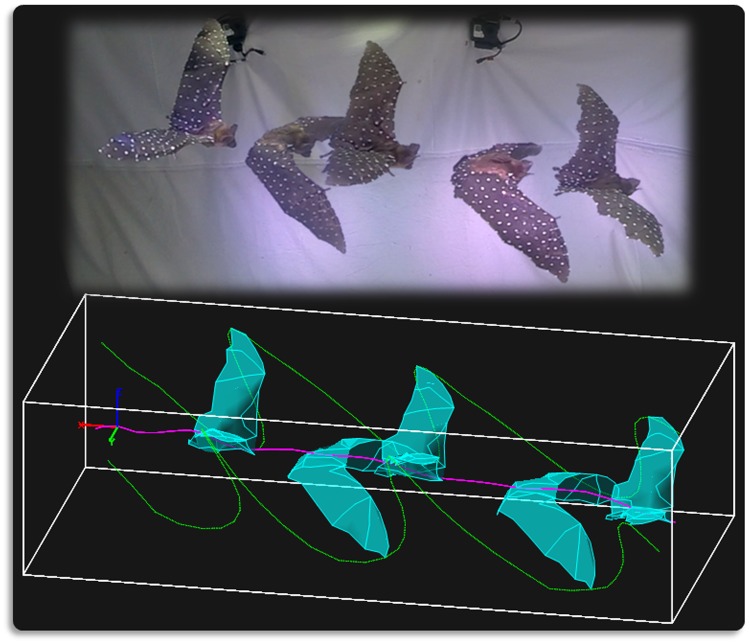
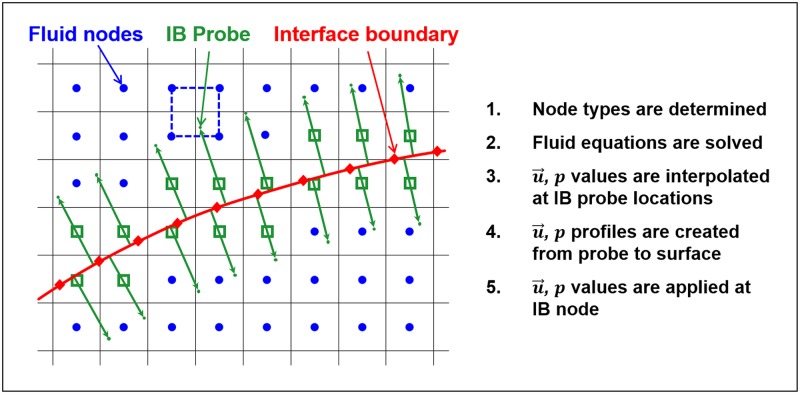
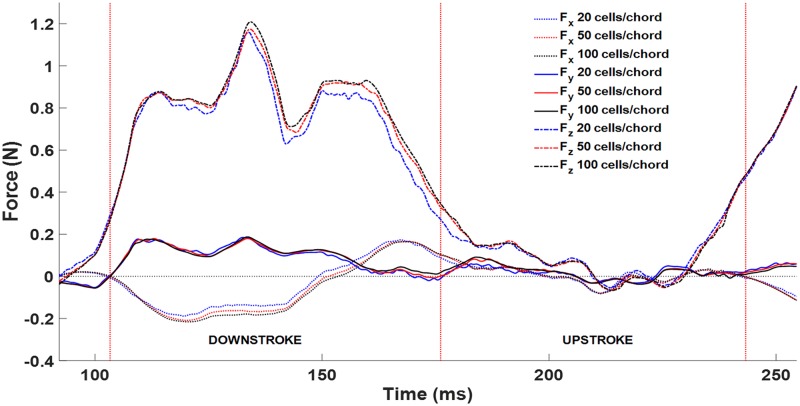
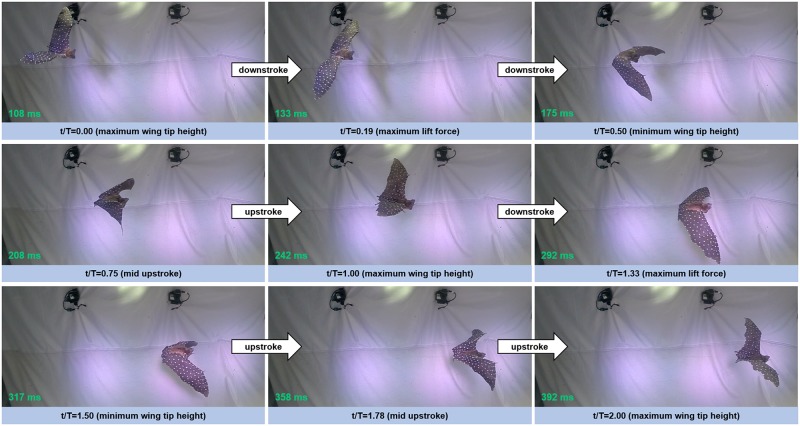
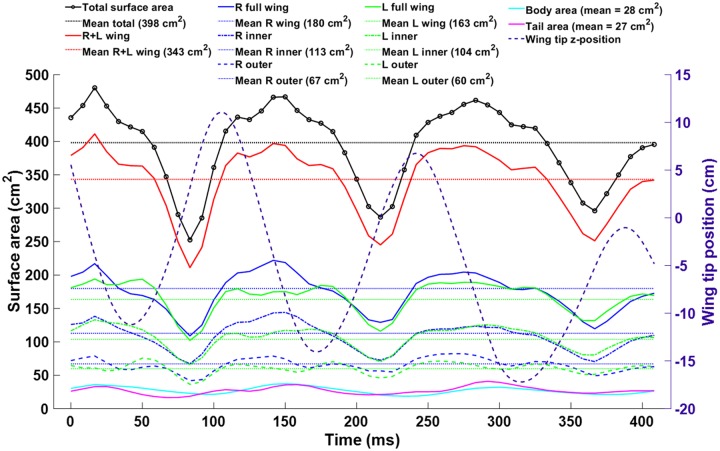
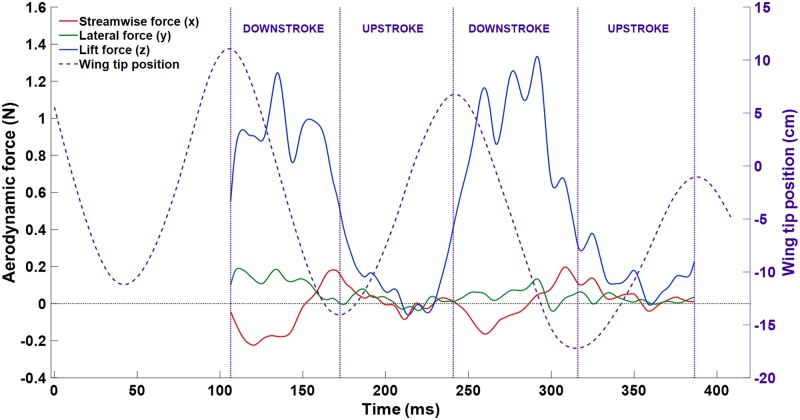
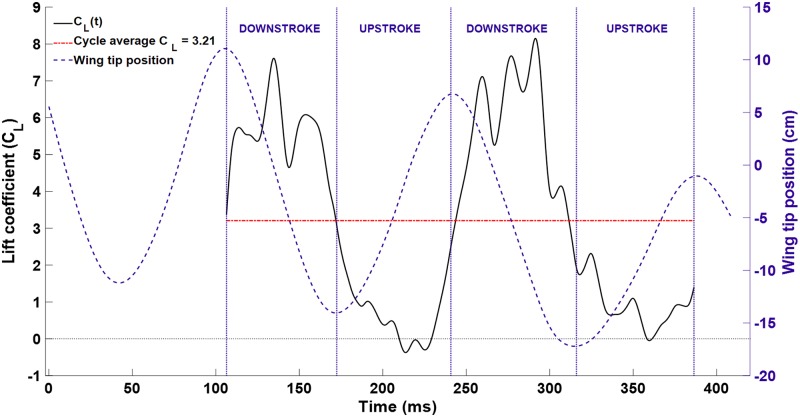
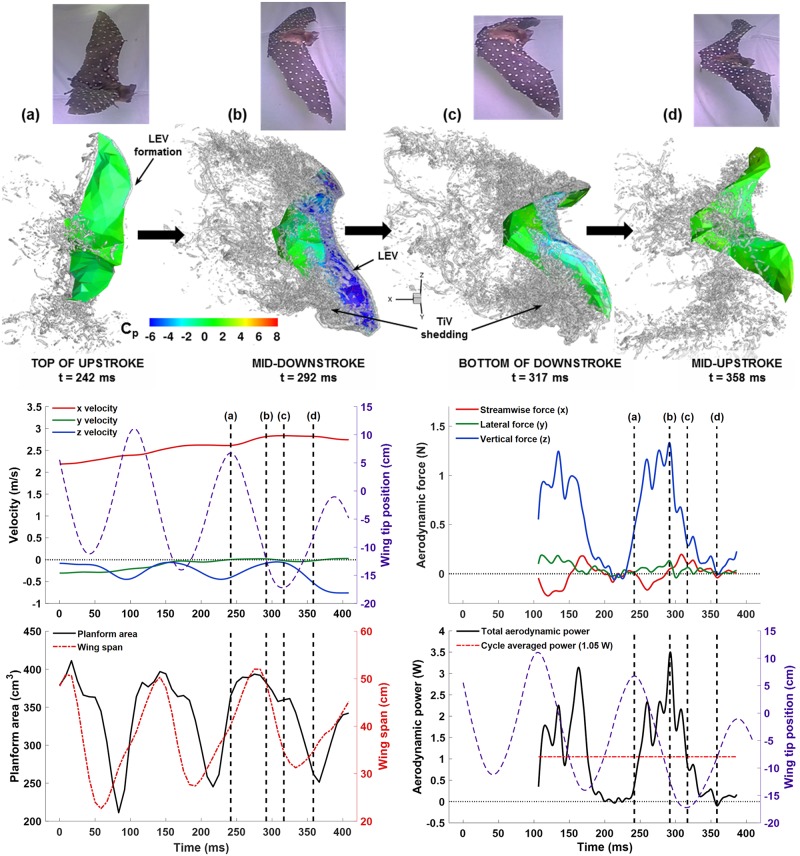
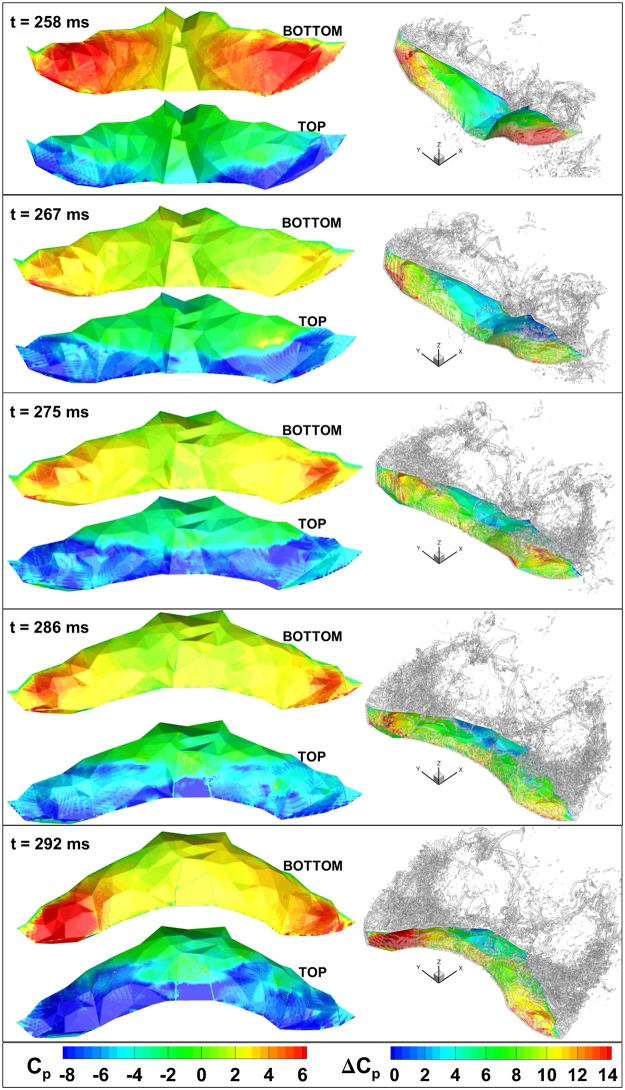
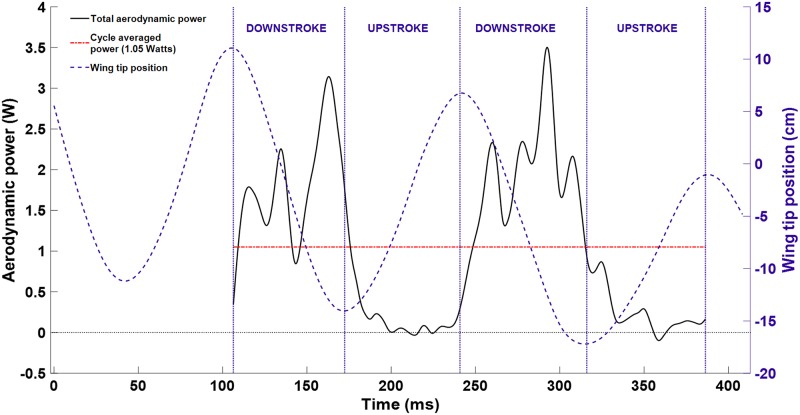
The aerodynamic mechanisms of bat flight have been studied using a numerical approach. Kinematic data acquired using a high resolution motion capture system was employed to simulate the unsteady air flow around a bat's wings. A flapping bat wing contains many degrees of freedom, which make 3D motion tracking challenging. In order to overcome this challenge, an optical motion capture system of 21 cameras was used to reduce wing self-occlusion. Over the course of a meter-long flight, 108 discrete marker points on the bat's wings (Pratt's roundleaf bat, Hipposideros pratti) were tracked. The time evolution of the surface of each wing was computationally reconstructed in 3D space. The resulting kinematic model was interfaced with an unsteady incompressible flow solver using the immersed boundary method (IBM) and large eddy simulation (LES). Verification and validation of the flow simulation were conducted to establish accuracy. The aerodynamic forces calculated from the simulation compared well to the forces theoretically needed to sustain the observed flight trajectory. The transient flow field generated by the simulation allowed for the direct calculation of lift, drag, and power output of the bat during flight. The mean lift coefficient was found to be 3.21, and the flap cycle averaged aerodynamic power output was 1.05 W. Throughout the flap cycle, the planform area of the wings varied up to 46% between the largest and smallest values. During the upstroke, wing rotation was found to mitigate negative lift thereby improving overall flight efficiency. The high resolution motion capture and flow simulation framework presented here has the potential to facilitate the understanding of complex bat flight aerodynamics for both straight and maneuvering flight modes.
Conflict of interest statement
The authors have declared that no competing interests exist.
Figures

Similar articles
-
Canonical description of wing kinematics and dynamics for a straight flying insectivorous bat (Hipposideros pratti).PLoS One. 2019 Jun 25;14(6):e0218672. doi: 10.1371/journal.pone.0218672. eCollection 2019. PLoS One. 2019. PMID: 31237912 Free PMC article.
-
Analysis of a 180-degree U-turn maneuver executed by a hipposiderid bat.PLoS One. 2020 Nov 3;15(11):e0241489. doi: 10.1371/journal.pone.0241489. eCollection 2020. PLoS One. 2020. PMID: 33141874 Free PMC article.
-
Direct Measurements of the Wing Kinematics of a Bat in Straight Flight.J Biomech Eng. 2021 Apr 1;143(4):041006. doi: 10.1115/1.4049161. J Biomech Eng. 2021. PMID: 33210129
-
Bat flight: aerodynamics, kinematics and flight morphology.J Exp Biol. 2015 Mar;218(Pt 5):653-63. doi: 10.1242/jeb.031203. J Exp Biol. 2015. PMID: 25740899 Review.
-
Flapping wing aerodynamics: from insects to vertebrates.J Exp Biol. 2016 Apr;219(Pt 7):920-32. doi: 10.1242/jeb.042317. J Exp Biol. 2016. PMID: 27030773 Review.
Cited by
-
Turning-ascending flight of a Hipposideros pratti bat.R Soc Open Sci. 2022 Jun 8;9(6):211788. doi: 10.1098/rsos.211788. eCollection 2022 Jun. R Soc Open Sci. 2022. PMID: 35706670 Free PMC article.
-
Canonical description of wing kinematics and dynamics for a straight flying insectivorous bat (Hipposideros pratti).PLoS One. 2019 Jun 25;14(6):e0218672. doi: 10.1371/journal.pone.0218672. eCollection 2019. PLoS One. 2019. PMID: 31237912 Free PMC article.
-
Power requirements for bat-inspired flapping flight with heavy, highly articulated and cambered wings.J R Soc Interface. 2022 Sep;19(194):20220315. doi: 10.1098/rsif.2022.0315. Epub 2022 Sep 21. J R Soc Interface. 2022. PMID: 36128710 Free PMC article.
-
Upstroke wing clapping in bats and bat-inspired robots offers efficient lift generation.J R Soc Interface. 2025 Feb;22(223):20240590. doi: 10.1098/rsif.2024.0590. Epub 2025 Feb 19. J R Soc Interface. 2025. PMID: 39968874 Free PMC article.
-
Analysis of a 180-degree U-turn maneuver executed by a hipposiderid bat.PLoS One. 2020 Nov 3;15(11):e0241489. doi: 10.1371/journal.pone.0241489. eCollection 2020. PLoS One. 2020. PMID: 33141874 Free PMC article.
References
-
- Shyy W, Aono H, Chimakurthi SK, Trizila P, Kang CK, Cesnik CES, et al. Recent progress in flapping wing aerodynamics and aeroelasticity. Prog Aerosp Sci. Elsevier; 2010;46: 284–327. 10.1016/j.paerosci.2010.01.001 - DOI
-
- Shyy W, Berg M, Ljungqvist D. Flapping and flexible wings for biological and micro air vehicles. Prog Aerosp Sci. 1999;35: 455–505. 10.1016/S0376-0421(98)00016-5 - DOI
-
- Lentink D, Jongerius SR, Bradshaw NL. The scalable design of flapping micro-air vehicles inspired by insect flight. Flying Insects and Robots. 2010. pp. 185–205. 10.1007/978-3-540-89393-6_14 - DOI
-
- Ho S, Nassef H, Pornsinsirirak N, Tai YC, Ho CM. Unsteady aerodynamics and flow control for flapping wing flyers. Progress in Aerospace Sciences. 2003. pp. 635–681. 10.1016/j.paerosci.2003.04.001 - DOI
-
- Chin DD, Lentink D. Flapping wing aerodynamics: from insects to vertebrates. J Exp Biol. 2016;219: 920–932. 10.1242/jeb.042317 - DOI - PubMed
Publication types
MeSH terms
LinkOut - more resources
Full Text Sources
Other Literature Sources
