

Spatio-temporal epidemiology of anthrax in Hippopotamus amphibious in Queen Elizabeth Protected Area, Uganda
- PMID: 30485342
- PMCID: PMC6261556
- DOI: 10.1371/journal.pone.0206922
Spatio-temporal epidemiology of anthrax in Hippopotamus amphibious in Queen Elizabeth Protected Area, Uganda
Abstract
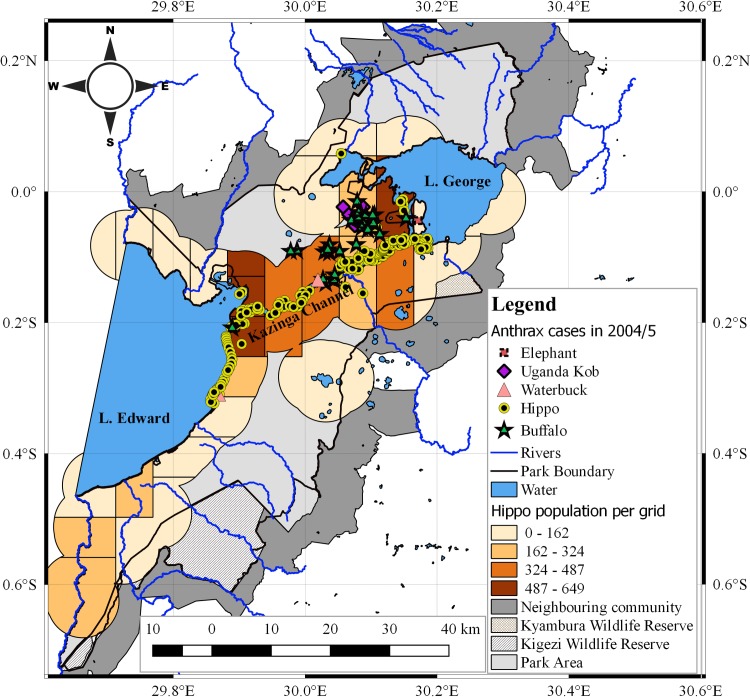
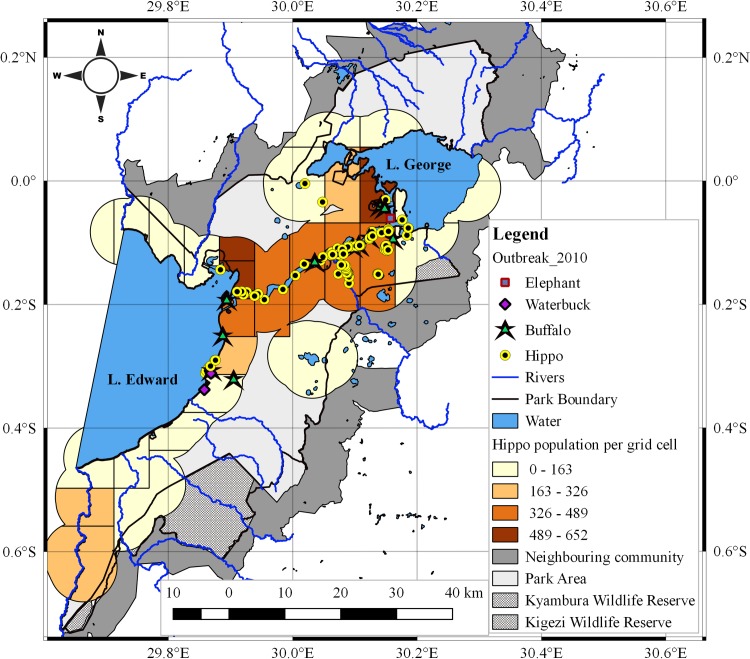
Background: Anthrax is a zoonotic disease primarily of herbivores, caused by Bacillus anthracis, a bacterium with diverse geographical and global distribution. Globally, livestock outbreaks have declined but in Africa significant outbreaks continue to occur with most countries still categorized as enzootic, hyper endemic or sporadic. Uganda experiences sporadic human and livestock cases. Severe large-scale outbreaks occur periodically in hippos (Hippopotamus amphibious) at Queen Elizabeth Protected Area, where in 2004/2005 and 2010 anthrax killed 437 hippos. Ecological drivers of these outbreaks and potential of hippos to maintain anthrax in the ecosystem remain unknown. This study aimed to describe spatio-temporal patterns of anthrax among hippos; examine significant trends associated with case distributions; and generate hypotheses for investigation of ecological drivers of anthrax.
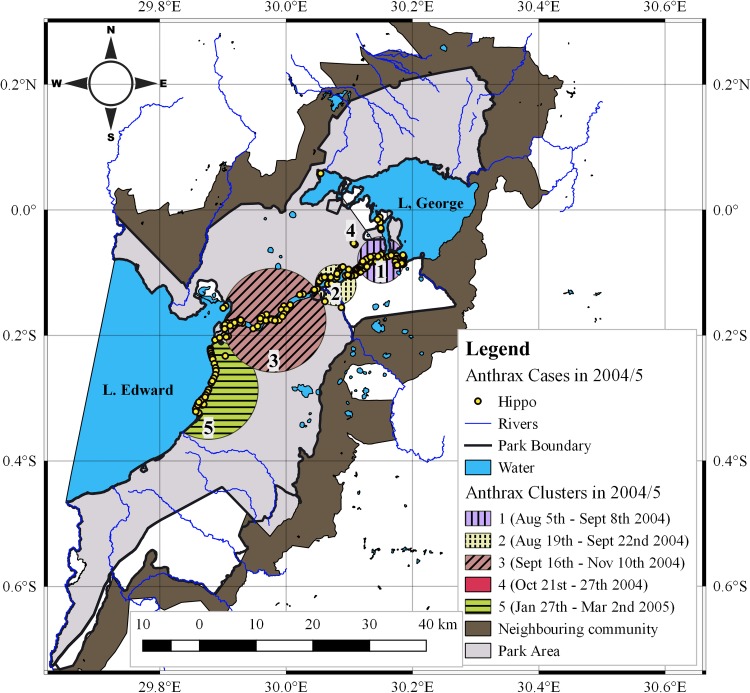
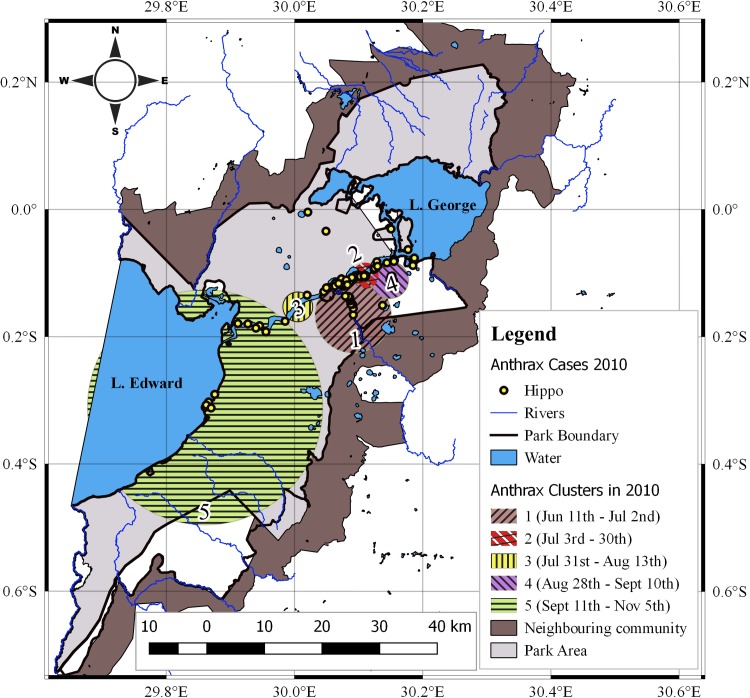
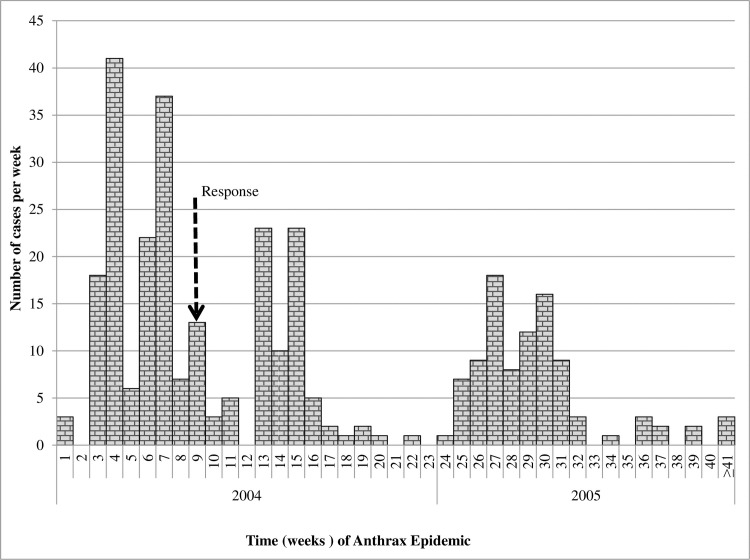
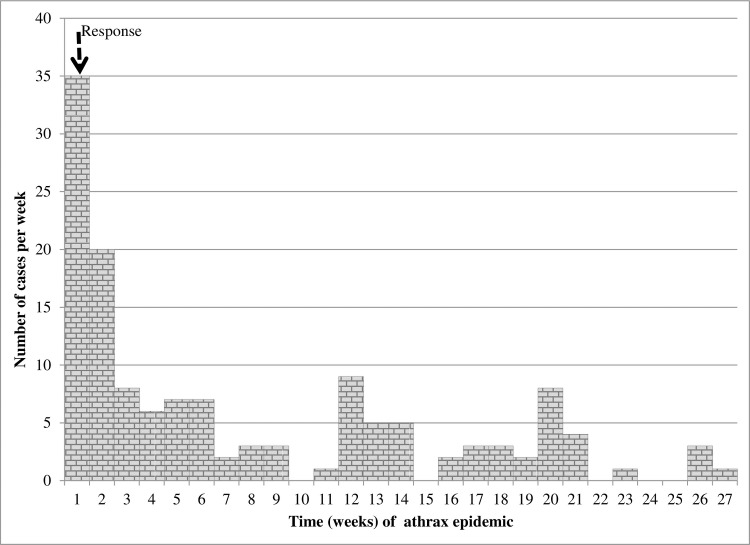
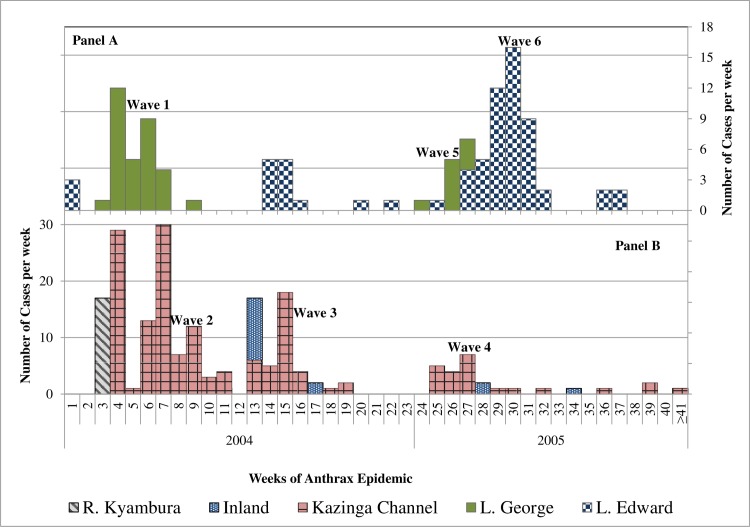
Methods: Spatio-temporal patterns of 317 hippo cases in 2004/5 and 137 in 2010 were analyzed. QGIS was used to examine case distributions; Spearman's nonparametric tests to determine correlations between cases and at-risk hippo populations; permutation models of the spatial scan statistics to examine spatio-temporal clustering of cases; directional tests to determine directionality in epidemic movements; and standard epidemic curves to determine patterns of epidemic propagation.
Key findings: Results showed hippopotamus cases extensively distributed along water shorelines with strong positive correlations (p<0.01) between cases and at-risk populations. Significant (p<0.001) spatio-temporal clustering of cases occurred throughout the epidemics, pointing towards a defined source. Significant directional epidemic spread was detected along water flow gradient (206.6°) in 2004/5 and against flow gradient (20.4°) in 2010. Temporal distributions showed clustered pulsed epidemic waves.
Conclusion: These findings suggest mixed point-source propagated pattern of epidemic spread amongst hippos and points to likelihood of indirect spread of anthrax spores between hippos mediated by their social behaviour, forces of water flow, and persistent presence of infectious carcasses amidst schools. This information sheds light on the epidemiology of anthrax in highly social wildlife, can help drive insight into disease control, wildlife conservation, and tourism management, but highlights the need for analytical and longitudinal studies aimed at clarifying the hypotheses.
Conflict of interest statement
The authors have declared that no competing interests exist.
Figures
References
-
- Antwerpen M.; Pilo P.; Wattiau P.; Butaye P.; Frey J.; Frangoulidis D. Bacillus anthracis: Anthrax. In:Elschner Mandy C., Cutler Sally J., Weidmann Manfred and Butaye Patrick editors. BSL3 and BSL4 Agents: Epidemiology, Microbiology, and Practical Guidelines,1stEd. Wiley-VCH Verlag GmbH & Co. KGaA. 2012. 1(1): 5–18.
-
- Dragon DC., Rennie RP. and Elkin BT. Detection of anthrax spores in endemic regions of northern Canada. Journal of Applied Microbiology. 2001;91(3): 435–441. - PubMed
-
- Hugh-Jones ME and De Vos V. Anthrax and wildlife. Revue Scientifique et Technique-Office International des Epizooties. 2002; 21(2):359–384. - PubMed
-
- WHO. Anthrax in humans and animals. 4th Ed Geneva, Switzerland: World Health Organization Press; 2008. bookorders@who.int.
-
- Jones SD. Death in a Small Package: A short history of anthrax. JHU Press, 2010.
Publication types
MeSH terms
LinkOut - more resources
Full Text Sources
Medical
