

The importance of local epidemic conditions in monitoring progress towards HIV epidemic control in Kenya: a modelling study
- PMID: 30485720
- PMCID: PMC6260921
- DOI: 10.1002/jia2.25203
The importance of local epidemic conditions in monitoring progress towards HIV epidemic control in Kenya: a modelling study
Abstract
Introduction: Setting and monitoring progress towards targets for HIV control is critical in ensuring responsive programmes. Here, we explore how to apply targets for reduction in HIV incidence to local settings and which indicators give the strongest signal of a change in incidence in the population and are therefore most important to monitor.
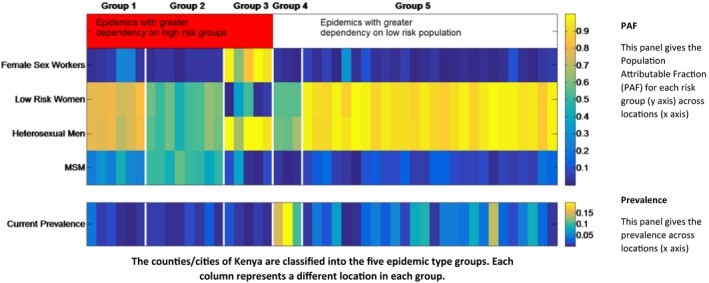
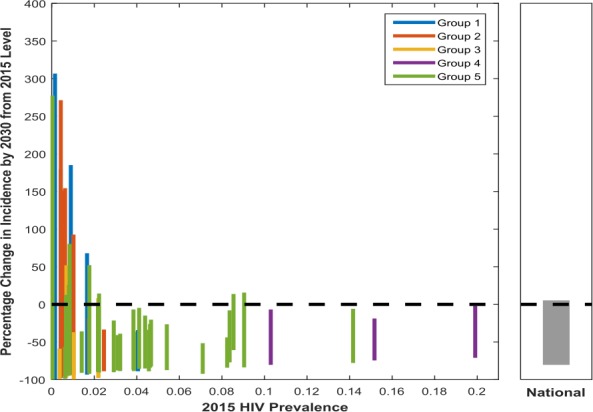
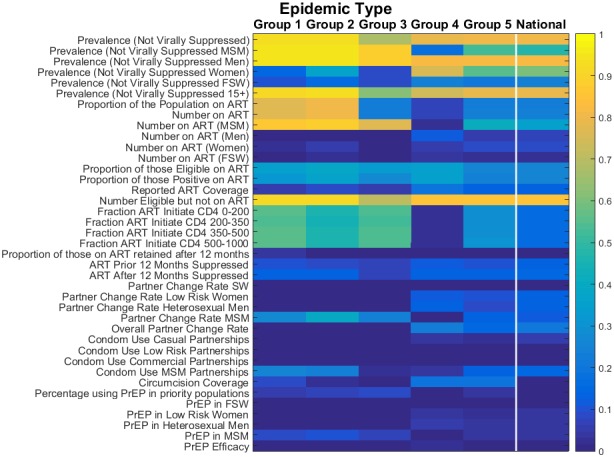
Methods: We use location-specific HIV transmission models, tailored to the epidemics in the counties and major cities in Kenya, to project a wide range of plausible future epidemic trajectories through varying behaviours, treatment coverage and prevention interventions. We look at the change in incidence across modelled scenarios in each location between 2015 and 2030 to inform local target setting. We also simulate the measurement of a library of potential indicators and assess which are most strongly associated with a change in incidence.
Results: Considerable variation was observed in the trajectory of the local epidemics under the plausible scenarios defined (only 10 of 48 locations saw a median reduction in incidence of greater than or equal to an 80% target by 2030). Indicators that provide strong signals in certain epidemic types may not perform consistently well in settings with different epidemiological features. Predicting changes in incidence is more challenging in advanced generalized epidemics compared to concentrated epidemics where changes in high-risk sub-populations track more closely to the population as a whole. Many indicators demonstrate only limited association with incidence (such as "condom use" or "pre-exposure prophylaxis coverage"). This is because many other factors (low effectiveness, impact of other interventions, countervailing changes in risk behaviours, etc.) can confound the relationship between interventions and their ultimate long-term impact, especially for an intervention with low expected coverage. The population prevalence of viral suppression shows the most consistent associations with long-term changes in incidence even in the largest generalized epidemics.
Conclusions: Target setting should be appropriate for the local epidemic and what can feasibly be achieved. There is no one universally reliable indicator to predict future HIV incidence across settings. Thus, the signature of epidemic control must contain indications of success across a wide range of interventions and outcomes.
Keywords: HIV Infections; epidemiology; forecasting; models; population surveillance; programme evaluation; theoretical.
© 2018 The Authors. Journal of the International AIDS Society published by John Wiley & Sons Ltd on behalf of the International AIDS Society.
Figures
Similar articles
-
A sub-national HIV epidemic appraisal in Kenya: a new approach for identifying priority geographies, populations and programmes for optimizing coverage for HIV prevention.J Int AIDS Soc. 2024 Jul;27 Suppl 2(Suppl 2):e26245. doi: 10.1002/jia2.26245. J Int AIDS Soc. 2024. PMID: 38982894 Free PMC article.
-
Epidemic impacts of a community empowerment intervention for HIV prevention among female sex workers in generalized and concentrated epidemics.PLoS One. 2014 Feb 6;9(2):e88047. doi: 10.1371/journal.pone.0088047. eCollection 2014. PLoS One. 2014. PMID: 24516580 Free PMC article.
-
A tale of two countries: progress towards UNAIDS 90-90-90 targets in Botswana and Australia.J Int AIDS Soc. 2018 Mar;21(3):e25090. doi: 10.1002/jia2.25090. J Int AIDS Soc. 2018. PMID: 29508945 Free PMC article.
-
The epidemiology of HIV among men who have sex with men in countries with generalized HIV epidemics.Curr Opin HIV AIDS. 2014 Mar;9(2):156-67. doi: 10.1097/COH.0000000000000037. Curr Opin HIV AIDS. 2014. PMID: 24445371 Review.
-
Global epidemiology of HIV among female sex workers: influence of structural determinants.Lancet. 2015 Jan 3;385(9962):55-71. doi: 10.1016/S0140-6736(14)60931-4. Epub 2014 Jul 22. Lancet. 2015. PMID: 25059947 Free PMC article. Review.
Cited by
-
Infectious Disease Modelling of HIV Prevention Interventions: A Systematic Review and Narrative Synthesis of Compartmental Models.Pharmacoeconomics. 2023 Jun;41(6):693-707. doi: 10.1007/s40273-023-01260-z. Epub 2023 Mar 29. Pharmacoeconomics. 2023. PMID: 36988896 Free PMC article.
References
-
- Joint United Nations Programme on HIV/AIDS (UNAIDS) . Global AIDS Response Progress Reporting 2012: Construction of Core Indicators for monitoring the 2011 Political Declaration On HIV/AIDS. Geneva, Switzerland. 2011 [cited 2018 Oct 30]. Available from :http://files.unaids.org/en/media/unaids/contentassets/documents/document...
-
- President's Emergency Plan for AIDS Relief (PEPFAR) . Next Generation Indicators Reference Guide. V1.1. Washington, DC. 2009 [cited 2018 Oct 30]. Available from: https://www.k4health.org/sites/default/files/PEPFAR%20Next%20Generation%...
-
- Joint United Nations Programme on HIV/AIDS (UNAIDS) . Fast‐Track ‐ Ending the AIDS epidemic by 2030. Geneva, Switzerland. 2014 [cited 2018 Oct 30]. Available from: http://www.unaids.org/sites/default/files/media_asset/JC2686_WAD2014repo...
-
- Futures Institute . Goals Manual A Model for Estimating the Effects of Interventions and Resource Allocation on HIV Infections and Deaths. Glastonbury. 2011 [cited 2018 Oct 30]. Available from: http://www.avenirhealth.org/Download/Spectrum/Manuals/Goals_Manual_Augus...
-
- World Health Organization (WHO) . Consolidated strategic information guidelines for HIV in the health sector. Geneva, Switzerland. 2015 [cited 2018 Oct 30]. Available from: http://apps.who.int/iris/bitstream/10665/164716/1/9789241508759_eng.pdf?... - PubMed
Publication types
MeSH terms
Grants and funding
LinkOut - more resources
Full Text Sources
Medical
