. 2018 Nov 27;25(9):2591-2604.e8.
doi: 10.1016/j.celrep.2018.10.101.

Microtubule-Based Control of Motor-Clutch System Mechanics in Glioma Cell Migration

Affiliations

Microtubule-Based Control of Motor-Clutch System Mechanics in Glioma Cell Migration

Louis S Prahl et al. Cell Rep. .

Abstract

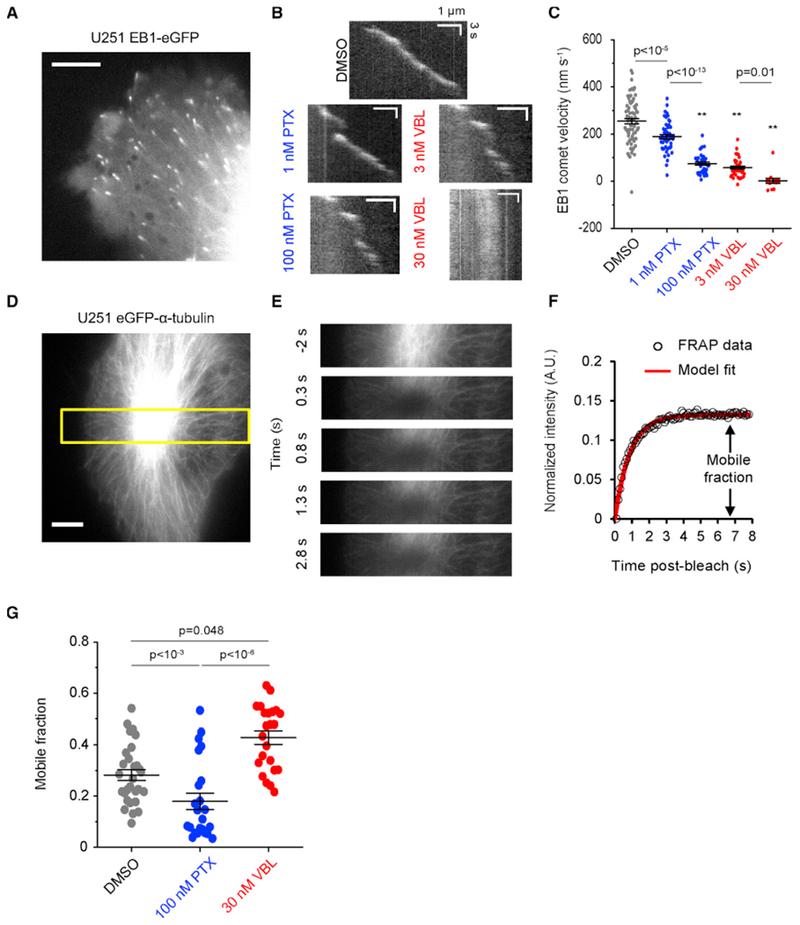
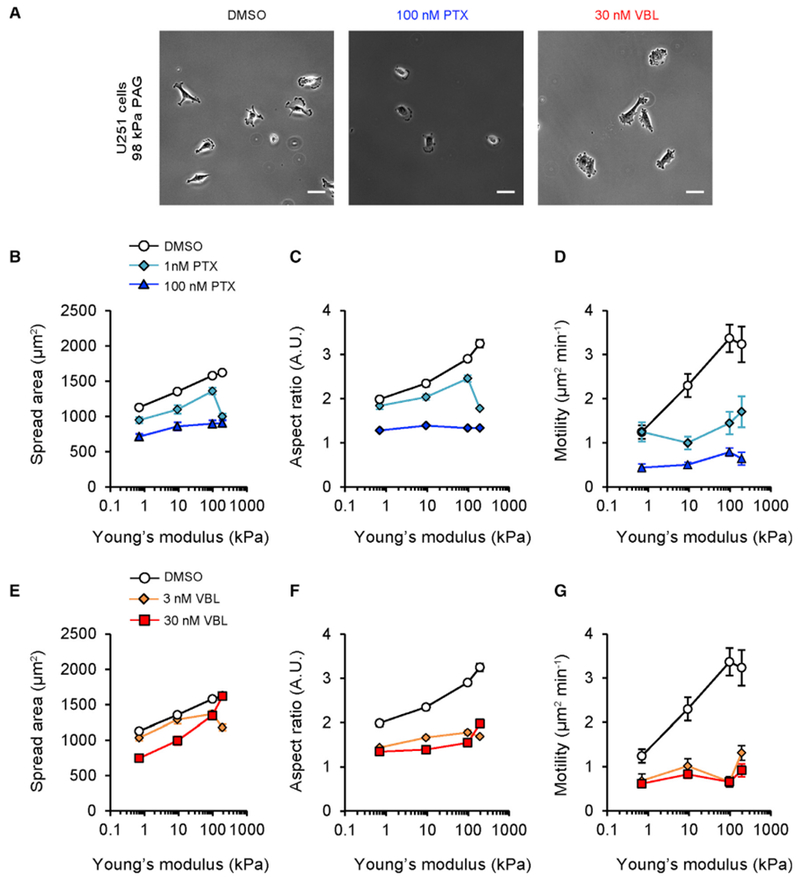
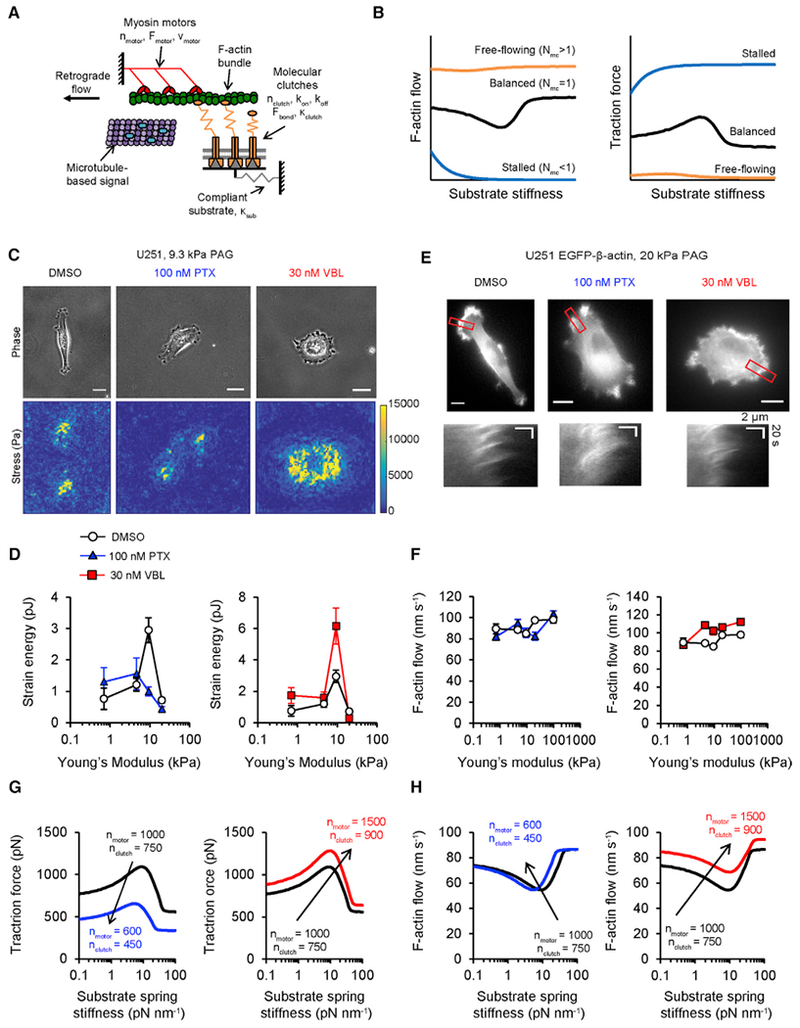
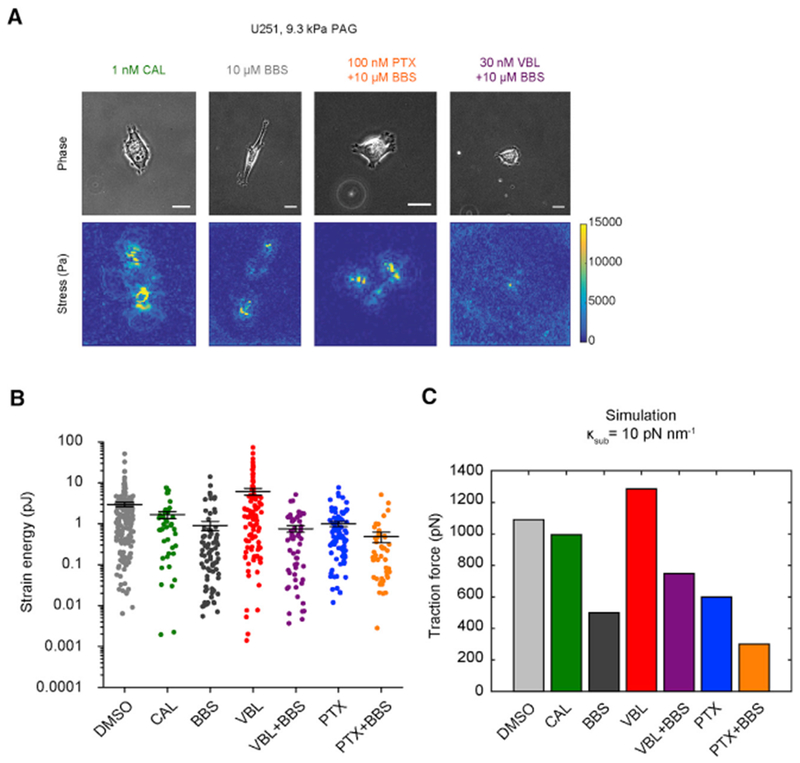
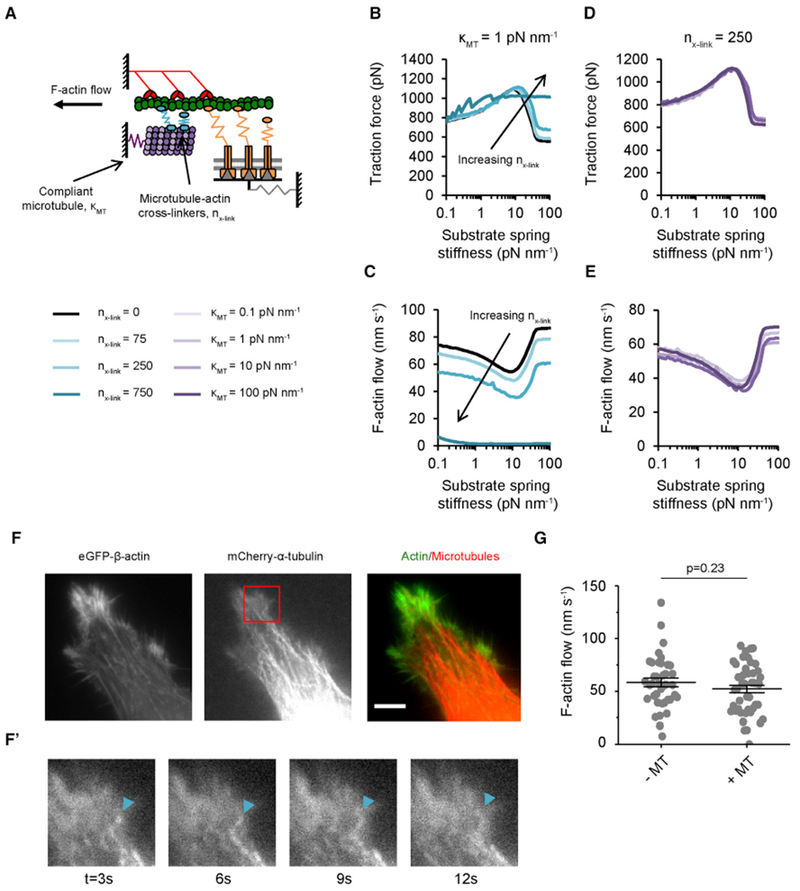
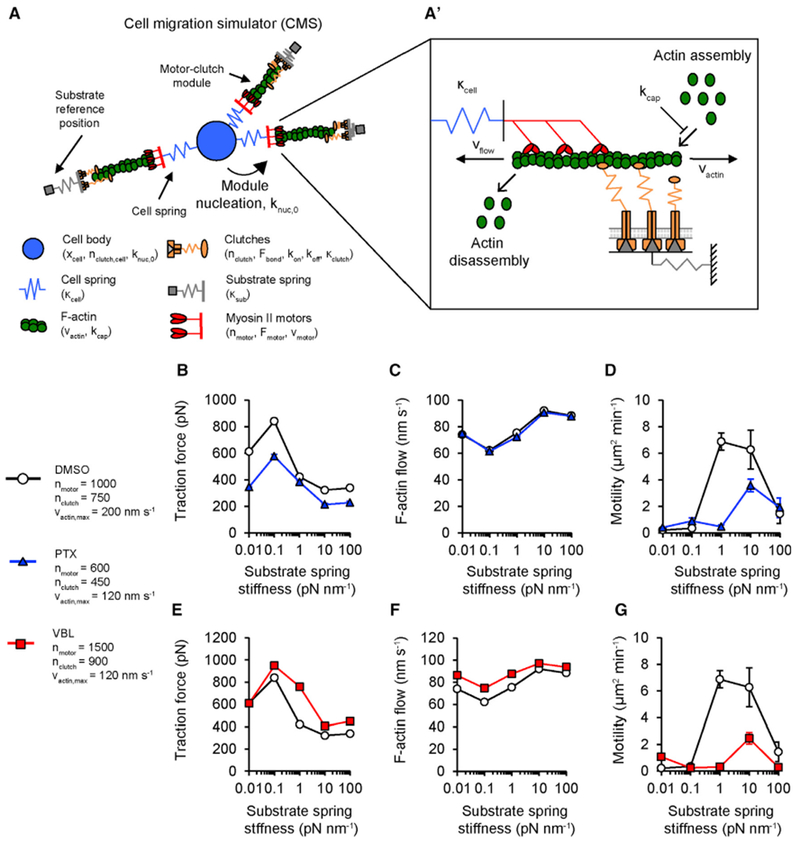
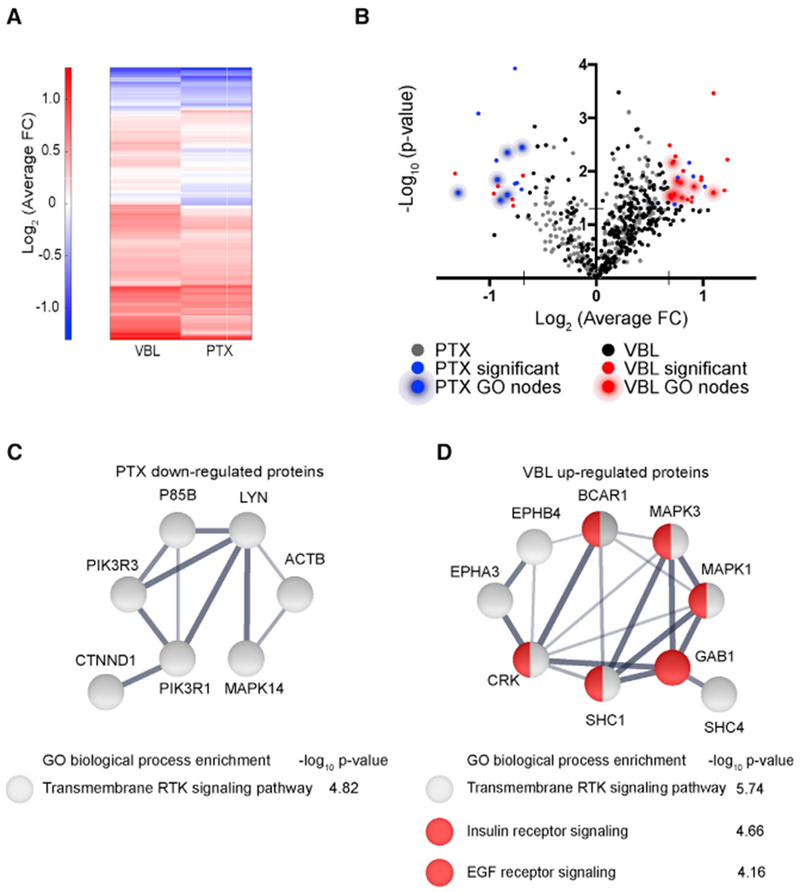
Microtubule-targeting agents (MTAs) are widely used chemotherapy drugs capable of disrupting microtubule-dependent cellular functions, such as division and migration. We show that two clinically approved MTAs, paclitaxel and vinblastine, each suppress stiffness-sensitive migration and polarization characteristic of human glioma cells on compliant hydrogels. MTAs influence microtubule dynamics and cell traction forces by nearly opposite mechanisms, the latter of which can be explained by a combination of changes in myosin motor and adhesion clutch number. Our results support a microtubule-dependent signaling-based model for controlling traction forces through a motor-clutch mechanism, rather than microtubules directly relieving tension within F-actin and adhesions. Computational simulations of cell migration suggest that increasing protrusion number also impairs stiffness-sensitive migration, consistent with experimental MTA effects. These results provide a theoretical basis for the role of microtubules and mechanisms of MTAs in controlling cell migration.

Keywords: actin; cell migration; computational modeling; cytoskeletal crosstalk; mechanotransduction; microtubule; microtubule-targeting agent; paclitaxel; receptor tyrosine kinase; vinblastine.


Conflict of interest statement

DECLARATION OF INTERESTS

The authors declare no competing interests.

Figures

Figure 1.
Figure 1.. MTA Treatments that Kinetically Stabilize Microtubules Have Divergent Effects on Microtubule Assembly
(A) Image of a U251 cell expressing EB1-eGFP acquired at 150× magnification. Scale, 5 μm. (B) Kymographs of EB1-eGFP in vehicle or MTA-treated cells. Horizontal scale, 1 μm; vertical scale, 3 s. (C) Measured EB1-eGFP comet velocities for the conditions in (B). Error bar sare mean ± SEM, n = 71, 49, 36, 37, 14 microtubules from N = 15, 8, 12, 9, 10 cells. p values were calculated by 1-way ANOVA with Dunn-Sidăk correction; **p < 10−15. Negative comet velocities indicate net negative transport during tracking due to assembly punctuated by brief shortening intervals or slow drift of kinetically stabilized plus-ends. (D) Image of a U251 cell expressing eGFP-α-tubulin acquired at 100× magnification. Scale, 5 μm. (E) Time sequence of images from the yellow box in (D). Bleaching occurs between T = −0.3 s and T = 0 s. (F) Normalized fluorescence recovery from the experiment in (D) and (E). Open circles are individual measurements; line is an exponential fit to recovered signal. (G) Quantification of tubulin mobile fraction in cells treated with vehicle or MTAs. Error bars are mean ± SEM, n = 29, 23, 23 cells. p values were calculated by Kruskal-Wallis test with Dunn-Sidăk correction.
Figure 2.
Figure 2.. MTAs Disrupt Stiffness-Sensitive Glioma Cell Spreading, Polarization, and Migration
(A) Images of U251 cells on 98 kPa PAGs acquired at 10× magnification using phase contrast optics. Cells were treated with vehicle (DMSO), 100 nM PTX, or 30 nM VBL. Scale, 50 μm. (B–D) Spread area (B), aspect ratio (C), or motility (D) as a function of PAG Young’s modulus for U251 cells treated with vehicle (DMSO) or 1–100 nM PTX; DMSO: n = 130, 107, 137, 72 cells; 1 nM PTX: n = 51, 74, 53, 41 cells; 100 nM PTX: n = 83, 94, 91, 37 cells. (E–G) Spread area (E), aspect ratio (F), or motility (G) as a function of PAG Young’s modulus for U251 cells treated with vehicle (DMSO) or 3–30 nM VBL. Vehicle (DMSO) data are reproduced from (B)–(D); 3 nM VBL: n = 47, 62, 54, 43 cells; 30 nM VBL: n = 78, 119, 99, 45 cells. Data are represented as mean ± SEM; pairwise statistical comparisons are reported in Table S1.
Figure 3.
Figure 3.. MTAs Have Divergent Effects on Traction Strain Energy and F-Actin Flow Speed, Consistent with Motor-Clutch Model Predictions
(A) Motor-clutch model schematic that includes putative signaling role of microtubules. Myosin II motors (red) cause retrograde flow in an F-actin bundle (green). Molecular clutches (orange) connect F-actin to a compliant substrate (gray). Microtubules (purple) transport signaling factors (cyan) that regulate components of the motor-clutch system. (B) Motor-clutch model predictions of traction force and F-actin flow sped for balanced (Nmc = 1), free-flowing (Nmc > 1), and stalled (Nmc < 1) simulations. (C) Phase images (top row) of U251 cells on 9.3 kPa PAGs containing 0.2 μm fluorescent microspheres acquired at 60× magnification. Cells were treated with vehicle (DMSO), 100 nM PTX, or 30 nM VBL. Traction stress (bottom row) is calculated for each cell using a previously described method (Bangasser et al., 2017; Butler et al., 2002). Scale, 20 μm. (D) Strain energy measured on 0.7–20 kPa PAGs for the conditions in (C). DMSO measurements are repeated in both plots; DMSO: n = 47, 103, 184, 87 cells; 100 nM PTX: n = 38, 47, 84, 53 cells; 30 nM VBL: n = 35, 79, 100, 59 cells. Data are represented as mean ± SEM; pairwise statistical comparisons are reported in Table S1. (E) U251 cells expressing eGFP-α-actin on 20 kPa PAGs (top row) acquired at 60× magnification. Treatment conditions are the same as those used in (C). Kymographs (bottom row) of F-actin flow acquired on the locations marked in the corresponding image. Scale, 10 μm. (F) F-actin flow measured on 0.7–195 kPa PAGs for the conditions in (E). DMSO measurements are repeated in both plots; DMSO: n = 33, 29, 36, 31, 25 cells; 100 nM PTX: n = 23, 27, 25, 30, 17 cells; 30 nM VBL: n = 16, 19, 20, 21, 20 cells. Data are represented as mean ± SEM, pairwise statistical comparisons are reported in Table S1. (G) Motor-clutch model predictions of traction force for parameter sets representing DMSO (black), PTX(blue), or VBL(red) treatments. DMSO output is repeated in both plots as a reference. (H) Motor-clutch model predictions of F-actin flow for the parameter sets in (G). DMSO output is repeated in both plots as a reference. Other simulation parameters are in Methods S1.
Figure 4.
Figure 4.. Motor-Clutch Model Predicts Traction Forces of U251 Cells Treated with MTAs or Drugs Targeting Myosin II Activity
(A) Phase contrast images (top row) of U251 cells on 9.3 kPa PAGs containing 0.2 μm fluorescent microspheres acquired at 60× magnification. Conditions shown are 1 nM CAL, 10 μM BBS, 30 nM VBL, and 10 μM BBS, and 100 nM PTX and 10 μM BBS. Scale, 20 μm. Traction stress (bottom row) plots for each cell are obtained like in Figure 3C. (B) Strain energy measurements on 9.3 kPa PAGs for cells treated with DMSO, 1 nM CAL, 10 μM BBS, 30 nM VBL, 30 nM VBL, and 10 μM BBS, 100 nM PTX, or 100 nM PTX and 10 μM BBS. Bars are mean ± SEM; n = 184, 43, 81, 100, 54, 84, 45 cells; pairwise statistics are reported in Table S3. Vehicle (DMSO), 30 nM VBL, and 100 nM PTX measurements are reproduced from the 9.3 kPa data in Figure 3D. (C) Motor-clutch model-predicted traction force for simulations run at κsub = 10 pN nm−1. Values of nmotor/nclutch for each condition: DMSO – 1,000/750; CAL – 3,000/750; BBS – 250/750; VBL – 1,500/900; VBL+BBS – 375/900; PTX – 600/450; PTX+BBS – 150/450. Other simulation parameters are in STAR Methods.
Figure 5.
Figure 5.. Mechanical Reinforcement Model Predictions and Observations of Microtubule-F-Actin Mechanical Interaction in Glioma Cells
(A) Motor-clutch model schematic that incorporates a hypothetical mechanical interaction between microtubules and F-actin. A compliant microtubule bundle (purple) binds the F-actin bundle through dynamic cross-linkers (cyan) that function as clutches. Forces on the microtubule and substrate both resist the total myosin II motor force of the cell. (B and C) Model-predicted traction force (B) and F-actin flow (C) when nx-link is varied as an independent parameter and κMT = 1 pN nm−1. Black represents a reference condition when nx-link = 0, cyan lines represent nx-link = 75, 250, and 750. (D and E) Model-predicted traction force (D) and F-actin flow (E) when κMT is varied as an independent parameter and nx-link = 250. Purple lines represent κMT = 0.1–100 pN nm−1. Other simulation parameters are in STAR Methods. (F and F’) Images of a U251 cell expressing GFP-β-actin (green) and mCherry-α-tubulin (red) acquired at 100× magnification. Scale, 5 μm. Inset from the red box in (F) shows a microtubule plus-end bending at the periphery, indicating it is subject to compressive forces (Bicek et al., 2009; Brangwynne et al., 2006). (G) F-actin flow speed in regions where actin flow coincided with microtubule polymer (+MT) compared to regions where no microtubule was present (−MT). Error bars are mean ± SEM, data are pooled from n = 24 cells, two biological replicates, Mann-Whitney U test.
Figure 6.
Figure 6.. Stiffness-Sensitive Simulated Cell Migration Is Sensitive to Changes in Actin Polymerization and Nucleation Rates
(A and A’) Schematic for a CMS as previously described in Bangasser et al. (2017) and Klank et al. (2017). Individual protrusion modules function as copies of the motor-clutch model described in Chan and Odde (2008) and connect to a central cell body/nucleus through cell springs (blue). New modules are nucleated at a rate (knuc) that scales with the available G-actin pool. Modules extend through actin polymerization (Vactin) that scales a maximal polymerization velocity (Vactin,max) by the available G-actin pool. Modules shorten by F-actin retrograde flow (vflow), which is governed by clutch dynamics. Module capping (kcap) stochastically terminates actin polymerization to facilitate module turnover and cell polarization. (B–D) CMS predictions of traction force (B), F-actin flow (C), and motility (D) for a reference parameter set representing DMSO (white circles; n = 14, 8, 36, 48, 24 runs) or a PTX parameter set (blue triangles; n = 8, 16, 16, 28, 12 runs). (E–G) CMS predictions of traction force (E), F-actin flow (F), and motility (G) for reference parameters (repeated from B–D) or a VBL parameter set (red squares; n = 4, 8, 20, 24, 12 runs). Reference parameter results are repeated from (B) to (D). Reference parameter simulation data are the same as that used in Figures S5 and S6. For other parameters, see Methods S1. Data are represented as mean ± SEM, pairwise statistical comparisons between test groups and reference conditions are reported in Table S3.
Figure 7.
Figure 7.. Quantitative Analysis of pY-Mediated Signaling Pathways in MTA-Treated Cells
(A) Heatmap of log2-transformed average fold change (FC) for 311 pY sites identified by LC/MS-MS in cells treated with either 100 nM PTX or 30 nM VBL. Average FC of N = 3 biological replicates for each condition are normalized to the mean of 4 DMSO samples, log2-transformed, and organized by hierarchical clustering. (B) Volcano plot depicting −log10(p value) calculated using Student’s t test versus log2(average FC) for individual pY peptides. PTX (blue) and VBL (red) nodes are significant at p < 0.05 and ± 1.6FC. (C) String network of significantly downregulated proteins in PTX-treated cells, along with associated GO terms, and false discovery rate (FDR)-corrected p value. (D) String network of significantly up regulated proteins in VBL-treated cells, along with associated GO terms, and FDR-corrected p value. Unconnected nodes or nodes not involved in GO pathways are not depicted in (C) and (D). Line thickness indicates strength of data support from the String Consortium (Szklarczyk et al., 2015). Red nodes are associated with both insulin receptor signaling and EGF receptor signaling.

Similar articles

Cited by

References

    1. Bangasser BL, Rosenfeld SS, and Odde DJ (2013). Determinants of maximal force transmission in a motor-clutch model of cell traction in a compliant microenvironment. Biophys. J 705, 581–592. - PMC - PubMed
    1. Bangasser BL, Shamsan GA, Chan CE, Opoku KN, TJzel E, Schlichtmann BW, Kasim JA, Fuller BJ, McCullough BR, Rosenfeld SS, and Odde DJ (2017). Shifting the optimal stiffness for cell migration. Nat. Commun 8, 15313. - PMC - PubMed
    1. Belotti D, Rieppi M, Nicoletti MI, Casazza AM, Fojo T, Taraboletti G, and Giavazzi R (1996). Paclitaxel (Taxol(R)) inhibits motility of paclitaxel-resistant human ovarian carcinoma cells. Clin. Cancer Res 2, 1725–1730. - PubMed
    1. Berges R, Baeza-Kallee N, Tabouret E, Chinot O, Petit M, Kruczynski A, Figarella-Branger D, Honore S, and Braguer D (2014). End-binding 1 protein overexpression correlates with glioblastoma progression and sensitizes to Vinca-alkaloids in vitro and in vivo. Oncotarget 5, 12769–12787. - PMC - PubMed
    1. Bergès R, Tchoghandjian A, Honoré S, Estève M-A, Figarella-Branger D, Bachmann F, Lane HA, and Braguer D (2016). The novel tubulin-binding checkpoint activator BAL101553 inhibits EB1-dependent migration and invasion and promotes differentiation of glioblastoma stem-like cells. Mol. Cancer Ther 75, 2740–2749. - PubMed

Publication types

LinkOut - more resources