

Integrated Genomic, Epigenomic, and Expression Analyses of Ovarian Cancer Cell Lines
- PMID: 30485824
- PMCID: PMC6481945
- DOI: 10.1016/j.celrep.2018.10.096
Integrated Genomic, Epigenomic, and Expression Analyses of Ovarian Cancer Cell Lines
Abstract
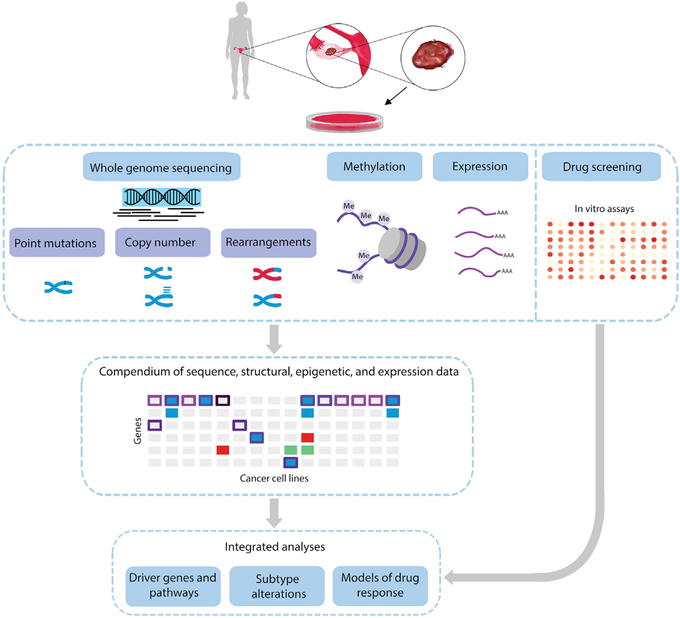
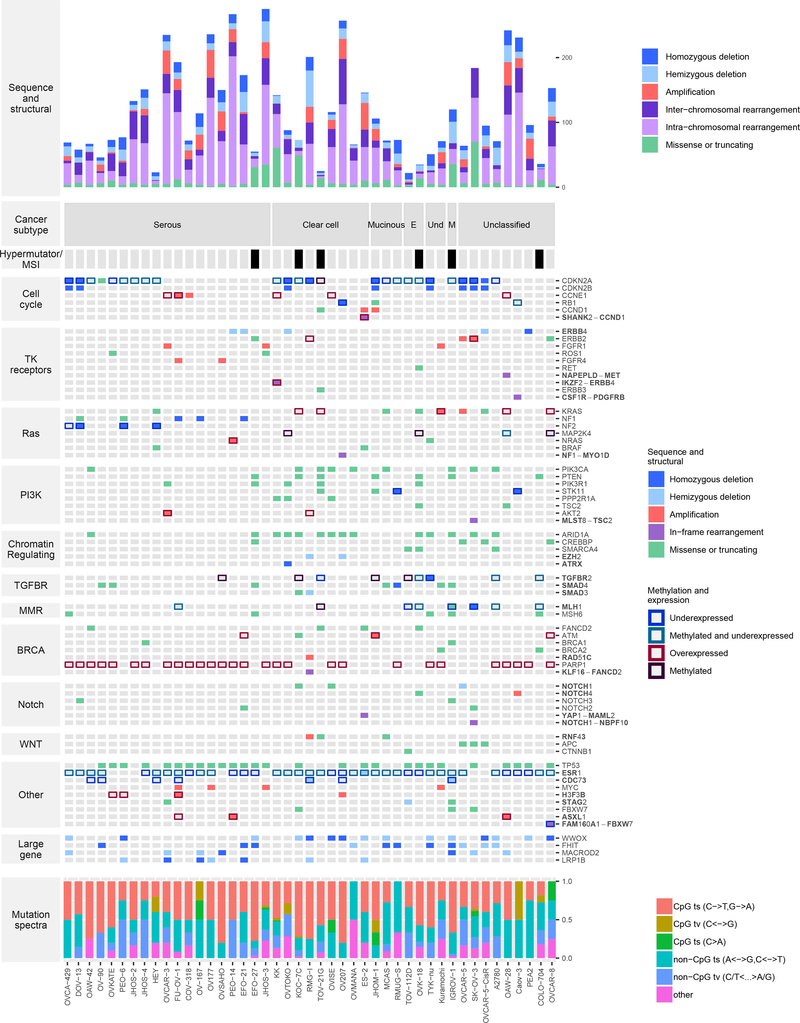
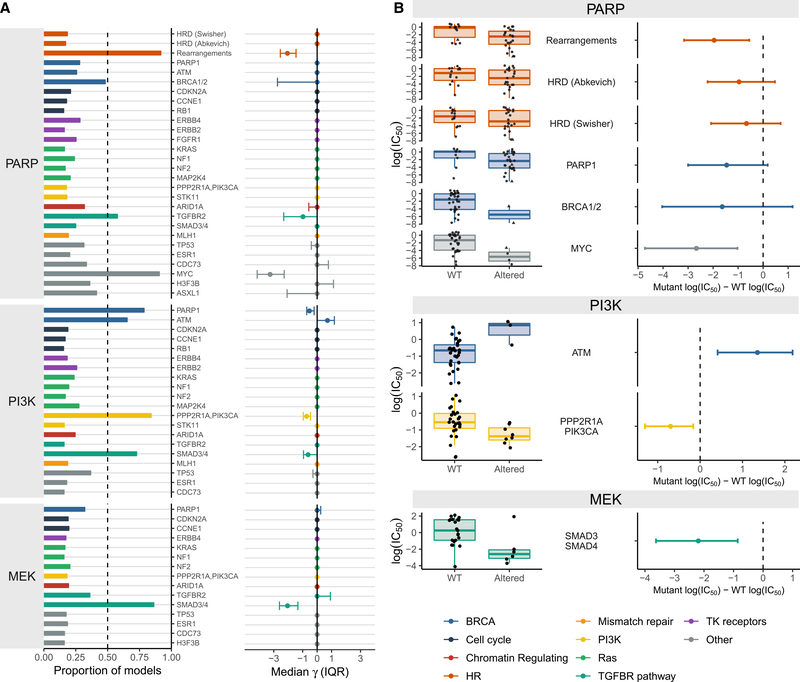
To improve our understanding of ovarian cancer, we performed genome-wide analyses of 45 ovarian cancer cell lines. Given the challenges of genomic analyses of tumors without matched normal samples, we developed approaches for detection of somatic sequence and structural changes and integrated these with epigenetic and expression alterations. Alterations not previously implicated in ovarian cancer included amplification or overexpression of ASXL1 and H3F3B, deletion or underexpression of CDC73 and TGF-beta receptor pathway members, and rearrangements of YAP1-MAML2 and IKZF2-ERBB4. Dose-response analyses to targeted therapies revealed unique molecular dependencies, including increased sensitivity of tumors with PIK3CA and PPP2R1A alterations to PI3K inhibitor GNE-493, MYC amplifications to PARP inhibitor BMN673, and SMAD3/4 alterations to MEK inhibitor MEK162. Genome-wide rearrangements provided an improved measure of sensitivity to PARP inhibition. This study provides a comprehensive and broadly accessible resource of molecular information for the development of therapeutic avenues in ovarian cancer.
Keywords: cancer cell lines; cancer genomics; drug response; gene fusions; ovarian cancer; structural variants.
Copyright © 2018 The Authors. Published by Elsevier Inc. All rights reserved.
Figures
Similar articles
-
Combined inhibition of PI3K and PARP is effective in the treatment of ovarian cancer cells with wild-type PIK3CA genes.Gynecol Oncol. 2016 Sep;142(3):548-56. doi: 10.1016/j.ygyno.2016.07.092. Epub 2016 Jul 15. Gynecol Oncol. 2016. PMID: 27426307 Free PMC article.
-
Genomic and Epigenomic Signatures in Ovarian Cancer Associated with Resensitization to Platinum Drugs.Cancer Res. 2018 Feb 1;78(3):631-644. doi: 10.1158/0008-5472.CAN-17-1492. Epub 2017 Dec 11. Cancer Res. 2018. PMID: 29229600 Free PMC article.
-
Epigenetic silencing of HSulf-1 in ovarian cancer:implications in chemoresistance.Oncogene. 2007 Jul 26;26(34):4969-78. doi: 10.1038/sj.onc.1210300. Epub 2007 Feb 19. Oncogene. 2007. PMID: 17310998
-
Epigenetic Pathways Offer Targets for Ovarian Cancer Treatment.Clin Breast Cancer. 2018 Jun;18(3):189-191. doi: 10.1016/j.clbc.2017.09.009. Epub 2017 Sep 19. Clin Breast Cancer. 2018. PMID: 29042129 Review. No abstract available.
-
Epigenetics in ovarian cancer.Methods Mol Biol. 2012;863:253-69. doi: 10.1007/978-1-61779-612-8_15. Methods Mol Biol. 2012. PMID: 22359298 Review.
Cited by
-
Clinical utility of comprehensive genomic profiling in central nervous system tumors of children and young adults.Neurooncol Adv. 2021 Feb 25;3(1):vdab037. doi: 10.1093/noajnl/vdab037. eCollection 2021 Jan-Dec. Neurooncol Adv. 2021. PMID: 33948563 Free PMC article.
-
Application of Ovarian Cancer Organoids in Precision Medicine: Key Challenges and Current Opportunities.Front Cell Dev Biol. 2021 Aug 2;9:701429. doi: 10.3389/fcell.2021.701429. eCollection 2021. Front Cell Dev Biol. 2021. PMID: 34409036 Free PMC article. Review.
-
Leveraging Genomics, Transcriptomics, and Epigenomics to Understand the Biology and Chemoresistance of Ovarian Cancer.Cancers (Basel). 2021 Aug 10;13(16):4029. doi: 10.3390/cancers13164029. Cancers (Basel). 2021. PMID: 34439181 Free PMC article. Review.
-
Epigenetic Modifier SETD8 as a Therapeutic Target for High-Grade Serous Ovarian Cancer.Biomolecules. 2020 Dec 16;10(12):1686. doi: 10.3390/biom10121686. Biomolecules. 2020. PMID: 33339442 Free PMC article.
-
Genomic profiling of a multi-lineage and multi-passage patient-derived xenograft biobank reflects heterogeneity of ovarian cancer.Cell Rep Med. 2024 Jul 16;5(7):101631. doi: 10.1016/j.xcrm.2024.101631. Epub 2024 Jul 9. Cell Rep Med. 2024. PMID: 38986623 Free PMC article.
References
-
- Akhoondi S, Sun D, von der Lehr N, Apostolidou S, Klotz K, Maljukova A, Cepeda D, Fiegl H, Dafou D, Marth C, et al. (2007). FBXW7/hCDC4 is a general tumor suppressor in human cancer. Cancer Res. 67, 9006–9012. - PubMed
-
- Alexandrov LB, Nik-Zainal S, Wedge DC, Aparicio SAJR, Behjati S, Biankin AV, Bignell GR, Bolli N, Borg A, B0rresen-Dale A-L, et al.; Australian Pancreatic Cancer Genome Initiative; ICGC Breast Cancer Consortium; ICGC MMML-Seq Consortium; ICGC PedBrain (2013). Signatures of mutational processes in human cancer. Nature 500, 415–421. - PMC - PubMed
Publication types
MeSH terms
Substances
Grants and funding
LinkOut - more resources
Full Text Sources
Medical
Research Materials
Miscellaneous
