. 2018 Nov 27;8(4):59.
doi: 10.3390/life8040059.

How do Nucleotides Adsorb Onto Clays?

Affiliations

How do Nucleotides Adsorb Onto Clays?

Ulysse Pedreira-Segade et al. Life (Basel). .

Abstract

Adsorption of prebiotic building blocks is proposed to have played a role in the emergence of life on Earth. The experimental and theoretical study of this phenomenon should be guided by our knowledge of the geochemistry of the habitable early Earth environments, which could have spanned a large range of settings. Adsorption being an interfacial phenomenon, experiments can be built around the minerals that probably exhibited the largest specific surface areas and were the most abundant, i.e., phyllosilicates. Our current work aims at understanding how nucleotides, the building blocks of RNA and DNA, might have interacted with phyllosilicates under various physico-chemical conditions. We carried out and refined batch adsorption studies to explore parameters such as temperature, pH, salinity, etc. We built a comprehensive, generalized model of the adsorption mechanisms of nucleotides onto phyllosilicate particles, mainly governed by phosphate reactivity. More recently, we used surface chemistry and geochemistry techniques, such as vibrational spectroscopy, low pressure gas adsorption, X-ray microscopy, and theoretical simulations, in order to acquire direct data on the adsorption configurations and localization of nucleotides on mineral surfaces. Although some of these techniques proved to be challenging, questioning our ability to easily detect biosignatures, they confirmed and complemented our pre-established model.

Keywords: adsorption; geochemistry; origins of life; phyllosilicates; surface chemistry.


Conflict of interest statement

The authors declare no conflict of interest. The funders had no role in the design of the study; in the collection, analyses, or interpretation of data; in the writing of the manuscript; or in the decision to publish the results.

Figures

Figure 1
Figure 1
Batch adsorption method. Homogeneous suspensions or powders of minerals (a) are mixed with a nucleotide solution at a fixed temperature, pressure, pH, and solution chemistry (b). Samples are vortexed for 30 s and left to stand in the dark for 24 h. After equilibrium, they are centrifuged at 16,100 g for 25 min (c), and initial and equilibrium concentrations of nucleotides are measured with UV/vis spectrophotometry (d). See references [36,37,38] for more details on the preparation and characterization of homogeneous mineral samples. Adapted from [39].
Figure 2
Figure 2
Structure of phyllosilicates: (a) Atomic arrangement of layers for various phyllosilicate structures; (b) ordering of phyllosilicate particles from smaller to larger scales. Adapted from [39].
Figure 3
Figure 3
Structure ribonucleotides (NMP), deoxyribonucleotides (dNMP), and their nucleobases (R). The pKa of all nucleotides is also presented. Adapted from [37] with permission from Elsevier.
Figure 4
Figure 4
Illustration of the processing of adsorption isotherms: (a) Adsorption isotherms of all nucleotides on the same nontronite sample (Nau1); (b) same isotherms normalized to the solubility of nucleotides. Notice that all isotherms become similar and that differential adsorption vanishes; (c) adsorption isotherms of dGMP on three swelling clays (nontronites NAu1 & NAu2 and montmorillonite SWy2) and three non-swelling phyllosilicates (pyrophyllite (Pyr), chlorite (Chl), and lizardite (Liz)); (d) adsorption densities derived from the adsorption isotherms presented in the previous panel, normalized to the lateral specific surface area of the studied minerals. Adapted from [37] with permission from Elsevier.
Figure 5
Figure 5
Adsorption mechanisms of nucleotides on swelling and non-swelling phyllosilicates illustrated under varying pH conditions and salinity. Blue circles represent divalent cations. Grey circles represent molecular anions. Green phase on the swelling clay surface at pH 11 represents the precipitation of metal-hydroxyls of low solubility (transition metals such as Zn2+). Adapted from [38] with permission from the PCCP Owner Societies.
Figure 6
Figure 6
Derivative adsorption isotherms of the nontronite NAu2. (a) Raw sample; (b) sample dried in a seawater analog solution; (c) sample dried after the adsorption of dGMP in a seawater analog solution. Blue: Experimental data; Green: Basal domains; Red: Edge domains; Orange (doted): DIS fitting.
Figure 7
Figure 7
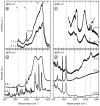
Visible and UV Raman spectra of dry deoxyguanosine monophosphate—dGMP (a,b), and dGMP adsorbed on the surface of chlorite (c,d). The spectrum displayed in grey (d) corresponds to the reference spectrum of chlorite without dGMP. * points to the stretching vibration of atmospheric O2 at 1536 cm−1. The dashed lines locate the characteristic bands of the breathing modes of aromatic/heterocyclic groups within the tholins (A1 and A2) and the bands observed for disordered carbonaceous materials (D and G).
Figure 8
Figure 8
Fluorescence maps 6 × 3 µm2 measured at 2300 eV on a dried pyrophyllite sample saturated with dGMP.
Figure 9
Figure 9
STXM images and XANES spectra of a dried nontronite sample saturated with dGMP. Images below (a) and above (b) the L-edge of Fe and corresponding XANES spectrum (c). Images and corresponding XANES spectra of an inner region of interest ROI 1 (d,e) and an outer ROI 2 (f,g) of the same nontronite particle saturated with dGMP. (h) XANES reference spectra for nucleotide films, data from [86]. The field of view is 5 × 5 µm2 in images (a,b), and 4 × 1 µm2 in images (d,f).
Figure 10
Figure 10
Left: Evolution of the global charge of GMP in a 0.5 mol/L NaCl solution and state of the GMP molecule with regard to the clay surface. Right: typical configurations of GMP molecules. Yellow: Si, pink: Al, red: O, white: H, cyan: C, orange: N, kaki: P, Blue: Na, Magenta: Cl.
Figure 11
Figure 11
Left: Evolution of the global charge of GMP in a 0.25 mol/L CaCl2 solution and state of the GMP molecule with regard to the clay surface. Right: typical configurations of GMP molecules. Yellow: Si, pink: Al, red: O, white: H, cyan: C, orange: N, kaki: P, Green: Ca, Magenta: Cl.

Similar articles

Cited by

References

    1. Poulet F., Bibring J.-P., Mustard J.F., Gendrin A., Mangold N., Langevin Y., Arvidson R.E., Gondet B., Gomez C., Team T.O. Phyllosilicates on Mars and implications for early Martian climate. Nature. 2005;438:623. doi: 10.1038/nature04274. - DOI - PubMed
    1. Ehlmann B.L., Mustard J.F., Murchie S.L., Bibring J.P., Meunier A., Fraeman A.A., Langevin Y. Subsurface water and clay mineral formation during the early history of Mars. Nature. 2011;479:53–60. doi: 10.1038/nature10582. - DOI - PubMed
    1. Hazen R.M., Sverjensky D.A., Azzolini D., Bish D.L., Elmore S.C., Hinnov L., Milliken R.E. Clay mineral evolution. Am. Mineral. 2013;98:2007–2029. doi: 10.2138/am.2013.4425. - DOI
    1. Giese R.F., Van Oss C.J., Yariv S., Cross H. Organo-Clay Complexes and Interactions. Marcel Dekker; New York, NY, USA: 2002. Organophilicity and hydrophobicity of organo-clays; pp. 175–192.
    1. Bernal J.D. The Physical Basis of Life. Proc. Phys. Soc. Sect. B. 1949;62:598–618. doi: 10.1088/0370-1301/62/11/507. - DOI

LinkOut - more resources