

Hepatic Metabolic Profile Reveals the Adaptive Mechanisms of Ewes to Severe Undernutrition during Late Gestation
- PMID: 30486444
- PMCID: PMC6316483
- DOI: 10.3390/metabo8040085
Hepatic Metabolic Profile Reveals the Adaptive Mechanisms of Ewes to Severe Undernutrition during Late Gestation
Abstract
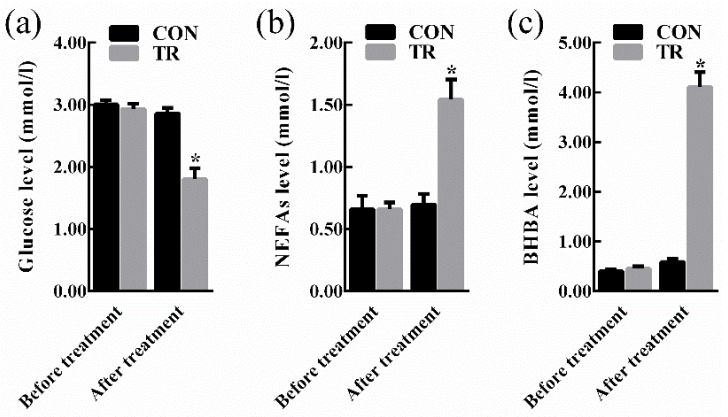
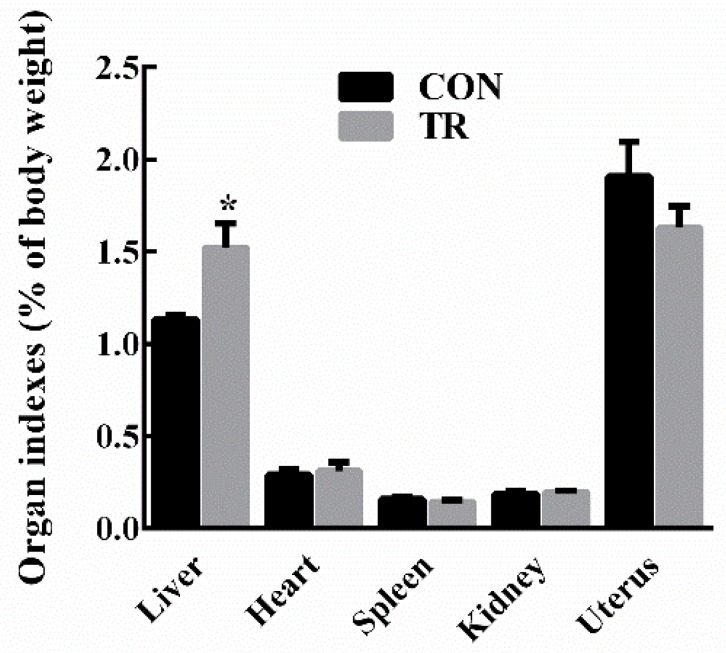
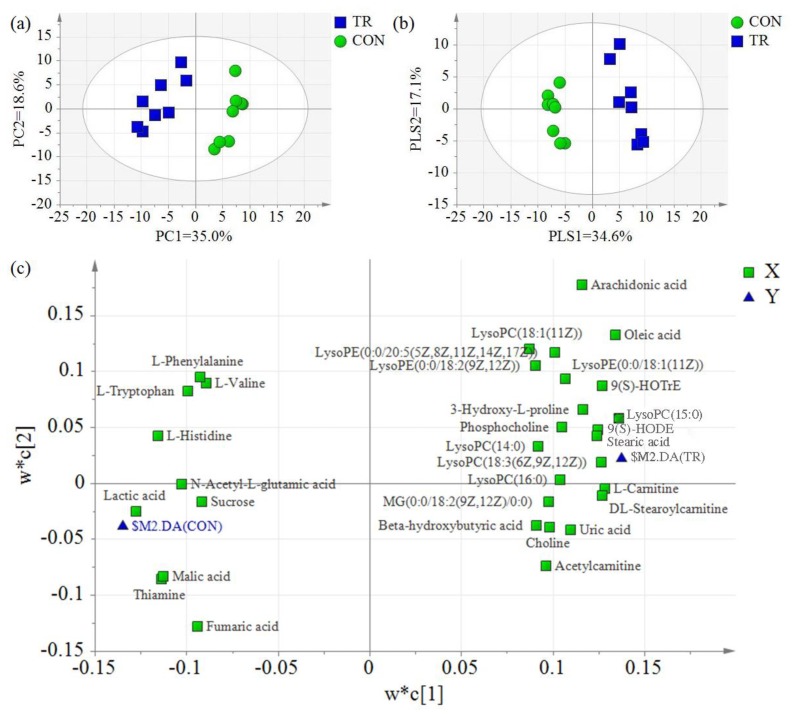
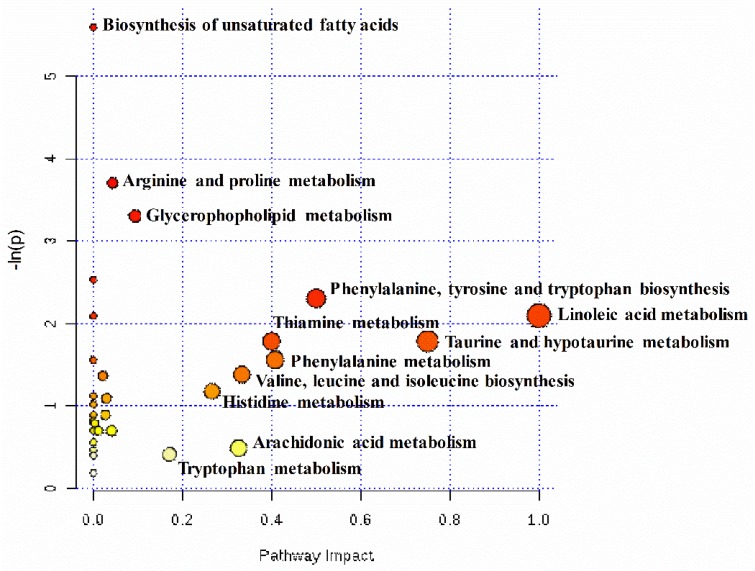
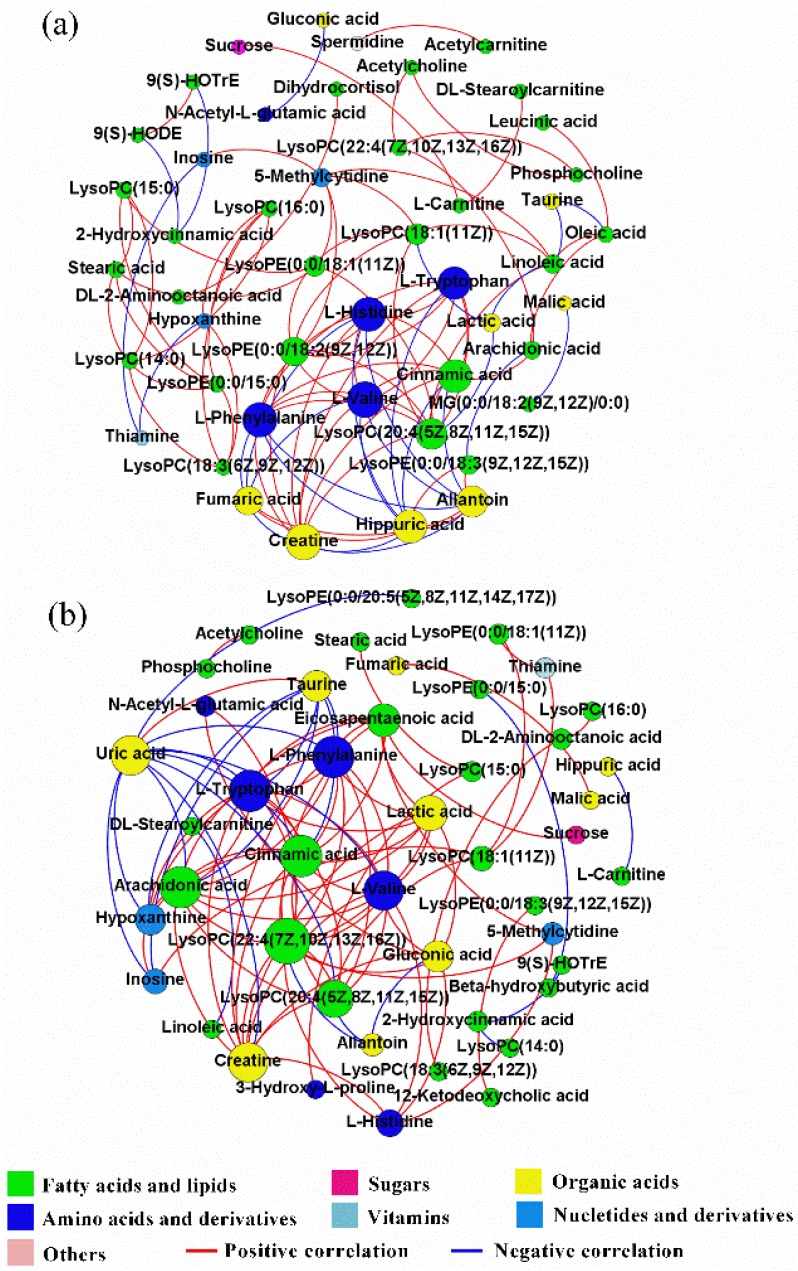
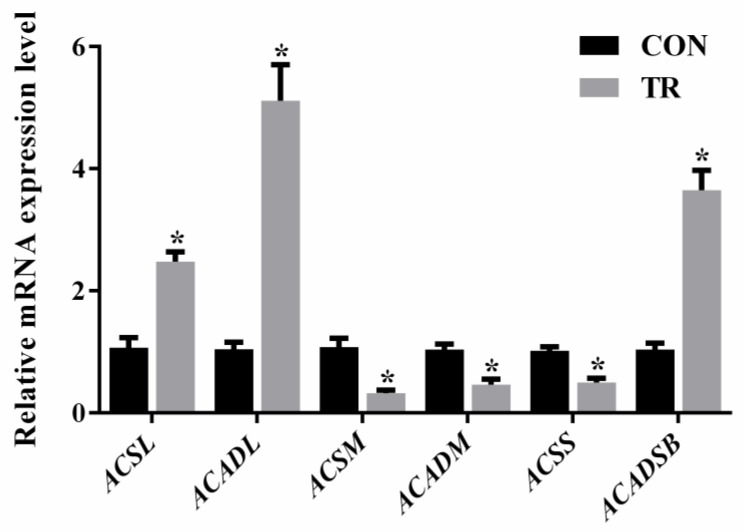
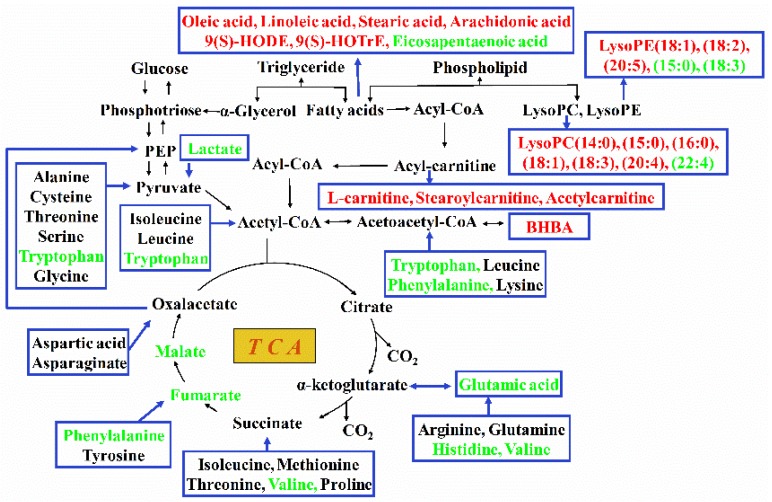
The mechanisms underlying the adaption of liver metabolism to the undernutrition in ewes during late gestation remain unclear. This research aimed to explore the adaptive mechanisms of liver metabolism by hepatic metabolome analysis in pregnant ewes to the negative energy balance induced by severe feed restriction. Twenty ewes carrying multiple fetuses and gestating for 115 days were fed normally or restricted to a 30% feed level (10 ewes in each group) for 15 days. All ewes were sacrificed and hepatic samples were collected and analyzed by liquid chromatography-mass spectrometry. Both the principal components analysis and partial least squares of discriminant analysis of hepatic metabolites showed the clear separation between ewes in the control and severely feed-restricted groups. The metabolic profile demonstrated that the proportions of differential metabolites between the two groups in fatty acids and lipids, organic acids, and amino acids and derivatives were 61.11%, 16.67%, and 11.11%, respectively. Enriched pathways of differential metabolites were mainly involved in fatty acids and amino acids metabolism and biosynthesis. Correlation networks of differential metabolites revealed that general metabolic pattern was changed apparently and mainly based on fatty acids and lipids in the livers of feed-restricted ewes. The accumulation and oxidation of long-chain fatty acids were intensified in the livers of feed-restricted ewes, while those of medium-chain fatty acids were the opposite. In general, severe feed restriction significantly affected the levels of hepatic metabolites and altered the overall metabolic pattern. Furthermore, fatty acids oxidation as well as the utilization of amino acids and organic acids were intensified to adapt to the negative energy balance during late gestation.
Keywords: adaptive mechanisms; amino acid; fatty acid; lipid metabolism; undernutrition.
Conflict of interest statement
The authors declare no conflict of interest.
Figures
Similar articles
-
Pregnancy Toxemia in Ewes: A Review of Molecular Metabolic Mechanisms and Management Strategies.Metabolites. 2023 Jan 18;13(2):149. doi: 10.3390/metabo13020149. Metabolites. 2023. PMID: 36837768 Free PMC article. Review.
-
Maternal undernutrition induces fetal hepatic lipid metabolism disorder and affects the development of fetal liver in a sheep model.FASEB J. 2019 Sep;33(9):9990-10004. doi: 10.1096/fj.201900406R. Epub 2019 Jun 5. FASEB J. 2019. PMID: 31167079
-
Changes in the metabolic profile of pregnant ewes to an acute feed restriction in late gestation.N Z Vet J. 2015 May;63(3):141-6. doi: 10.1080/00480169.2014.971083. Epub 2015 Mar 17. N Z Vet J. 2015. PMID: 25275560 Clinical Trial.
-
Dynamic Changes of Plasma Metabolome in Response to Severe Feed Restriction in Pregnant Ewes.Metabolites. 2019 Jun 10;9(6):112. doi: 10.3390/metabo9060112. Metabolites. 2019. PMID: 31185597 Free PMC article.
-
Endogenous and dietary lipids influencing feed intake and energy metabolism of periparturient dairy cows.Domest Anim Endocrinol. 2016 Jul;56 Suppl:S2-S10. doi: 10.1016/j.domaniend.2015.12.002. Domest Anim Endocrinol. 2016. PMID: 27345317 Review.
Cited by
-
Pregnancy Toxemia in Ewes: A Review of Molecular Metabolic Mechanisms and Management Strategies.Metabolites. 2023 Jan 18;13(2):149. doi: 10.3390/metabo13020149. Metabolites. 2023. PMID: 36837768 Free PMC article. Review.
-
Coordinated response of milk bacterial and metabolic profiles to subacute ruminal acidosis in lactating dairy cows.J Anim Sci Biotechnol. 2023 May 4;14(1):60. doi: 10.1186/s40104-023-00859-8. J Anim Sci Biotechnol. 2023. PMID: 37138330 Free PMC article.
-
Metabolomic Profiling Reveals the Difference on Reproductive Performance between High and Low Lactational Weight Loss Sows.Metabolites. 2019 Dec 4;9(12):295. doi: 10.3390/metabo9120295. Metabolites. 2019. PMID: 31817081 Free PMC article.
-
Proteomic Profiling of Hu Sheep Placental Development Across Gestational Stages Reveals Stage-Specific Regulatory Networks.Int J Mol Sci. 2025 Apr 29;26(9):4236. doi: 10.3390/ijms26094236. Int J Mol Sci. 2025. PMID: 40362472 Free PMC article.
-
Comprehensive Understanding of the Bacterial Populations and Metabolites Profile of Fermented Feed by 16S rRNA Gene Sequencing and Liquid Chromatography-Mass Spectrometry.Metabolites. 2019 Oct 21;9(10):239. doi: 10.3390/metabo9100239. Metabolites. 2019. PMID: 31640120 Free PMC article.
References
-
- Cal-Pereyra L., Acosta-Dibarrat J., Benech A., Silva S.D., Martín A., González-Montańa J.R. Ewe pregnancy toxemia. Rev. Mex. Cienc. Pecu. 2012;3:247–264.
-
- Andrews A. Pregnancy toxemia in ewe. Practice. 1997;19:306–314. doi: 10.1136/inpract.19.6.306. - DOI
Grants and funding
LinkOut - more resources
Full Text Sources
