

Comparative genomics of downy mildews reveals potential adaptations to biotrophy
- PMID: 30486780
- PMCID: PMC6264045
- DOI: 10.1186/s12864-018-5214-8
Comparative genomics of downy mildews reveals potential adaptations to biotrophy
Abstract
Background: Spinach downy mildew caused by the oomycete Peronospora effusa is a significant burden on the expanding spinach production industry, especially for organic farms where synthetic fungicides cannot be deployed to control the pathogen. P. effusa is highly variable and 15 new races have been recognized in the past 30 years.
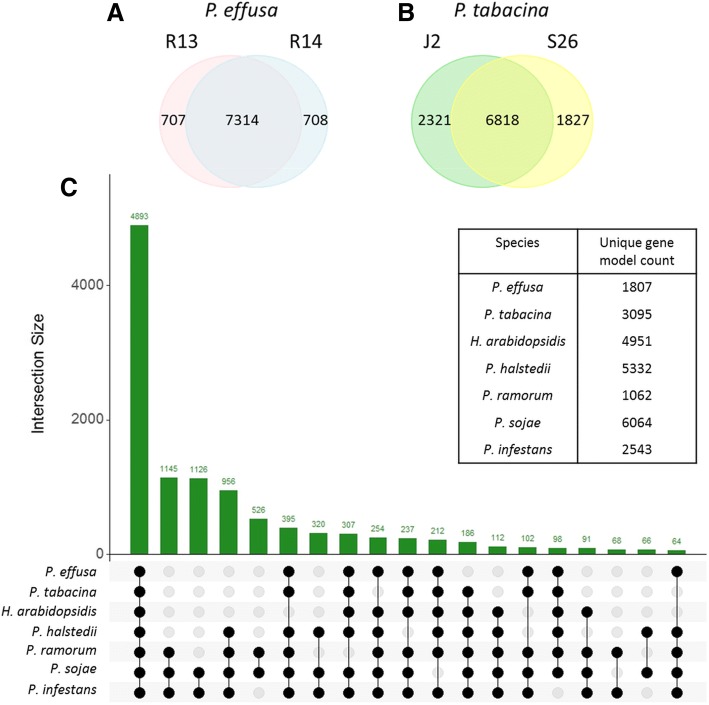
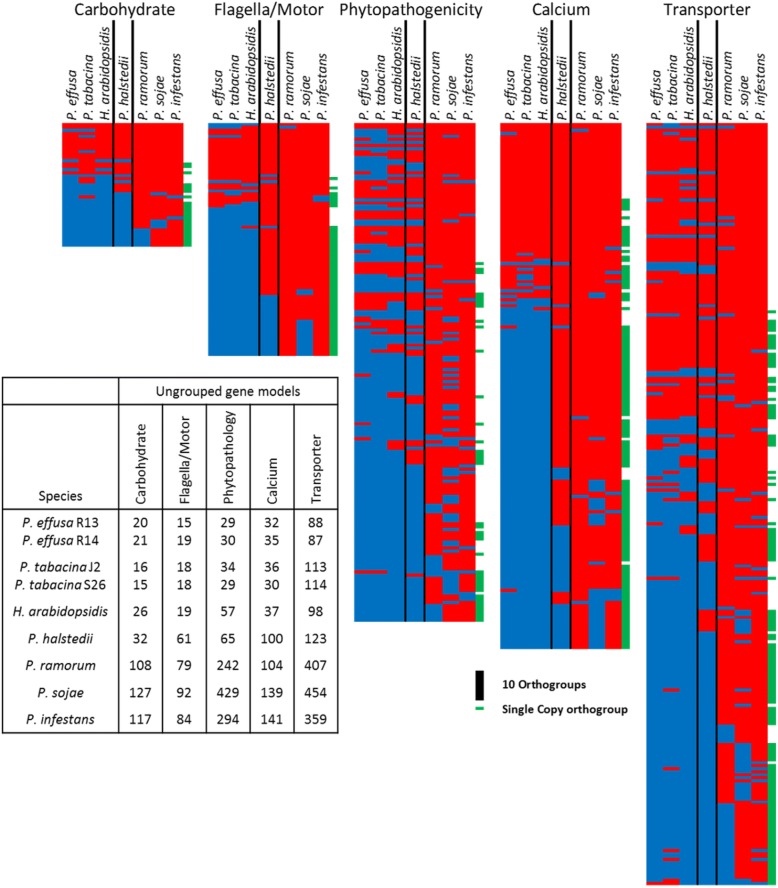
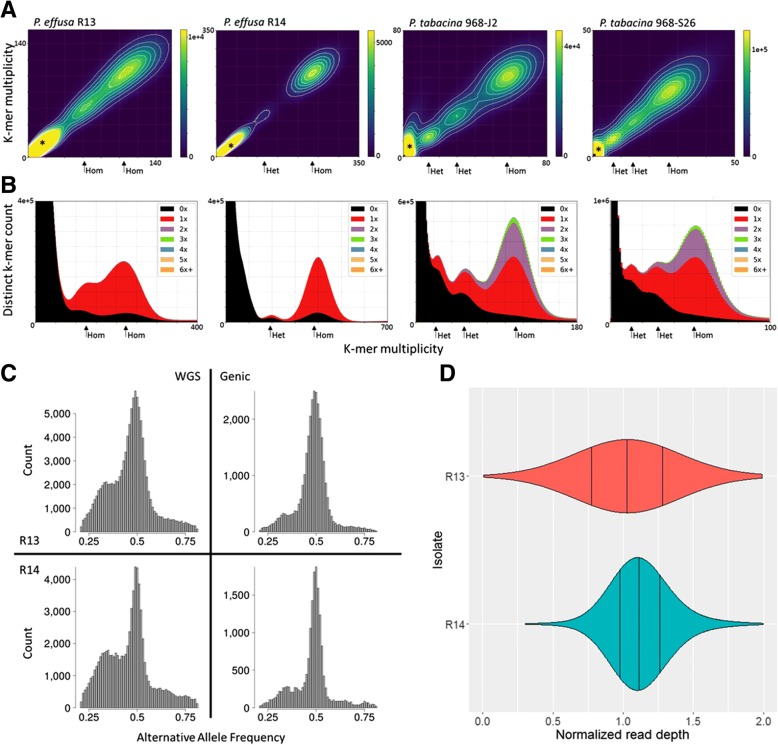
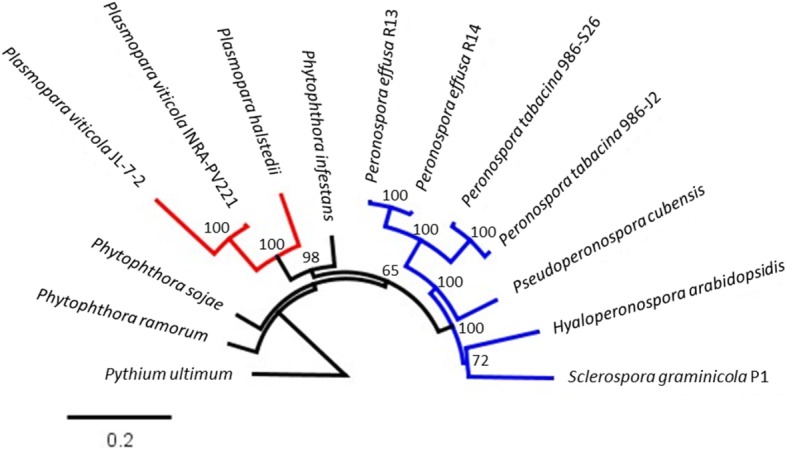
Results: We virulence phenotyped, sequenced, and assembled two isolates of P. effusa from the Salinas Valley, California, U.S.A. that were identified as race 13 and 14. These assemblies are high quality in comparison to assemblies of other downy mildews having low total scaffold count (784 & 880), high contig N50s (48 kb & 52 kb), high BUSCO completion and low BUSCO duplication scores and share many syntenic blocks with Phytophthora species. Comparative analysis of four downy mildew and three Phytophthora species revealed parallel absences of genes encoding conserved domains linked to transporters, pathogenesis, and carbohydrate activity in the biotrophic species. Downy mildews surveyed that have lost the ability to produce zoospores have a common loss of flagella/motor and calcium domain encoding genes. Our phylogenomic data support multiple origins of downy mildews from hemibiotrophic progenitors and suggest that common gene losses in these downy mildews may be of genes involved in the necrotrophic stages of Phytophthora spp.
Conclusions: We present a high-quality draft genome of Peronospora effusa that will serve as a reference for Peronospora spp. We identified several Pfam domains as under-represented in the downy mildews consistent with the loss of zoosporegenesis and necrotrophy. Phylogenomics provides further support for a polyphyletic origin of downy mildews.
Keywords: Biotrophy; Gene loss; Genomics; Oomycete; Peronospora effusa; Peronospora farinosa; Peronospora lineage; Spinach downy mildew.
Conflict of interest statement
Ethics approval and consent to participate
Not applicable.
Consent for publication
Not applicable.
Competing interests
The authors declare that they have no competing interests.
Publisher’s Note
Springer Nature remains neutral with regard to jurisdictional claims in published maps and institutional affiliations.
Figures

Similar articles
-
Genome reconstruction of the non-culturable spinach downy mildew Peronospora effusa by metagenome filtering.PLoS One. 2020 May 12;15(5):e0225808. doi: 10.1371/journal.pone.0225808. eCollection 2020. PLoS One. 2020. PMID: 32396560 Free PMC article.
-
Multiple origins of downy mildews and mito-nuclear discordance within the paraphyletic genus Phytophthora.PLoS One. 2018 Mar 12;13(3):e0192502. doi: 10.1371/journal.pone.0192502. eCollection 2018. PLoS One. 2018. PMID: 29529094 Free PMC article.
-
New Races and Novel Strains of the Spinach Downy Mildew Pathogen Peronospora effusa.Plant Dis. 2018 Mar;102(3):613-618. doi: 10.1094/PDIS-05-17-0781-RE. Epub 2018 Jan 23. Plant Dis. 2018. PMID: 30673485
-
Advances in Diagnostics of Downy Mildews: Lessons Learned from Other Oomycetes and Future Challenges.Plant Dis. 2018 Feb;102(2):265-275. doi: 10.1094/PDIS-09-17-1455-FE. Epub 2018 Jan 5. Plant Dis. 2018. PMID: 30673522 Review.
-
Recent developments in plant-downy mildew interactions.Semin Cell Dev Biol. 2023 Oct-Nov;148-149:42-50. doi: 10.1016/j.semcdb.2023.01.010. Epub 2023 Jan 18. Semin Cell Dev Biol. 2023. PMID: 36670035 Review.
Cited by
-
Comparative Genomic and Proteomic Analyses of Three Widespread Phytophthora Species: Phytophthora chlamydospora, Phytophthora gonapodyides and Phytophthora pseudosyringae.Microorganisms. 2020 Apr 30;8(5):653. doi: 10.3390/microorganisms8050653. Microorganisms. 2020. PMID: 32365808 Free PMC article.
-
Sexual reproduction contributes to the evolution of resistance-breaking isolates of the spinach pathogen Peronospora effusa.Environ Microbiol. 2022 Mar;24(3):1622-1637. doi: 10.1111/1462-2920.15944. Epub 2022 Feb 28. Environ Microbiol. 2022. PMID: 35191594 Free PMC article.
-
Genomic and transcriptomic analyses of Phytophthora cinnamomi reveal complex genome architecture, expansion of pathogenicity factors, and host-dependent gene expression profiles.Front Microbiol. 2024 Aug 15;15:1341803. doi: 10.3389/fmicb.2024.1341803. eCollection 2024. Front Microbiol. 2024. PMID: 39211322 Free PMC article.
-
Variance of allele balance calculated from low coverage sequencing data infers departure from a diploid state.BMC Bioinformatics. 2022 Apr 25;23(1):150. doi: 10.1186/s12859-022-04685-z. BMC Bioinformatics. 2022. PMID: 35468720 Free PMC article.
-
Mitochondrial genome sequence of Phytophthora sansomeana and comparative analysis of Phytophthora mitochondrial genomes.PLoS One. 2020 May 14;15(5):e0231296. doi: 10.1371/journal.pone.0231296. eCollection 2020. PLoS One. 2020. PMID: 32407378 Free PMC article.
References
-
- Sharma R, Xia X, Cano LM, Evangelisti E, Kemen E, Judelson H, Oome S, Sambles C, van den Hoogen DJ, Kitner M, et al. Genome analyses of the sunflower pathogen Plasmopara halstedii provide insights into effector evolution in downy mildews and Phytophthora. BMC Genomics. 2015;16(1):741. doi: 10.1186/s12864-015-1904-7. - DOI - PMC - PubMed
-
- Correll JC, Bluhm BH, Feng C, Lamour K, du Toit LJ, Koike ST. Spinach: better management of downy mildew and white rust through genomics. Eur J Plant Pathol. 2011;129(2):193–205. doi: 10.1007/s10658-010-9713-y. - DOI
Publication types
MeSH terms
Grants and funding
LinkOut - more resources
Full Text Sources
Molecular Biology Databases
Miscellaneous
