. 2018 Nov 29;19(1):849.
doi: 10.1186/s12864-018-5207-7.

Altered expression of K13 disrupts DNA replication and repair in Plasmodium falciparum

Affiliations

Altered expression of K13 disrupts DNA replication and repair in Plasmodium falciparum

Justin Gibbons et al. BMC Genomics. .

Abstract

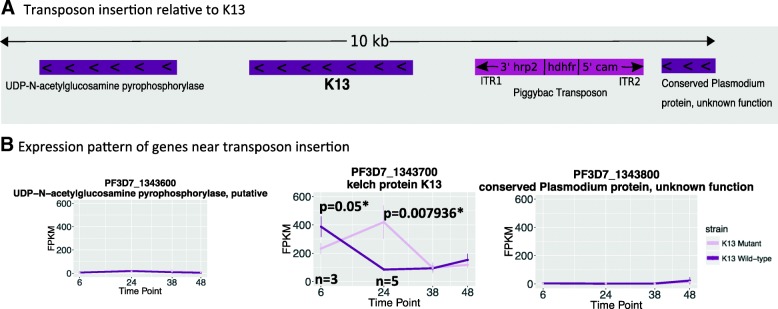
Background: Plasmodium falciparum exhibits resistance to the artemisinin component of the frontline antimalarial treatment Artemisinin-based Combination Therapy in South East Asia. Millions of lives will be at risk if artemisinin resistance (ART-R) spreads to Africa. Single non-synonymous mutations in the propeller region of PF3D7_1343700,"K13" are implicated in resistance. In this work, we use transcriptional profiling to characterize a laboratory-generated k13 insertional mutant previously demonstrated to have increased sensitivity to artemisinins to explore the functional role of k13.

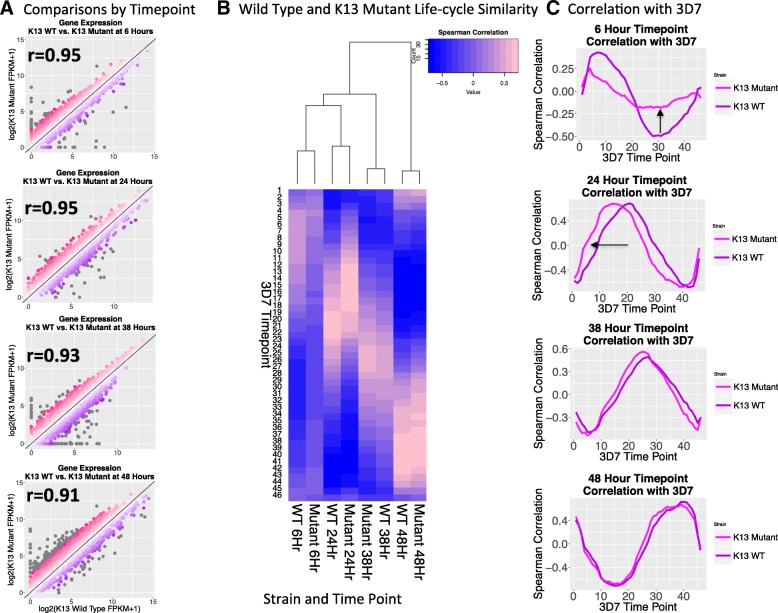
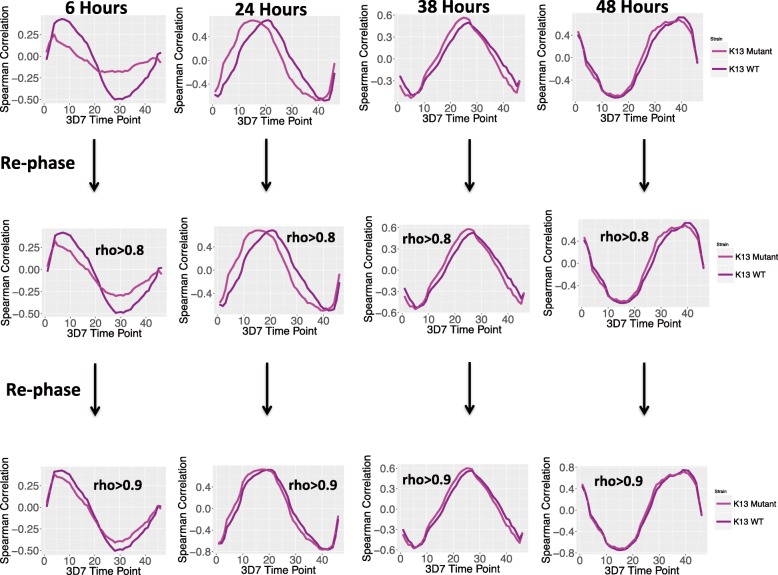
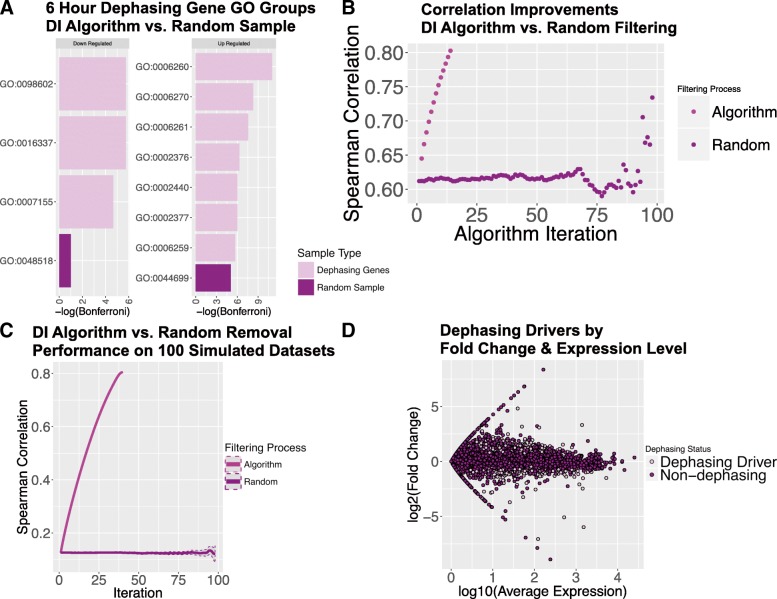
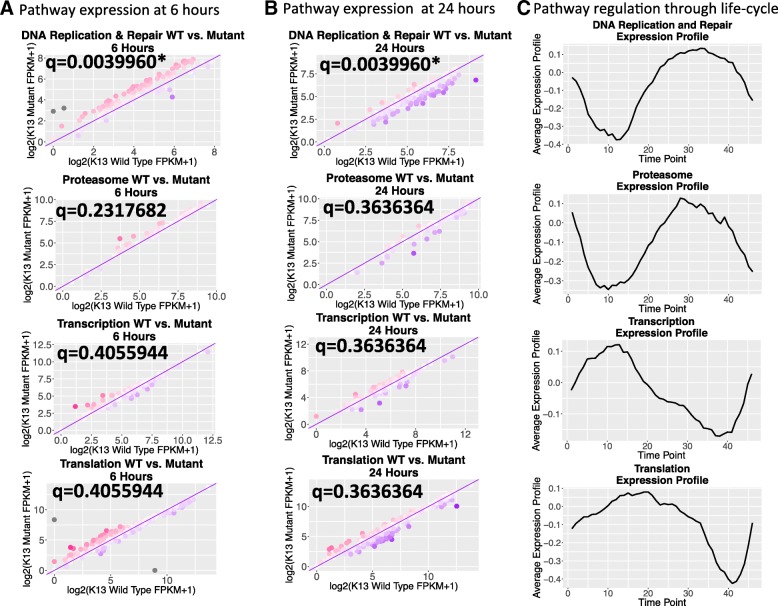
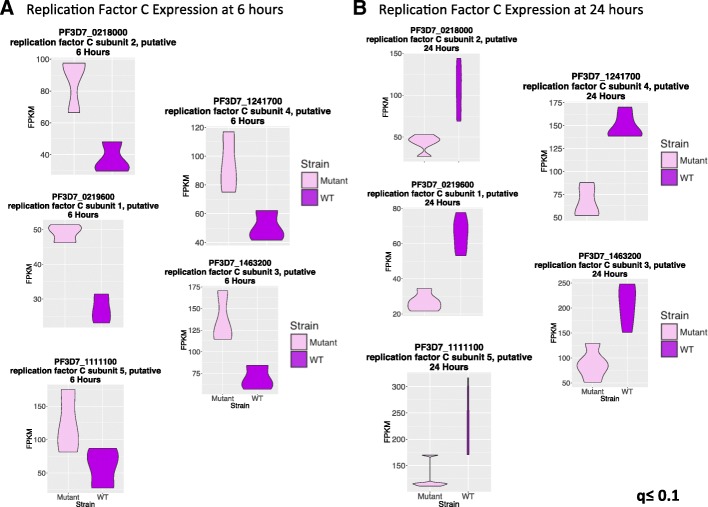
Results: A set of RNA-seq and microarray experiments confirmed that the expression profile of k13 is specifically altered during the early ring and early trophozoite stages of the mutant intraerythrocytic development cycle. The down-regulation of k13 transcripts in this mutant during the early ring stage is associated with a transcriptome advance towards a more trophozoite-like state. To discover the specific downstream effect of k13 dysregulation, we developed a new computational method to search for differential gene expression while accounting for the temporal sequence of transcription. We found that the strongest biological signature of the transcriptome shift is an up-regulation of DNA replication and repair genes during the early ring developmental stage and a down-regulation of DNA replication and repair genes during the early trophozoite stage; by contrast, the expressions of housekeeping genes are unchanged. This effect, due to k13 dysregulation, is antagonistic, such that k13 levels are negatively correlated with DNA replication and repair gene expression.

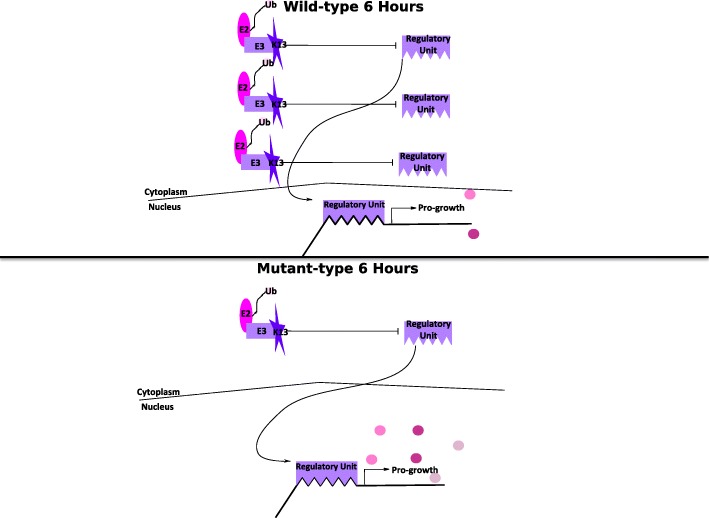
Conclusion: Our results support a role for k13 as a stress response regulator consistent with the hypothesis that artemisinins mode of action is oxidative stress and k13 as a functional homolog of Keap1 which in humans regulates DNA replication and repair genes in response to oxidative stress.

Keywords: Artemisinin; Drug-resistance; K13; Malaria.


Conflict of interest statement

Ethics approval and consent to participate

Ethical approval for the use of human blood in this study was granted by the Institutional Review Boards of the University of South Florida and the University of Notre Dame. All of the blood used for the in vitro culturing of parasites was obtained from healthy adult volunteers and drawn by trained personal from Interstate Blood Bank.

Consent for publication

Not applicable.

Competing interests

The authors declare that they have no competing interests.

Publisher’s Note

Springer Nature remains neutral with regard to jurisdictional claims in published maps and institutional affiliations.

Figures

Fig. 1
Fig. 1
Transposon insertion and its effect on gene expression. (a) Insertion of a PiggyBac Transposon in the 5′ upstream region the gene k13 (b) results in the gene being aberrantly down-regulated at the 6 h time point and up-regulated at the 24 h time point. The expression of k13’s same strand neighbors are unaffected by the insertion. The changes in K13 expression are consistent with the known regulation of the calmodulin promoter in P. falciparum. The transcript expression is measured in fragments per kilobase per million mapped reads (FPKM). The abbreviations for the piggybac transposon are: inverted terminal repeat 1 (ITR1), histidine-rich protein-2 (hrp2), human dihydrofolate reductase (hdhfr), regulatory elements of calmodulin (cam), and inverted terminal repeat 2 (ITR2). The insertion occurs 1034 nucleotides up-stream of k13 (see Additional file 1: S1 for a finer resolution mapping of the insertion site)
Fig. 2
Fig. 2
Effects of K13 dysregulation on transcriptome. (a) Comparing wild-type and K13 mutant transcript expression at their respective time points shows that the two strains are very similar. Grey dots represent absolute fold changes greater than 2.5. (b) Clustering all of the time-points based on their similarity to the 3D7 reference transcriptome from Derisi shows that from a global perspective the two strains are very similar and the time points have their highest similarities to the expected reference time-points and progression through the erythrocytic cycle is visible in the heatmap. However, at the 6 h time-point the mutant strain shows a stronger similarity to trophozoite time-points compared to the wild-type strain and at 24 h the mutant shows a less dramatic shift towards similarity with earlier time points. (c) Plotting the sample correlations with the 3D7 reference transcriptome from Derisi makes the disruption to the mutant 6 h transcriptome more evident. With the exception of the mutant 6 h they all show that there is a gradual increasing in similarity as the sample time point approaches the equivalent 3D7 time point and then a gradual decrease in similarity as it moves away from the time point. This periodic structure is disrupted in the mutant at 6 h. The sequencing quality of the wild-type and mutant 6 h samples are equivalent (Additional file 1: S1) indicating this disruption cannot be attributed to differences in sequencing quality. This transcriptomic shift is also not attributable to increased sample variation since variation in the 6 h samples is no greater than the variation of the other time point samples (Additional file 1: S5) or to a transposon specific effect (Additional file 1: S6). The arrows are indicating the direction of the transcriptome shifts
Fig. 3
Fig. 3
The DI Algorithm identifies genes responsible for IDC correlation shifts. The DI algorithm identifies the genes responsible for decreasing the correlations of the mutant and wild-type transcriptomes by iteratively removing genes that show the largest changes in rank expression between them. The genes are removed in one quantile batches and the correlations between the transcriptomes are re-computed. The filtering process ends when the correlation between the mutant and wild-type transcriptomes is at least as good as the highest correlation either has with the Derisi 3D7 IDC transcriptome. The correlation to Derisi 3D7 IDC transcriptome was chosen as an unbiased cut-off since 2 samples from the same lab should be at least as well correlated with each other as a sample from a different lab. For the 6 h samples the DI algorithm identified 546 genes as most disruptive to the transcriptome correlations and for the 24 h samples 127 genes were identified as being de-phasing genes. The overlap between the dephasing sets was small (23 genes), but the genes identified as dephasing at 6 h showed consistent regulatory changes at 24 h (Additional file 2: S2–S5). The DI algorithm did not identify any genes as major disruptors in either the 38 h or 48 h samples. The shift in the 38 and 48 h curves results because the DI algorithm can make correlation curves arbitrarily precise, however the genes removed did not qualify as dephasing because the mutant and wild-type samples were already better correlated with each other than with the Derisi reference set
Fig. 4
Fig. 4
DI Algorithm performance. (a) The DI algorithm identifies more functionally related groups of genes than a random sampling of genes. Since functionally related genes tend to be regulated together this suggests that the DI algorithm is identifying genes that are differentially regulated between the wild-type and K13 mutant strains. At 6 h red blood cell invasion and exported proteins are over-represented amongst the down-regulated dephasing genes (GO:0098602--single organism cell adhesion, GO:0016337--single organismal cell-cell adhesion, GO:0007155--cell adhesion, GO:0048518--positive regulation of biological process,) and DNA replication and immune system processes are over-represented amongst the up-regulated dephasing genes (GO:0006260--DNA replication, GO:0006270--DNA replication initiation, GO:0006261--DNA-dependent DNA replication, GO:0002376--immune system process, GO:0002440--production of molecular mediator of immune response, GO:0002377--immunoglobulin production, GO:0006259--DNA metabolic process, GO:0044699--single-organism process). The graph for 24 h is Additional file 2: S1. (b) The DI algorithm consistently improves the correlations between 2 samples with each iteration while randomly removing genes does not. (c) The DI algorithm was tested on 100 simulated data sets and consistently identified the genes responsible for the poor correlations between the samples while randomly removing genes did not. The grey areas around the curves are the 95% confidence intervals. (d) Filtering out lowly expressed genes prevents the DI algorithm from identifying high variance-low confidence genes as dephasing (Additional file 2: S7). This volcano plot shows that the identification of dephasing driver genes is not biased by expression level like other methods of detecting transcriptome differences between samples
Fig. 5
Fig. 5
DNA replication and repair pathways are dysregulated, but housekeeping pathways are not. There are clear shifts in the expression patterns of the DNA replication and repair genes that are not apparent in other gene sets that also undergo rapid transcriptional regulation at the same points of the life-cycle. As indicated by the data from Bozdech et al. 2003, the proteasome, transcriptional machinery and translational machinery (Additional file 3) all undergo rapid changes in transcript expression levels around 6 and 24 h of the intraerythrocytic life-cycle (c) but these gene sets show consistent expression in the wild-type and mutant strains which supports the idea that the dysregulation observed in the DNA replication and repair genes is not due to time point sampling error but results from the dysregulation of k13. Grey dots represent absolute fold changes greater than 2.5. The DNA replication and repair pathways were combined into a single plot because they undergo equivalent rates of transcriptional regulation (Additional file 1: S8). The q statistic in (a) and (b) refers to the false discovery rate
Fig. 6
Fig. 6
Replication factor C complex is dysregulated in K13 mutant. Network analysis links K13 to DNA replication in general and replication factor C in particular [29]. The replication factor C subunits show consistent changes in expression at 6 and 24 h (a, b) consistent with K13 being a negative regulator of DNA replication. Microarray measurements from theses time points are also consistent with the RNA-seq data presented here (Additional file 1: S10). The false discovery rate (q) was less than or equal to 0.1 for all comparisons made
Fig. 7
Fig. 7
Proposed model of K13’s biological role. The crystal structure of K13 resembles the E3 ubiquitin substrate ligase adapter Keap1, which is known as a stress response regulator in humans. The structural similarity and the data suggest that K13 functions similarly to Keap1 promoting the inhibition of a pro-growth regulatory unit via ubiquitination of a regulatory element that is subsequently degraded by the proteasome. In this model down-regulation of K13 at 6 h would result in an increased number of functional regulatory units promoting the transcription of pro-growth genes, which would explain the transcriptome shift at 6 h towards latter life-cycle transcriptomes

References

    1. Organization WH . World Malaria Report. 2016. p. 2016.
    1. Organization WH . World Malaria Report. 2005. p. 2005.
    1. Lubell Y, Dondorp A, Guérin PJ, Drake T, Meek S, et al. Artemisinin resistance – modelling the potential human and economic costs. Malar J. 2014;13:452. doi: 10.1186/1475-2875-13-452. - DOI - PMC - PubMed
    1. Amaratunga Chanaki, Lim Pharath, Suon Seila, Sreng Sokunthea, Mao Sivanna, Sopha Chantha, Sam Baramey, Dek Dalin, Try Vorleak, Amato Roberto, Blessborn Daniel, Song Lijiang, Tullo Gregory S, Fay Michael P, Anderson Jennifer M, Tarning Joel, Fairhurst Rick M. Dihydroartemisinin–piperaquine resistance in Plasmodium falciparum malaria in Cambodia: a multisite prospective cohort study. The Lancet Infectious Diseases. 2016;16(3):357–365. doi: 10.1016/S1473-3099(15)00487-9. - DOI - PMC - PubMed
    1. Imwong M, Suwannasin K, Kunasol C, Sutawong K, Mayxay M, et al. The spread of artemisinin-resistant Plasmodium falciparum in the Greater Mekong subregion: a molecular epidemiology observational study. Lancet Infect Dis. 2017;17:491–497. doi: 10.1016/S1473-3099(17)30048-8. - DOI - PMC - PubMed

Substances