Induction of cell cycle arrest and inflammatory genes by combined treatment with epigenetic, differentiating, and chemotherapeutic agents in triple-negative breast cancer
- PMID: 30486871
- PMCID: PMC6263070
- DOI: 10.1186/s13058-018-1068-x
Induction of cell cycle arrest and inflammatory genes by combined treatment with epigenetic, differentiating, and chemotherapeutic agents in triple-negative breast cancer
Abstract
Background: A combination of entinostat, all-trans retinoic acid, and doxorubicin (EAD) induces cell death and differentiation and causes significant regression of xenografts of triple-negative breast cancer (TNBC).
Methods: We investigated the mechanisms underlying the antitumor effects of each component of the EAD combination therapy by high-throughput gene expression profiling of drug-treated cells.
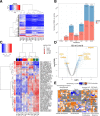
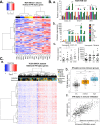
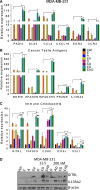
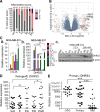
Results: Microarray analysis showed that entinostat and doxorubicin (ED) altered expression of genes related to growth arrest, inflammation, and differentiation. ED downregulated MYC, E2F, and G2M cell cycle genes. Accordingly, entinostat sensitized the cells to doxorubicin-induced growth arrest at G2. ED induced interferon genes, which correlated with breast tumors containing a higher proportion of tumor-infiltrating lymphocytes. ED also increased the expression of immune checkpoint agonists and cancer testis antigens. Analysis of TNBC xenografts showed that EAD enhanced the inflammation score in nude mice. Among the genes differentially regulated between the EAD and ED groups, an all-trans retinoic acid (ATRA)-regulated gene, DHRS3, was induced in EAD-treated xenografts. DHRS3 was expressed at lower levels in human TNBC metastases compared to normal breast or primary tumors. High expression of ED-induced growth arrest and inflammatory genes was associated with better prognosis in TNBC patients.
Conclusions: Entinostat potentiated doxorubicin-mediated cell death and the combination induced inflammatory signatures. The ED-induced immunomodulation may improve immunotherapy. Addition of ATRA to ED may potentiate inflammation and contribute to TNBC regression.
Keywords: Breast cancer; Entinostat; Epigenetic; Immunotherapy.
Conflict of interest statement
Ethics approval and consent to participate
Freshly resected breast tissue of women undergoing reduction mammoplasty, primary tumors, and pleural effusion from women undergoing treatment and from the Rapid Autopsy Program, were provided by the Johns Hopkins Surgical Pathology Department, under protocols approved by the institutional review board. All animal studies were performed according to the guidelines and approval of the Animal Care Committee of the Johns Hopkins School of Medicine, Baltimore.
Consent for publication
All authors approved the final version of this manuscript.
Competing interests
The authors declare that they have no competing interests.
Publisher’s Note
Springer Nature remains neutral with regard to jurisdictional claims in published maps and institutional affiliations.
Figures


Similar articles
-
Histone Deacetylase Inhibitor Enhances the Efficacy of MEK Inhibitor through NOXA-Mediated MCL1 Degradation in Triple-Negative and Inflammatory Breast Cancer.Clin Cancer Res. 2017 Aug 15;23(16):4780-4792. doi: 10.1158/1078-0432.CCR-16-2622. Epub 2017 May 2. Clin Cancer Res. 2017. PMID: 28465444 Free PMC article.
-
The bromodomain inhibitor OTX015 (MK-8628) exerts anti-tumor activity in triple-negative breast cancer models as single agent and in combination with everolimus.Oncotarget. 2017 Jan 31;8(5):7598-7613. doi: 10.18632/oncotarget.13814. Oncotarget. 2017. PMID: 27935867 Free PMC article.
-
Combined Treatment with Epigenetic, Differentiating, and Chemotherapeutic Agents Cooperatively Targets Tumor-Initiating Cells in Triple-Negative Breast Cancer.Cancer Res. 2016 Apr 1;76(7):2013-2024. doi: 10.1158/0008-5472.CAN-15-1619. Epub 2016 Jan 19. Cancer Res. 2016. PMID: 26787836 Free PMC article.
-
Tumor microenvironment: Challenges and opportunities in targeting metastasis of triple negative breast cancer.Pharmacol Res. 2020 Mar;153:104683. doi: 10.1016/j.phrs.2020.104683. Epub 2020 Feb 9. Pharmacol Res. 2020. PMID: 32050092 Review.
-
Targeting immune cells in tumor microenvironment in triple negative breast cancer therapy: future perspective to overcome doxorubicin resistance and toxicity.Med Oncol. 2025 Apr 4;42(5):150. doi: 10.1007/s12032-025-02712-6. Med Oncol. 2025. PMID: 40183881 Review.
Cited by
-
Identification of potential key genes and pathways predicting pathogenesis and prognosis for triple-negative breast cancer.Cancer Cell Int. 2019 Jun 28;19:172. doi: 10.1186/s12935-019-0884-0. eCollection 2019. Cancer Cell Int. 2019. PMID: 31297036 Free PMC article.
-
Unlocking the epigenetic code: new insights into triple-negative breast cancer.Front Oncol. 2024 Dec 18;14:1499950. doi: 10.3389/fonc.2024.1499950. eCollection 2024. Front Oncol. 2024. PMID: 39744000 Free PMC article. Review.
-
Nutraceuticals in the Mediterranean Diet: Potential Avenues for Breast Cancer Treatment.Nutrients. 2021 Jul 26;13(8):2557. doi: 10.3390/nu13082557. Nutrients. 2021. PMID: 34444715 Free PMC article. Review.
-
Identification of a metabolism-linked genomic signature for prognosis and immunotherapeutic efficiency in metastatic skin cutaneous melanoma.Medicine (Baltimore). 2024 Jun 7;103(23):e38347. doi: 10.1097/MD.0000000000038347. Medicine (Baltimore). 2024. PMID: 38847706 Free PMC article.
-
Understanding the Mechanisms by Which Epigenetic Modifiers Avert Therapy Resistance in Cancer.Front Oncol. 2020 Jun 24;10:992. doi: 10.3389/fonc.2020.00992. eCollection 2020. Front Oncol. 2020. PMID: 32670880 Free PMC article. Review.
References
-
- Seewaldt VL, Johnson BS, Parker MB, Collins SJ, Swisshelm K. Expression of retinoic acid receptor beta mediates retinoic acid-induced growth arrest and apoptosis in breast cancer cells. Cell Growth Differ. 1995;6(9):1077–1088. - PubMed
Publication types
MeSH terms
Substances
LinkOut - more resources
Full Text Sources
Molecular Biology Databases

