Identifying and Implementing Endpoints for Geriatric Mice
- PMID: 30486919
- PMCID: PMC6310203
- DOI: 10.30802/AALAS-CM-18-000022
Identifying and Implementing Endpoints for Geriatric Mice
Abstract
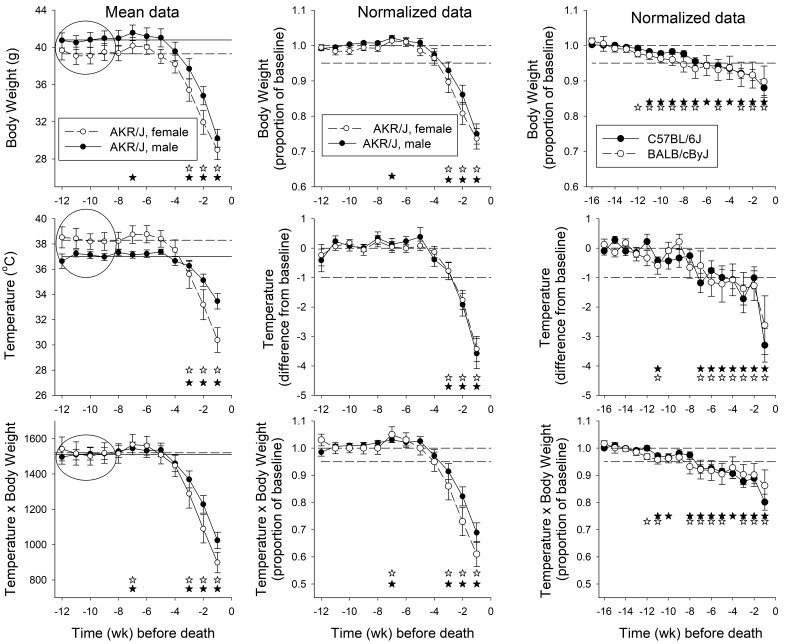
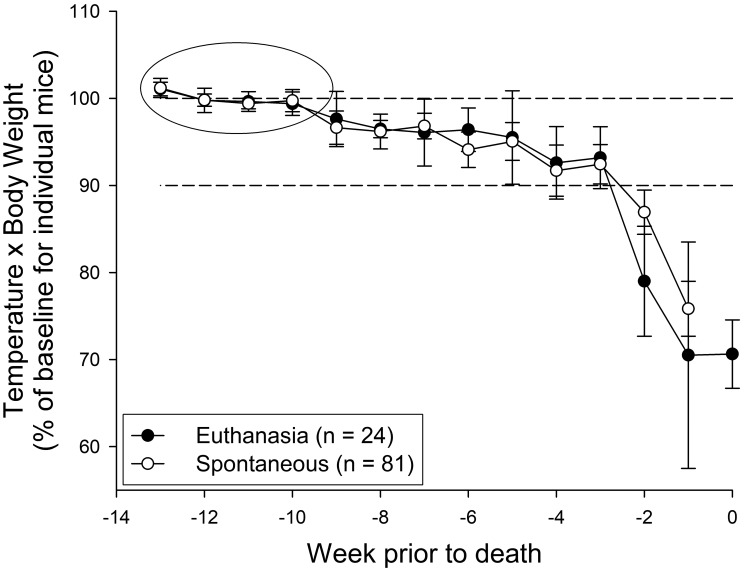
The types of changes in physical appearance and behavior that occur in elderly people similarly develop in elderly animals. Signs and symptoms that might cause concern in younger people or mice may be normal in their elderly but generally healthy counterparts. Although numerous scoring methods have been developed to assess rodent health, these systems were often designed for young adults used in specific types of research, such as cancer or neurologic studies, and therefore may be suboptimal for assessing aging rodents. Approaches known as frailty assessments provide a global evaluation of the health of aged mice, rats, and people, and mouse frailty scores correlate well with the likelihood of death. Complementing frailty assessment, prediction of imminent death in aged mice can often be accomplished by focusing on 2 objective parameters-body weight and temperature. Before they die, many (but not all) mice develop marked reductions in body weight and temperature, thus providing signs that close monitoring, intervention, or preemptive euthanasia may be necessary. Timely preemptive euthanasia allows antemortem collection of data and samples that would be lost if spontaneous death occurred; preemptive euthanasia also limits terminal suffering. These approaches to monitoring declining health and predicting death in elderly research mice can aid in establishing and implementing timely interventions that both benefit the research and reduce antemortem suffering.
Figures
Similar articles
-
Identification of markers for imminent death in mice used in longevity and aging research.J Am Assoc Lab Anim Sci. 2010 May;49(3):282-8. J Am Assoc Lab Anim Sci. 2010. PMID: 20587157 Free PMC article.
-
Markers for heightened monitoring, imminent death, and euthanasia in aged inbred mice.Comp Med. 2012 Jun;62(3):172-8. Comp Med. 2012. PMID: 22776049 Free PMC article.
-
Japan as the front-runner of super-aged societies: Perspectives from medicine and medical care in Japan.Geriatr Gerontol Int. 2015 Jun;15(6):673-87. doi: 10.1111/ggi.12450. Epub 2015 Feb 5. Geriatr Gerontol Int. 2015. PMID: 25656311
-
Aging clinical problems: a difficult balance between age and frailty.Monaldi Arch Chest Dis. 2016 Jun 22;84(1-2):727. doi: 10.4081/monaldi.2015.727. Monaldi Arch Chest Dis. 2016. PMID: 27374041 Review.
-
Cognitive Frailty in Geriatrics.Clin Geriatr Med. 2018 Nov;34(4):667-675. doi: 10.1016/j.cger.2018.06.011. Epub 2018 Aug 16. Clin Geriatr Med. 2018. PMID: 30336994 Review.
Cited by
-
Aberrant expression and localization of the RAP1 shelterin protein contribute to age-related phenotypes.PLoS Genet. 2022 Nov 28;18(11):e1010506. doi: 10.1371/journal.pgen.1010506. eCollection 2022 Nov. PLoS Genet. 2022. PMID: 36441670 Free PMC article.
-
Impact of aging on animal models of Parkinson's disease.Front Aging Neurosci. 2022 Jul 28;14:909273. doi: 10.3389/fnagi.2022.909273. eCollection 2022. Front Aging Neurosci. 2022. PMID: 35966779 Free PMC article.
-
Aging and miR-155 in mice influence survival and neuropathic pain after spinal cord injury.Brain Behav Immun. 2021 Oct;97:365-370. doi: 10.1016/j.bbi.2021.07.003. Epub 2021 Jul 17. Brain Behav Immun. 2021. PMID: 34284114 Free PMC article.
-
Long-term treatment with chloroquine increases lifespan in middle-aged male mice possibly via autophagy modulation, proteasome inhibition and glycogen metabolism.Aging (Albany NY). 2022 May 23;14(10):4195-4210. doi: 10.18632/aging.204069. Epub 2022 May 23. Aging (Albany NY). 2022. PMID: 35609021 Free PMC article.
-
Progressing the care, husbandry and management of ageing mice used in scientific studies.Lab Anim. 2020 Jun;54(3):225-238. doi: 10.1177/0023677219865291. Epub 2019 Aug 12. Lab Anim. 2020. PMID: 31403890 Free PMC article.
References
-
- Antoch MP, Wrobel M, Kuropatwinski KK, Gitlin I, Leonova KI, Gleiberman AS, Hutson AD, Chernova OB, Gudkov AV. 2017. Physiological frailty index (PFI): quantitative in-life estimate of individual biological age in mice. Aging (Albany NY) 9:615–626. https://www.aging-us.com/article/101206 - PMC - PubMed
-
- Aziz RK, Kansal R, Abdeltawab NF, Rowe SL, Su Y, Carrigan D, Nooh MM, Attia RR, Brannen C, Gardner LA, Lu L, Williams RW, Kotb M. 2007. Susceptibility to severe streptococcal sepsis: use of a large set of isogenic mouse lines to study genetic and environmental factors. Genes Immun 8:404–415. 10.1038/sj.gene.6364402. - DOI - PubMed
MeSH terms
LinkOut - more resources
Full Text Sources
Medical