. 2018 Dec 11;115(50):E11711-E11720.
doi: 10.1073/pnas.1814397115. Epub 2018 Nov 28.

Transcriptional landscape of B cell precursor acute lymphoblastic leukemia based on an international study of 1,223 cases

Affiliations

Transcriptional landscape of B cell precursor acute lymphoblastic leukemia based on an international study of 1,223 cases

Jian-Feng Li et al. Proc Natl Acad Sci U S A. .

Abstract

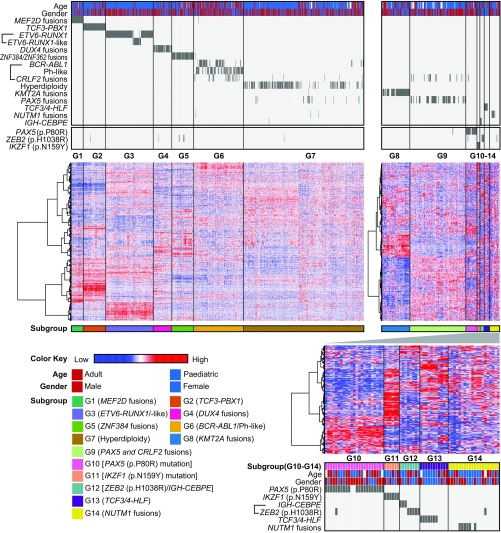
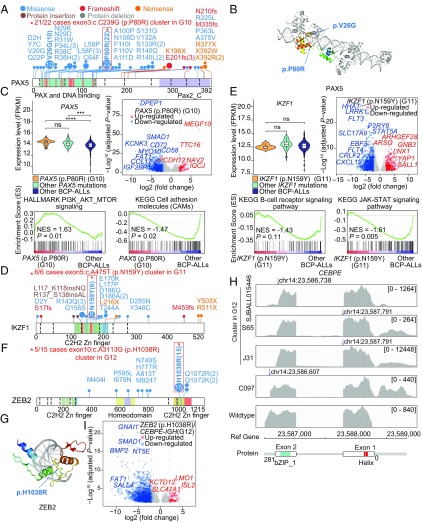
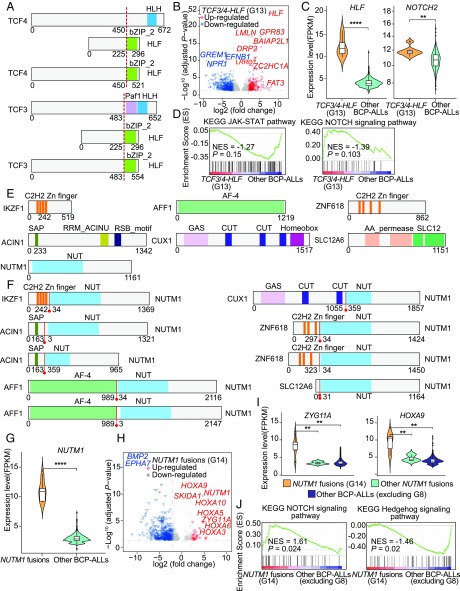
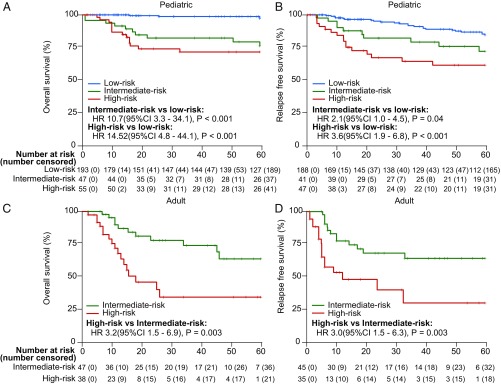
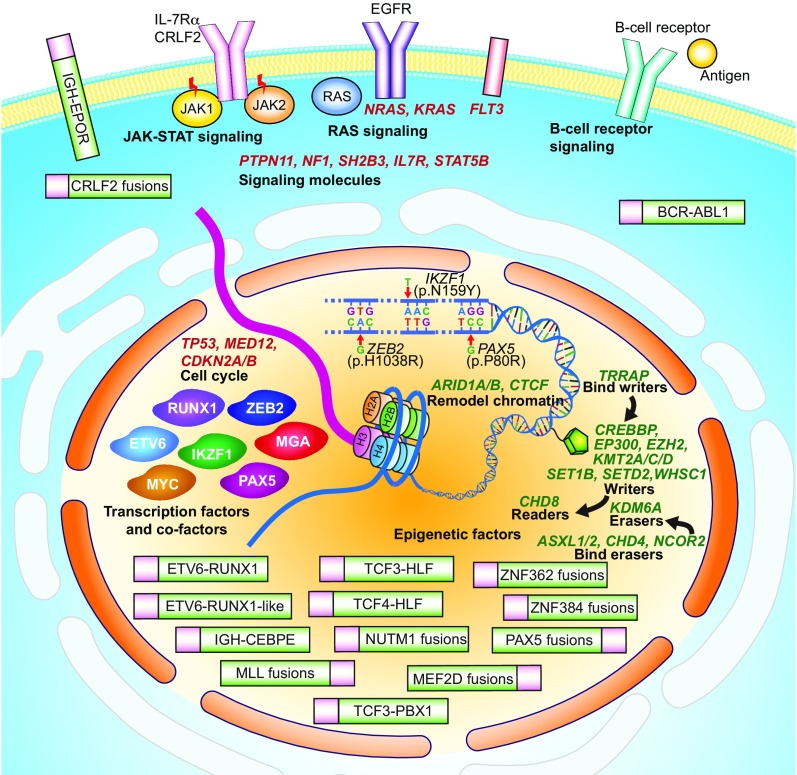
Most B cell precursor acute lymphoblastic leukemia (BCP ALL) can be classified into known major genetic subtypes, while a substantial proportion of BCP ALL remains poorly characterized in relation to its underlying genomic abnormalities. We therefore initiated a large-scale international study to reanalyze and delineate the transcriptome landscape of 1,223 BCP ALL cases using RNA sequencing. Fourteen BCP ALL gene expression subgroups (G1 to G14) were identified. Apart from extending eight previously described subgroups (G1 to G8 associated with MEF2D fusions, TCF3-PBX1 fusions, ETV6-RUNX1-positive/ETV6-RUNX1-like, DUX4 fusions, ZNF384 fusions, BCR-ABL1/Ph-like, high hyperdiploidy, and KMT2A fusions), we defined six additional gene expression subgroups: G9 was associated with both PAX5 and CRLF2 fusions; G10 and G11 with mutations in PAX5 (p.P80R) and IKZF1 (p.N159Y), respectively; G12 with IGH-CEBPE fusion and mutations in ZEB2 (p.H1038R); and G13 and G14 with TCF3/4-HLF and NUTM1 fusions, respectively. In pediatric BCP ALL, subgroups G2 to G5 and G7 (51 to 65/67 chromosomes) were associated with low-risk, G7 (with ≤50 chromosomes) and G9 were intermediate-risk, whereas G1, G6, and G8 were defined as high-risk subgroups. In adult BCP ALL, G1, G2, G6, and G8 were associated with high risk, while G4, G5, and G7 had relatively favorable outcomes. This large-scale transcriptome sequence analysis of BCP ALL revealed distinct molecular subgroups that reflect discrete pathways of BCP ALL, informing disease classification and prognostic stratification. The combined results strongly advocate that RNA sequencing be introduced into the clinical diagnostic workup of BCP ALL.

Keywords: BCP ALL; RNA-seq; gene fusion; gene mutation; subtypes.


Conflict of interest statement

The authors declare no conflict of interest.

Figures

Fig. 1.
Fig. 1.
Two-step unsupervised hierarchical clustering of the global gene expression profile from 1,223 BCP ALL patients. In the gene expression subgroups of G1 to G7 (Left) and G8 to G14 (Right), columns indicate 1,223 BCP ALL patients and rows represent gene expression levels or genetic features for each patient. Genes showing over- and underexpression in the heatmap are shown in red and blue, respectively. The first box above the heatmap indicates genotypes and fusion genes, followed by a box including three clusters of hotspot sequence mutations defined in this analysis. The first row below the heatmap specifies the 14 BCP ALL subgroups identified on the basis of gene expression profiles. In the unsupervised hierarchical clustering heatmap of G10 to G14 (Lower Right), columns represent patients and rows are top variance genes in G10 to G14. The box below the heatmap indicates the five gene expression subgroups, gender, and genotypes of the G10 to G14 clusters.
Fig. 2.
Fig. 2.
Schematic representation of identified PAX5 (p.P80R) (G10), IKZF1 (p.N159Y) (G11), and ZEB2 (p.H1038R)/IGH–CEBPE (G12) subgroups in BCP ALL. (A, D, and F) Protein domain plots and the positions of amino acid substitutions in distinct domains of the PAX5, IKZF1, and ZEB2 proteins. Hotspot mutations enriched in BCP ALL subgroups are marked with a red star (G10 to G12). (B and G) Structure prediction of the PAX5 and ZEB2 point mutations. The crystal structures of both the PAX5 and ZEB2 proteins were generated based on the Protein Data Bank using homology modeling. (C) Gene expression levels and gene set enrichment analysis (GSEA) of PAX5 (p.P80R) mutated cases. The violin plot (Left) shows the comparison of PAX5 expression levels between clusters of PAX5 (p.P80R)-positive samples, other PAX5 mutations, and all other cases. The mean and 25th and 75th percentiles are presented in the middle box of violin plots. The volcano plot (Right) shows differentially expressed genes between PAX5 (p.P80R)-positive (G10) patients and other patients. The x axis represents log2-transformed fold-change values, while the y axis is a −log10-transformed P value. Significantly up-regulated and down-regulated genes are shown in red and blue, respectively. GSEA plot of B-lymphocyte maturation and cell-adhesion molecules in PAX5 (p.P80R)-positive (G10) patients and other cases. P values were calculated by 1,000-gene set two-sided permutation tests. ns, not significant; *P < 0.05, **P < 0.01, ***P < 0.001, and ****P < 0.0001. (E) Gene expression levels and GSEA of cases showing the IKZF1 (p.N159Y) mutation (G11). The violin plot (Left) shows the comparison of IKZF1 expression levels between the cluster of IKZF1 (p.N159Y) cases (G11), cluster of other IKZF1 mutations, and other patients. The P values were calculated using Student’s t test. The volcano plot (Right) shows differentially expressed genes between IKZF1 (p.N159Y)-positive (G11) and -negative cases. GSEA plot of B cell receptor and the JAK-STAT signaling pathway in IKZF1 (p.N159Y)-positive (G11) and -negative cases. (H) Sequencing read coverage of CEBPE in four cases with IGH–CEBPE–positive BCP ALL (three cases are clustered in G12). The blue arrows indicate the fusion breakpoints. (I) Gene expression volcano plot of ZEB2 (p.H1038R)/IGH–CEBPE (G12) cases. The volcano plot (Right) shows differentially expressed genes between ZEB2 (p.H1038R)/IGH–CEBPE (G12) cases and negative cases. FPKM, fragments per kilobase of transcript per million mapped reads; ns, not significant; NES, normalized enrichment score; *P < 0.05, **P < 0.01, ***P < 0.001, and ****P < 0.0001.
Fig. 3.
Fig. 3.
Schematic representation of identified TCF3/4HLF and NUTM1 fusions in BCP ALL. (A) Protein structure of TCF3, TCF4, HLF, and their fusion proteins. The dotted red lines represent the joining points in the fusion proteins. (B) Violin plot of gene expression levels of HLF and NOTCH2 in TCF3/4–HLF fusion-positive and -negative patients. (C) Volcano plot of differentially expressed genes between TCF3/4–HLF fusion-positive and -negative patients. (D) GSEA plots of the JAK-STAT and NOTCH pathways in TCF3/4–HLF fusion-positive and -negative patients. (E) Protein structure of wild-type NUTM1 and distinct fusion partners. (F) Protein structure of each NUTM1 fusion protein. Red lines represent the joining points of the fusion proteins. (G) Violin plot of gene expression levels of NUTM1 in NUTM1 fusion-positive and -negative cases. (H) Volcano plot of differentially expressed genes between NUTM1 fusion-positive and -negative cases. (I) Violin plot of gene expression levels of ZYG11A and HOXA9 in NUTM1 fusion-positive and -negative patients, excluding KMT2A fusions. (J) GSEA plot of the NOTCH signaling and Hedgehog signaling pathways in NUTM1 fusion-positive (G14) and -negative patients excluding KMT2A fusions (G8) cases. *P < 0.05, **P < 0.01, ***P < 0.001, and ****P < 0.0001.
Fig. 4.
Fig. 4.
Overall survival rates of pediatric and adult BCP ALL patients. Five-year overall survival (OS) curves (A) and 5-y relapse-free survival (RFS) curves (B) of pediatric patients with low, intermediate, and high risk. Five-year OS curves (C) and 5-y RFS curves (D) of adult patients with intermediate and high risk. The ranges of hazard ratios (HRs) between low and intermediate risk, and low and high risk, are presented below the survival curves. Survival curves were estimated with the Kaplan–Meier method and compared by two-sided log-rank test. Note: In pediatric cases, TCF3–PBX1 (G2), ETV6–RUNX1–like (G3), DUX4 fusions (G4), ZNF384 fusions (G5), and high hyperdiploidy (G7; 51 to 65/67 chromosomes) subgroups displayed a low risk, other cases in G7 (≤50 chromosomes) and PAX5 and CRLF2 fusions (G9) showed an intermediate risk, whereas MEF2D fusions (G1), BCR-ABL1 (G6), and KMT2A fusions (G8) defined high-risk subgroups. In adult cases, MEF2D fusions (G1), TCF3–PBX1 (G2), BCR–ABL1 (G6), and KMT2A fusions (G8) were associated with high risk, while DUX4 fusions (G4), ZNF384 fusions (G5), and hyperdiploidy (G7) had relatively favorable outcomes. (AD) Numbers listed on the x-axis are in months.
Fig. 5.
Fig. 5.
Schematic figure of gene expression alterations and structural aberrations identified in this study. Representation of the various molecular abnormalities that lead to leukemogenesis in BCP ALL. Known and novel gene fusions and their subcellular localizations are schematically represented. Three hotspot mutations, ZEB2 (p.H1038R), IKZF1 (p.N159Y), and PAX5 (p.P80R), that define distinct BCP ALL subgroups are located in the DNA-binding domains of each protein. Identified mutations in epigenetic regulators, such as KMT2D and WHSC1, are colored in green and shown as a pentagon in the nucleus. Additionally, transcription factor mutations such as IKZF1 and PAX5 are depicted at the left in the nucleus near the DNA chain, and mutations in cell-cycle regulators are depicted at the top left of the nucleus. Mutations found in signaling pathways such as JAK-STAT, RAS, and B cell receptor are depicted below the cell-surface membrane. Note: The epigenetic regulatory genes that covalently modify histones are classified as writers, erasers, readers, and remodel. Writers: proteins that can add epigenetic modifications; erasers: proteins that erase epigenetic modifications; readers: proteins that can recognize epigenetic modifications; bind writers: proteins that can bind the writers; bind erasers: proteins that can bind the erasers. Remodel chromatin: proteins that are functionally relevant to chromatin remodeling. MLL fusions are also known as KMT2A fusions.

References

    1. Pui C-H, Yang JJ, Bhakta N, Rodriguez-Galindo C. Global efforts toward the cure of childhood acute lymphoblastic leukaemia. Lancet Child Adolesc Health. 2018;2:440–454. - PMC - PubMed
    1. Holmfeldt L, et al. The genomic landscape of hypodiploid acute lymphoblastic leukemia. Nat Genet. 2013;45:242–252. - PMC - PubMed
    1. Roberts KG, et al. Genetic alterations activating kinase and cytokine receptor signaling in high-risk acute lymphoblastic leukemia. Cancer Cell. 2012;22:153–166. - PMC - PubMed
    1. Den Boer ML, et al. A subtype of childhood acute lymphoblastic leukaemia with poor treatment outcome: A genome-wide classification study. Lancet Oncol. 2009;10:125–134. - PMC - PubMed
    1. Andersson A, et al. Microarray-based classification of a consecutive series of 121 childhood acute leukemias: Prediction of leukemic and genetic subtype as well as of minimal residual disease status. Leukemia. 2007;21:1198–1203. - PubMed

Publication types

Substances